A Paradigm Shift?

This week will be recorded in history as one of the most historic weeks in the 21st Century as the “Contrarian Central Bank", Bank of Japan (BOJ), raised its benchmark rates by 25 bps to 75 bps.
While we will discuss the decision in detail later, the rationale behind it was the persistent inflationary pressures Japan has witnessed over the last two years, driven by imported inflation due to the free fall in JPY.
As a result, Japanese core inflation (we use Core-Core here to exclude food) is now above US inflation for the first time since 1979.
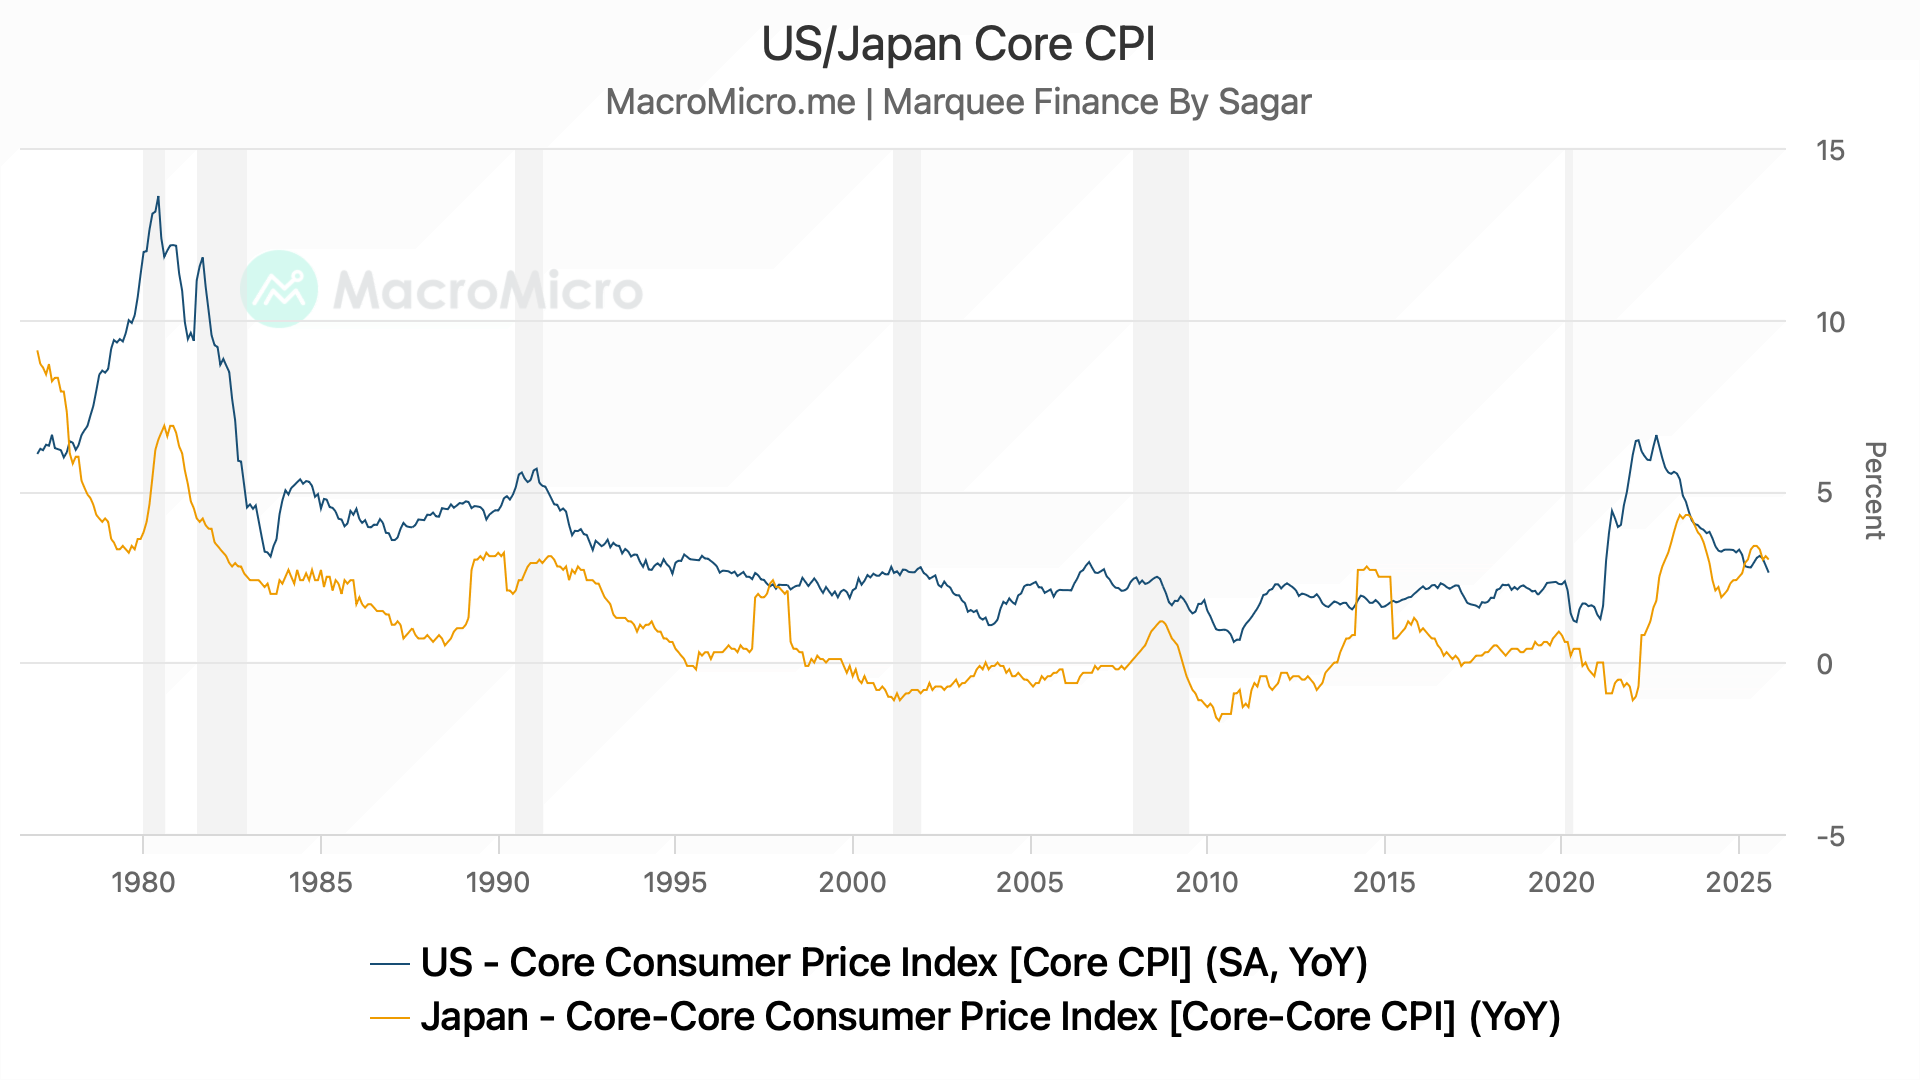
PS: Note that the previous two instances, 1997/2014, were due to the sales tax hike.
On the contrary, we witnessed a neutral hold by the ECB and a hawkish cut by the BOE in the central bank universe.
We planned the Global Outlook 2026 this week, but considering the enormous macro data dump and the central bank action, we delayed it to next Saturday.
The paradigm shift that we are witnessing in the global economy will have drastic consequences as we head into 2026.
We will dig deeper into the macro setup next week.
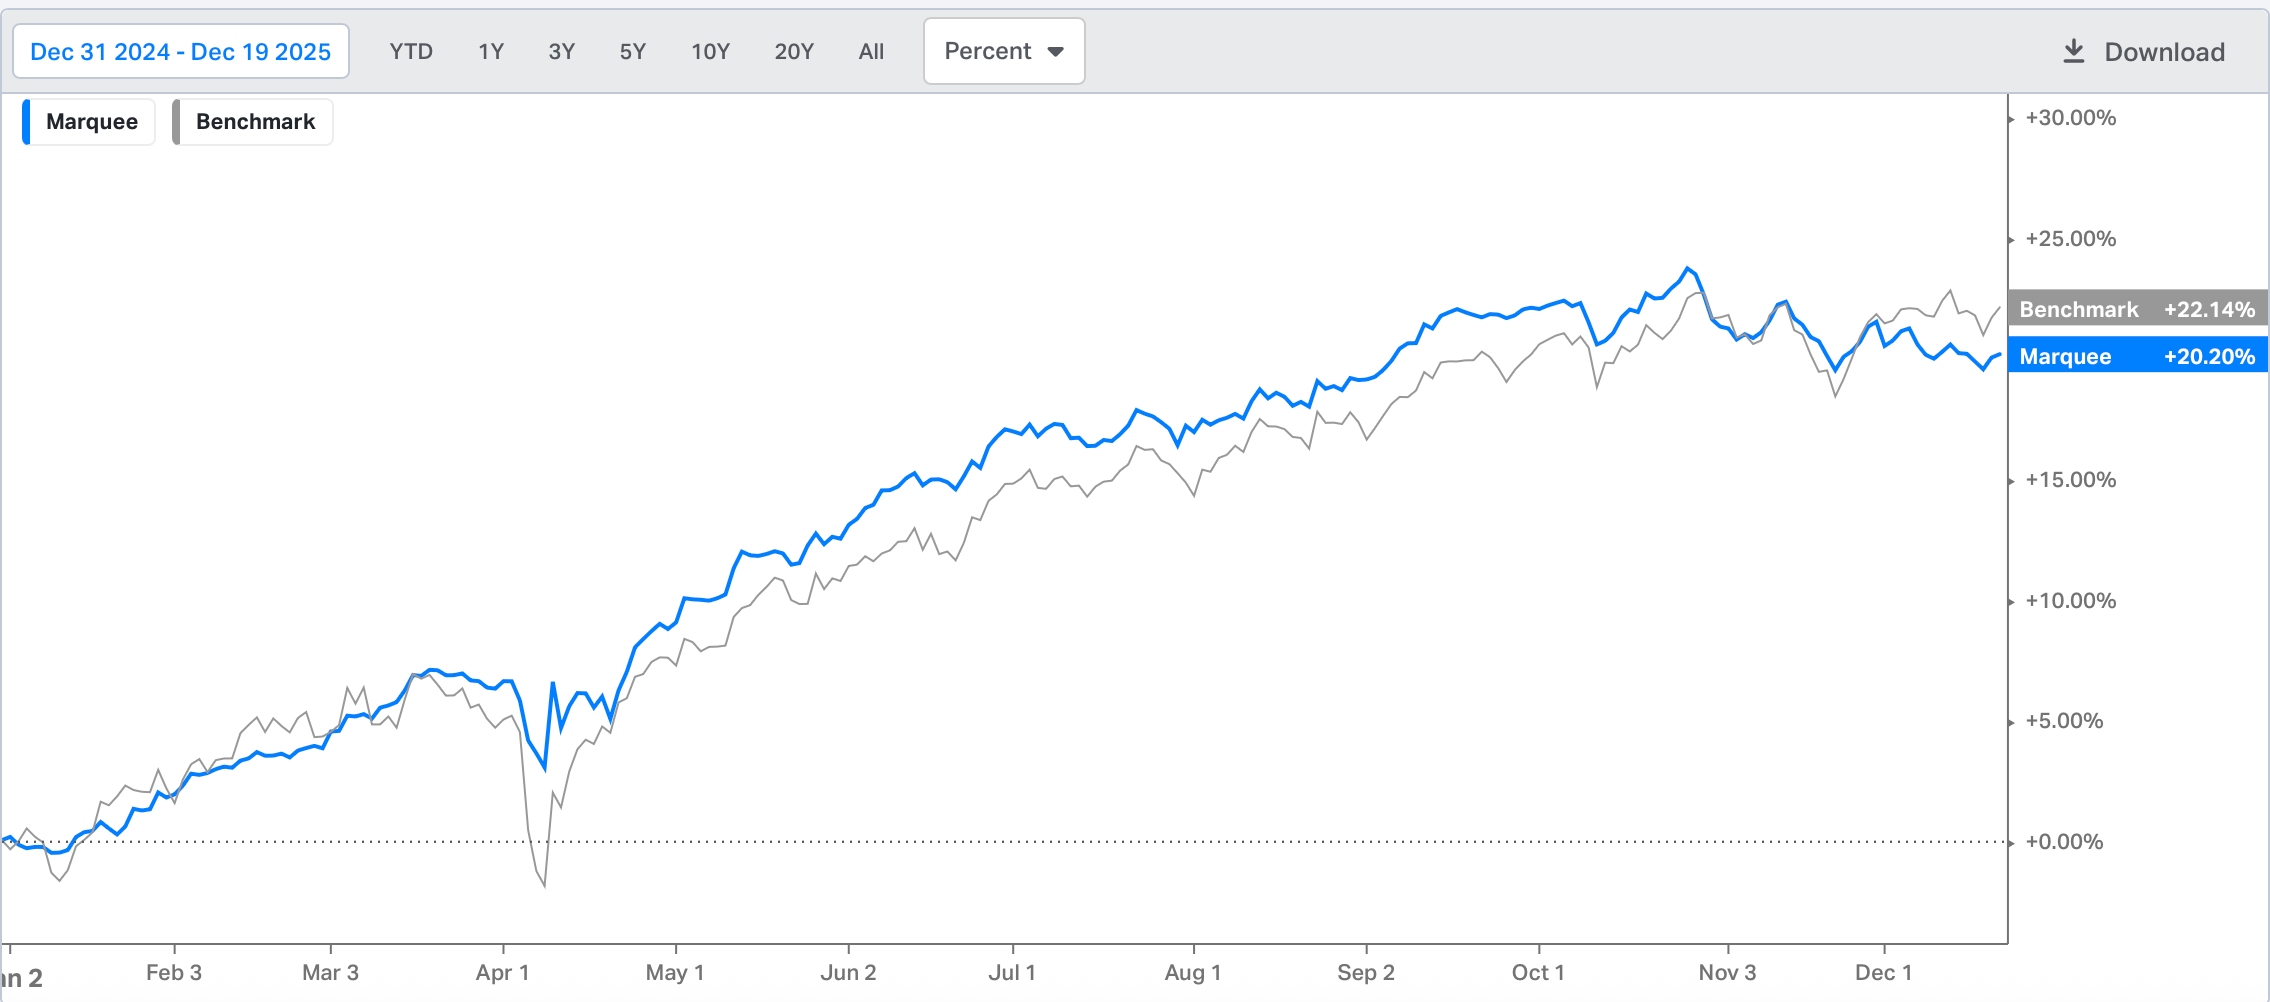
Since we raised cash in late November, we explicitly mentioned that we want to protect profits and end the year above 20%+ even if it means underperforming the benchmark in the near term.
We are on track to achieve what we desired as we are up 20.2% YTD!
Let’s dig deeper into the macro universe and examine the cross-asset moves.
US/ Equities/ Bonds/Silver/Gold/Oil/Dollar!
Last week, JayPo mentioned that, due to the government shutdown (data collection challenges), he will be sceptical of government data.
The CPI data was released this week, and there was considerable uproar on social media about how rents/OER were computed.
The news became a wildfire post the Fed’s mouthpiece, Nick Timiraos’ tweet.


Nonetheless, the trajectory of Shelter inflation is significantly lower than current levels, and disinflation will continue for at least 9-12 months.
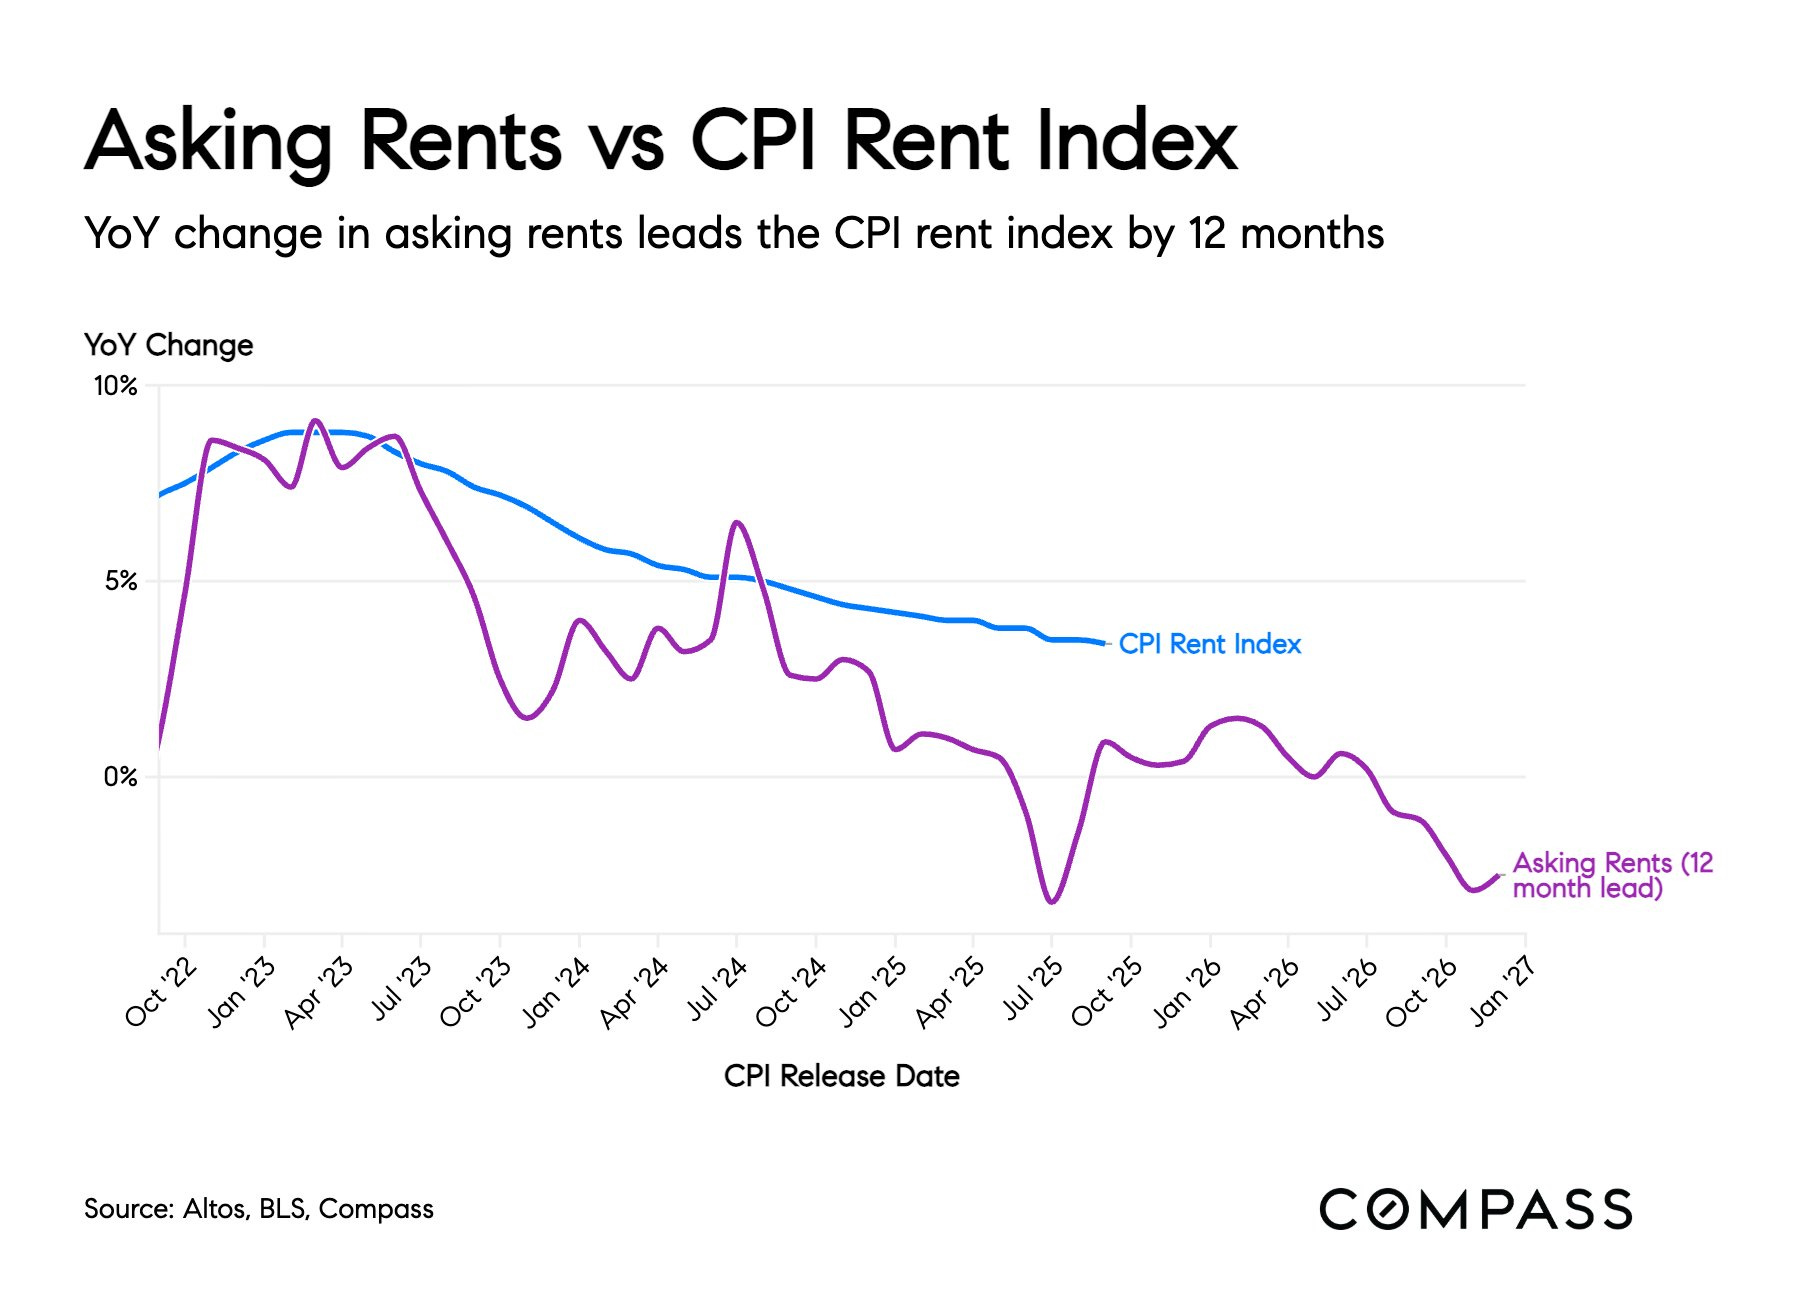
Note that we have been indicating since the past few months that the disinflation in the shelter inflation will put downward pressure on inflation and will potentially curb the goods inflation due to tariffs.
Trump appointee Miran has been advocating for more rate cuts than other Fed members, citing shelter disinflation.
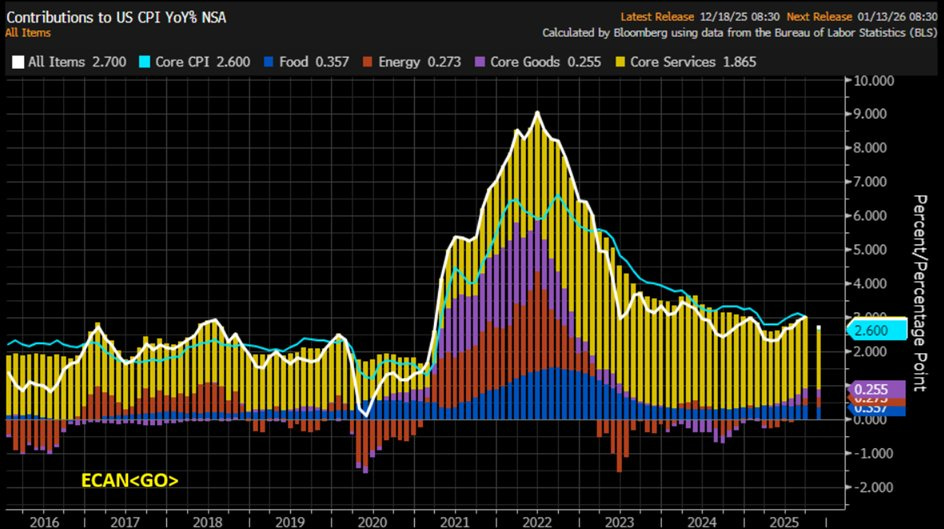
Nevertheless, the headline CPI came in at 2.7% vs. expectations of 3.1%, and the Core CPI came in at 2.6% vs. expectations of 3%.
Note that energy contributed to disinflation but has flipped to positive territory thanks to the base effect.
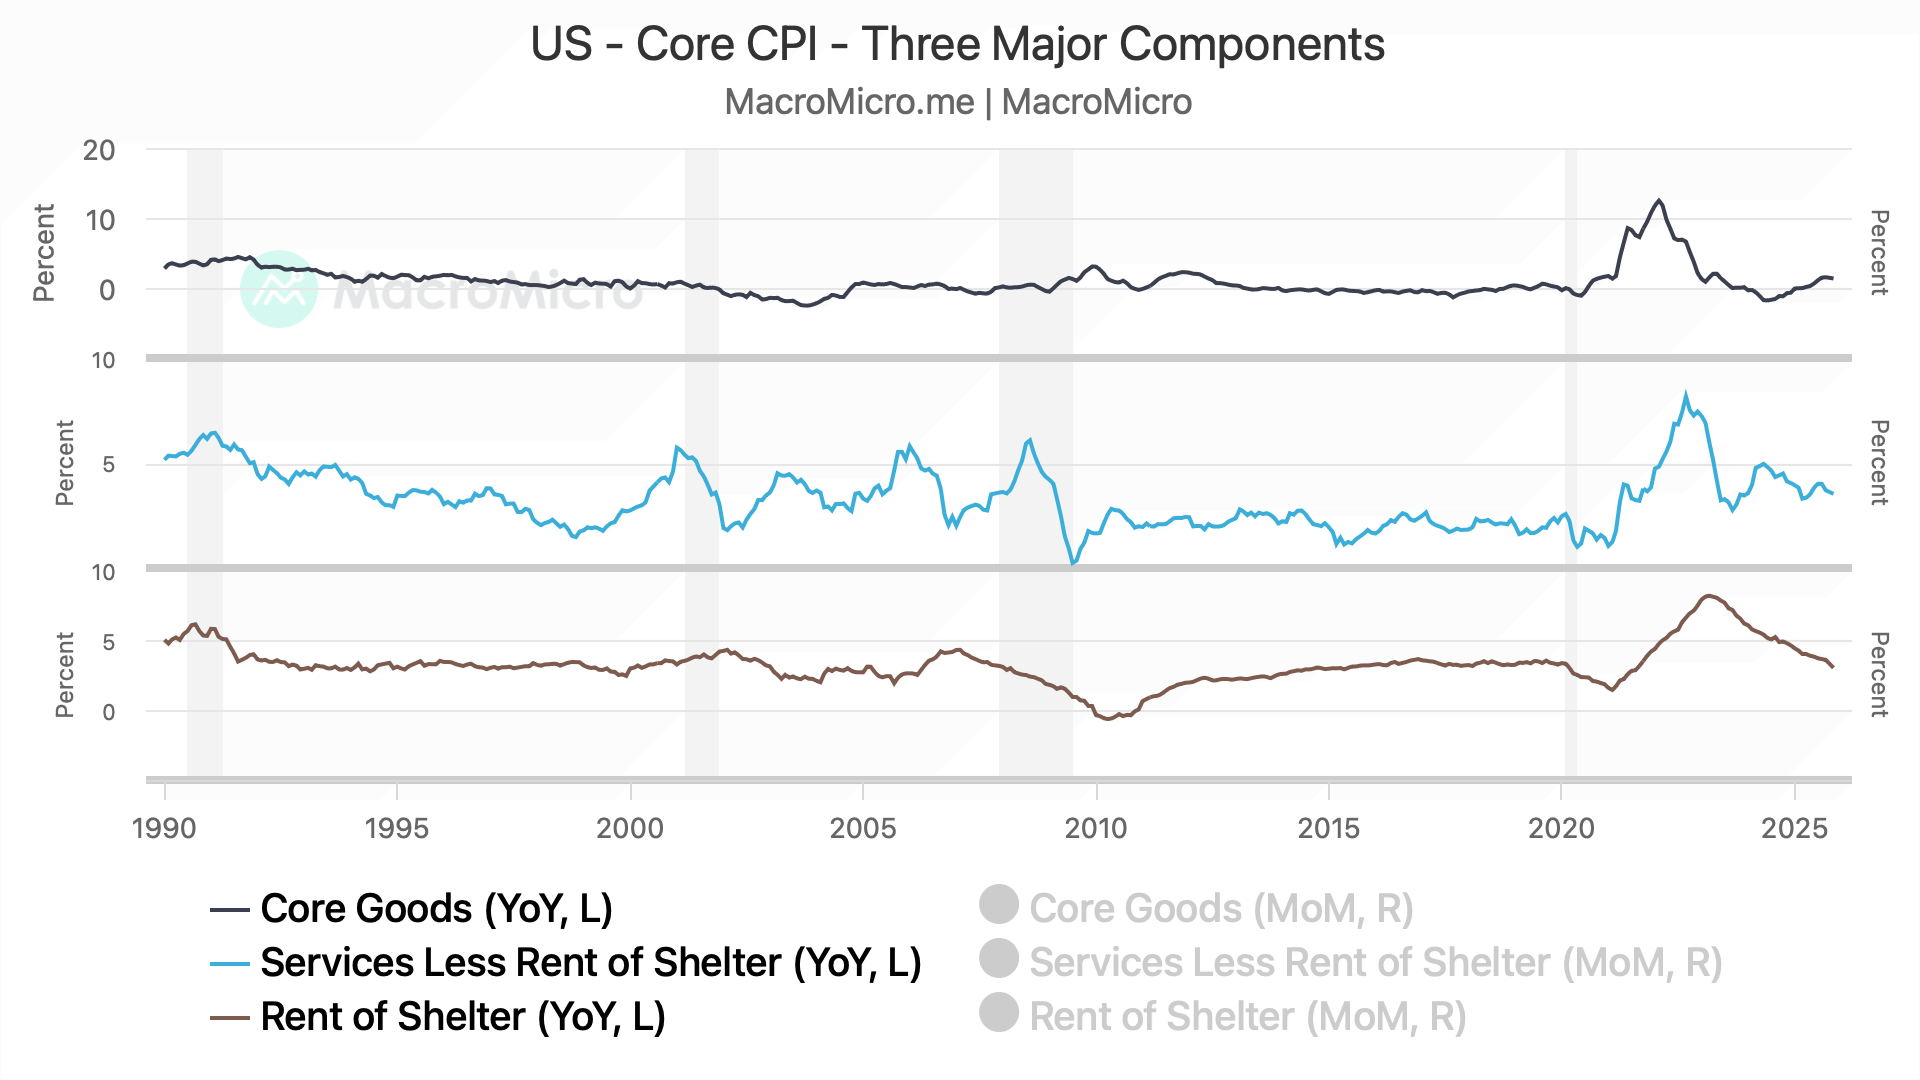
When we look at the three components of the Core CPI: Core Goods, Shelter, Supercore (Services Less Shelter), we can examine that Shelter has been in a strong downtrend, whereas the Supercore has been sticky (was 2.7% YoY).
The Goods Inflation has been on the rise (but stable) due to the tariffs-induced inflation.
Retail sales slightly missed expectations with a print of 3.5% YoY /. 0% MoM v/s expected +0.1% MoM.
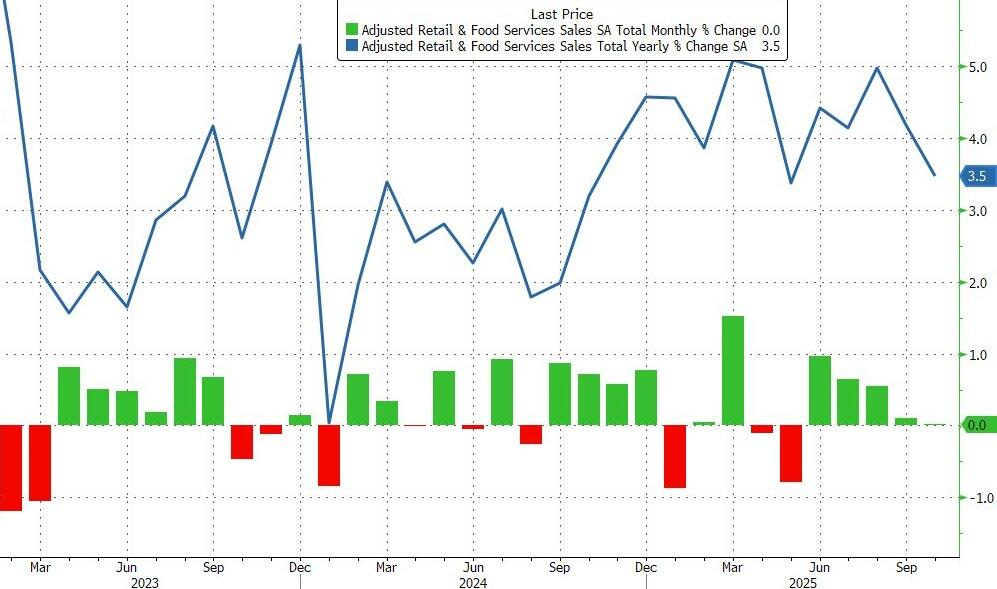
However, as usual, the devil lies in the details.
The Retail Sales Control Group (which excludes food services, auto dealers, building materials stores and gasoline stations) surged 0.8% MoM - double expectations and the biggest MoM jump since June.
It was led by online sales/non-store retailers as consumers went all in on discounted products, further strengthening our thesis of a K-shaped economy.
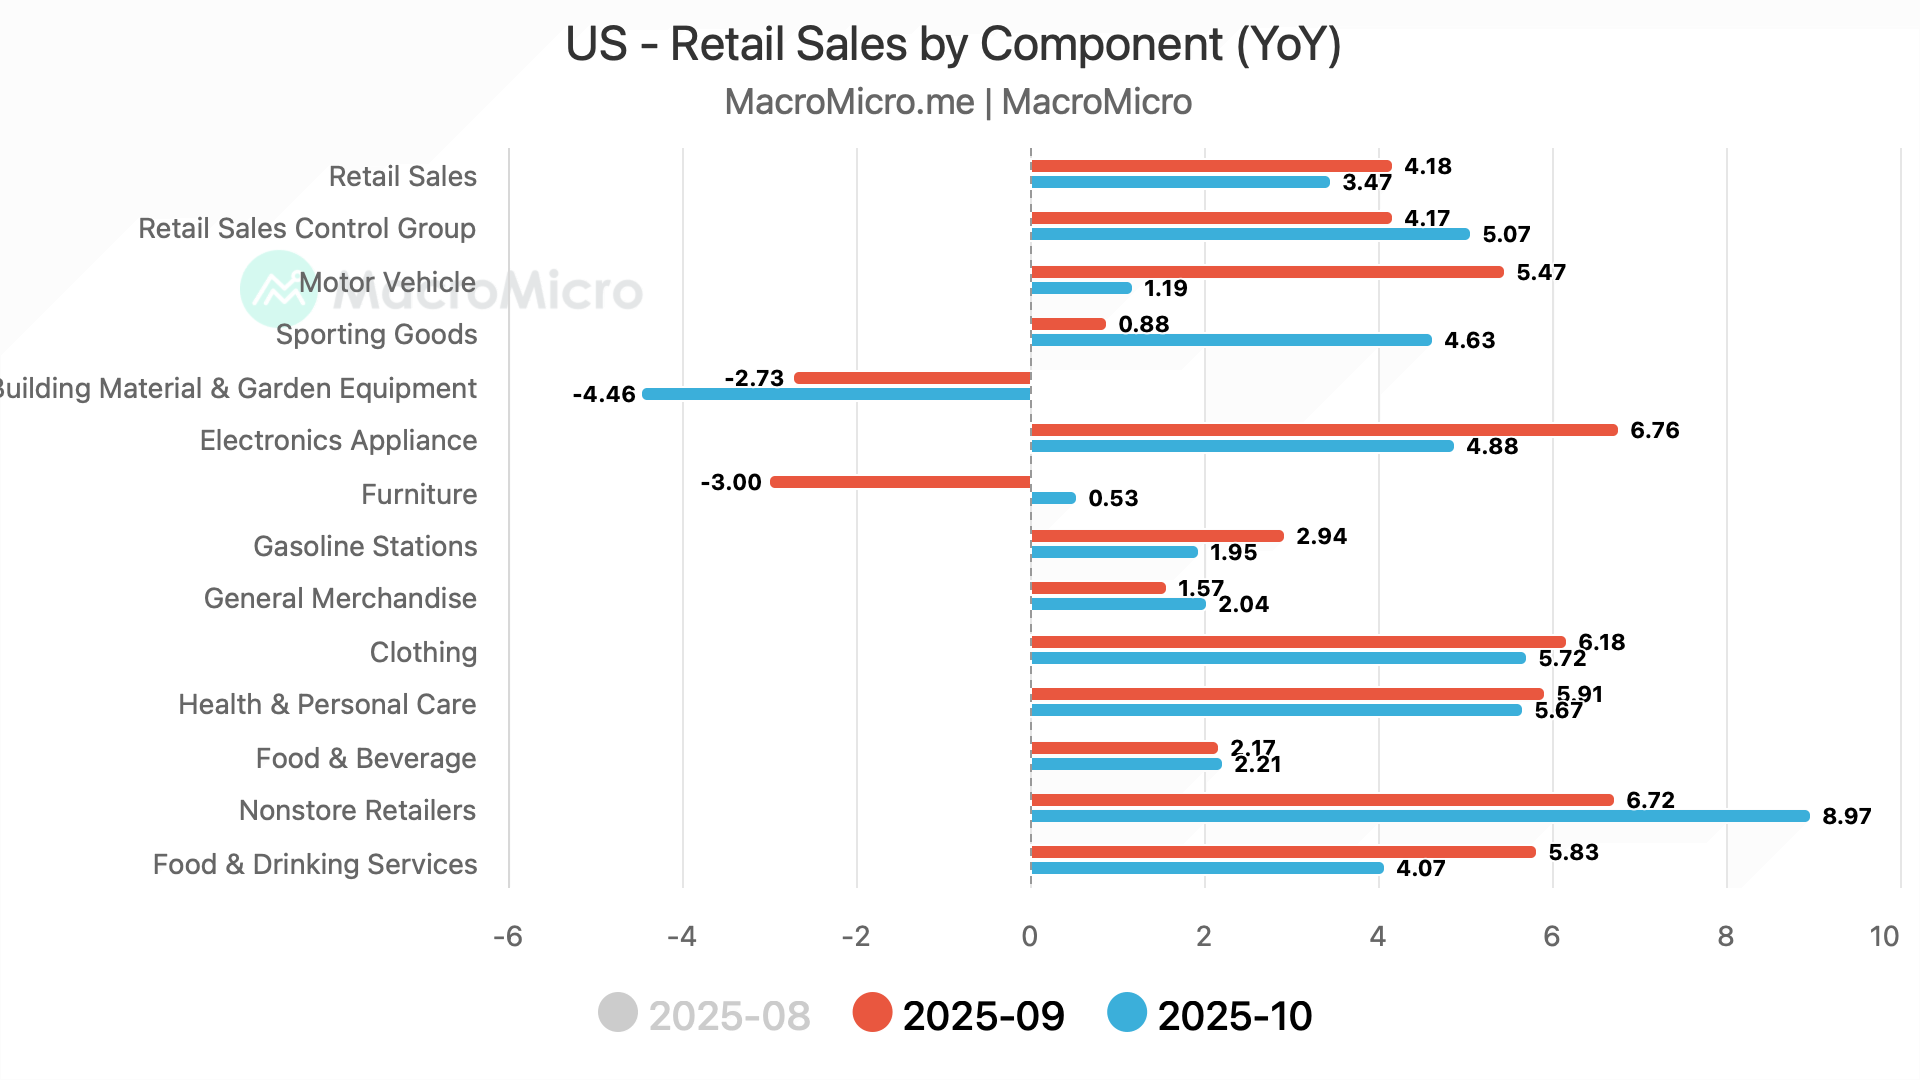
Nevertheless, building materials continue to decline, and furniture saw muted growth as the housing recession takes a toll on housing-related sales.
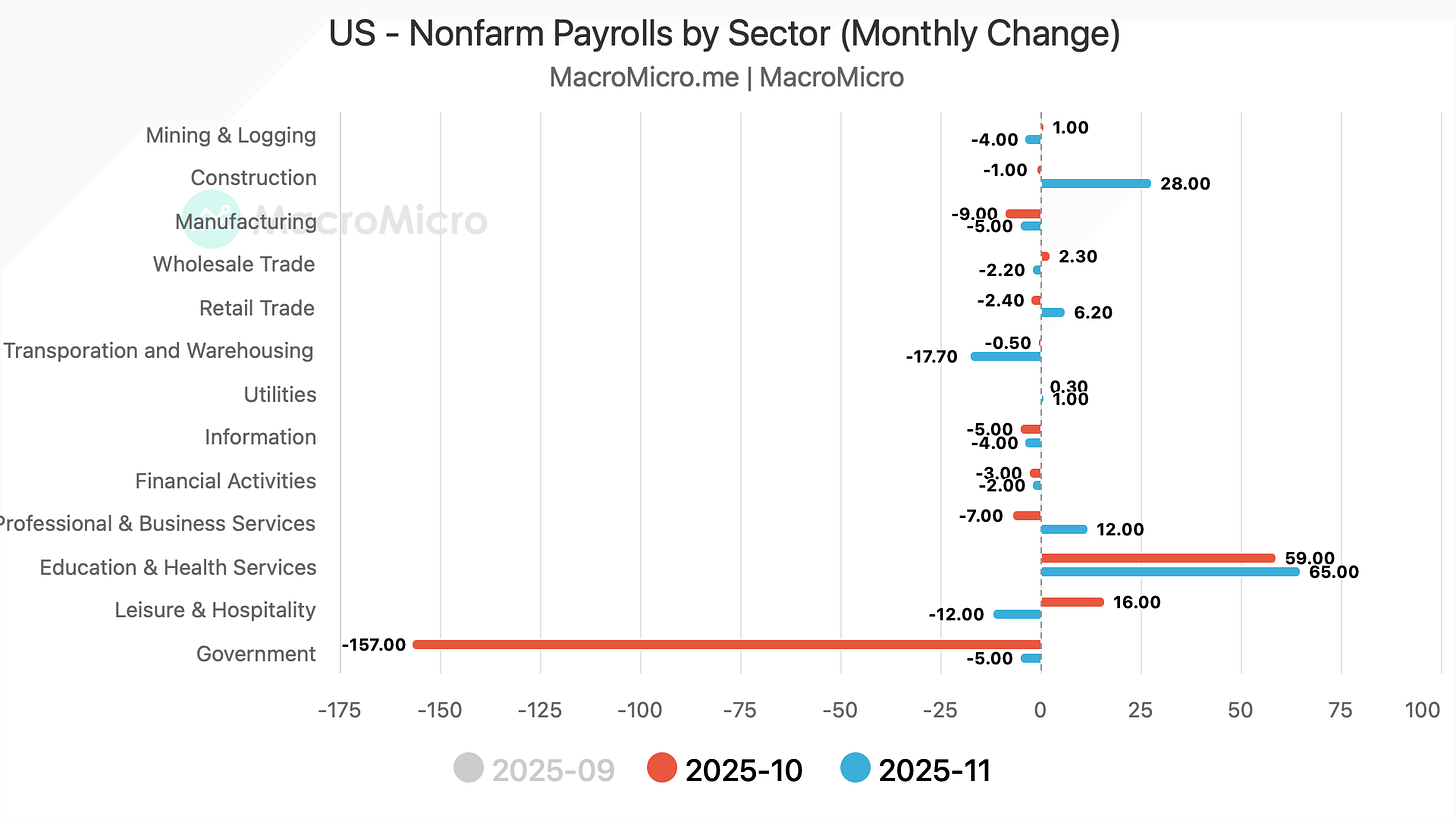
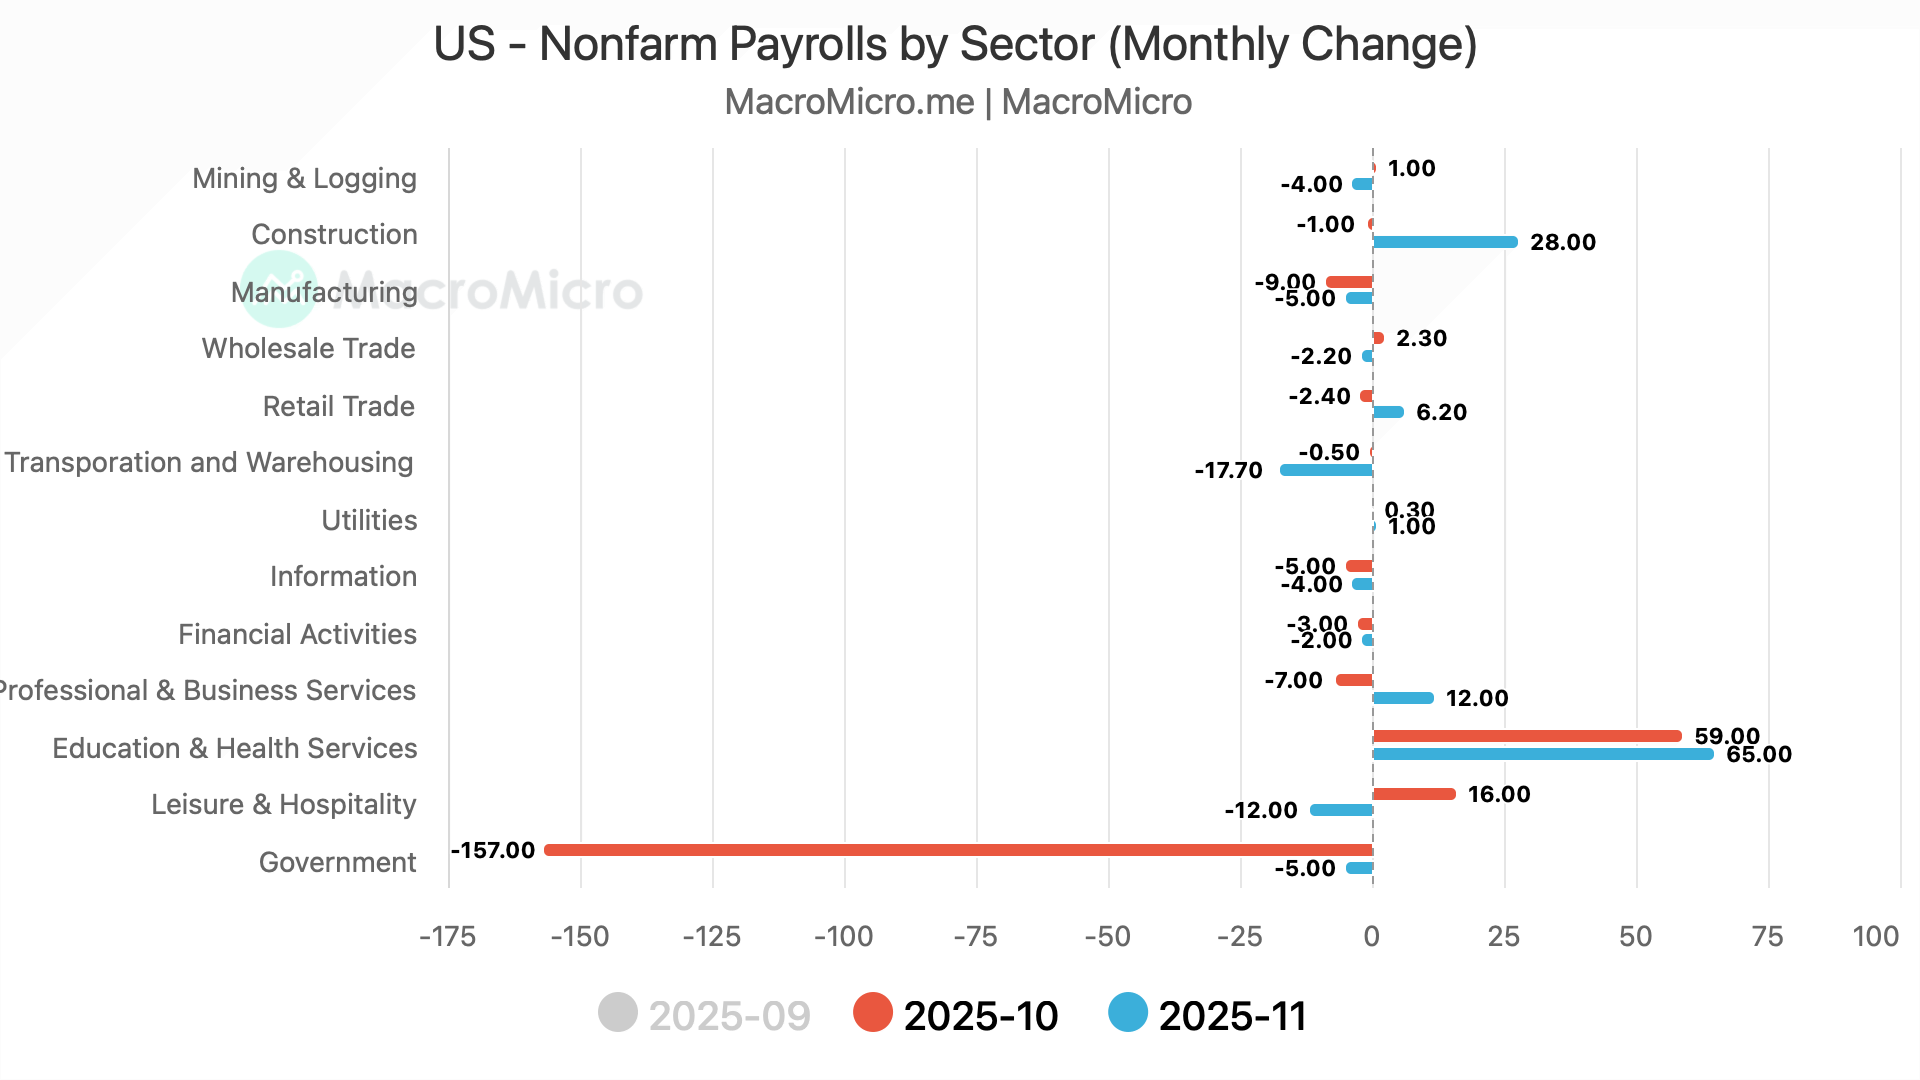
Let’s move on to the labour markets, where we present the most comprehensive chart pack with seven charts analysing the NFP:
The biggest job destroyer was the government sector. Note that these are not temporary furloughs but are permanent job losses since these federal employees filed for retirement early in January but remained officially employed until September. The majority of the job gains were once again in the non-cyclical sectors of Education & Health Service. The cyclical sectors (ex- Construction) witnessed further job losses in November, led by Transportation and Warehousing.