

Since the launch of ChatGPT in October 2022, we have seen a dream run in equity markets, driven by a marvellous technological revolution.
AI-related names across the board have generated generational wealth and continue to do so in pockets where earnings have been supportive.
We firmly believe in the power of AI and recognise that our world is evolving rapidly. Just as the internet did in 2000, AI will forever transform our lives.
Nonetheless, we believe the way AI rollout has been financed has reached questionable levels.
The circle jerk has reached unprecedented levels, and with just $53 billion of equity, purchase commitments of more than $980 billion have been made.
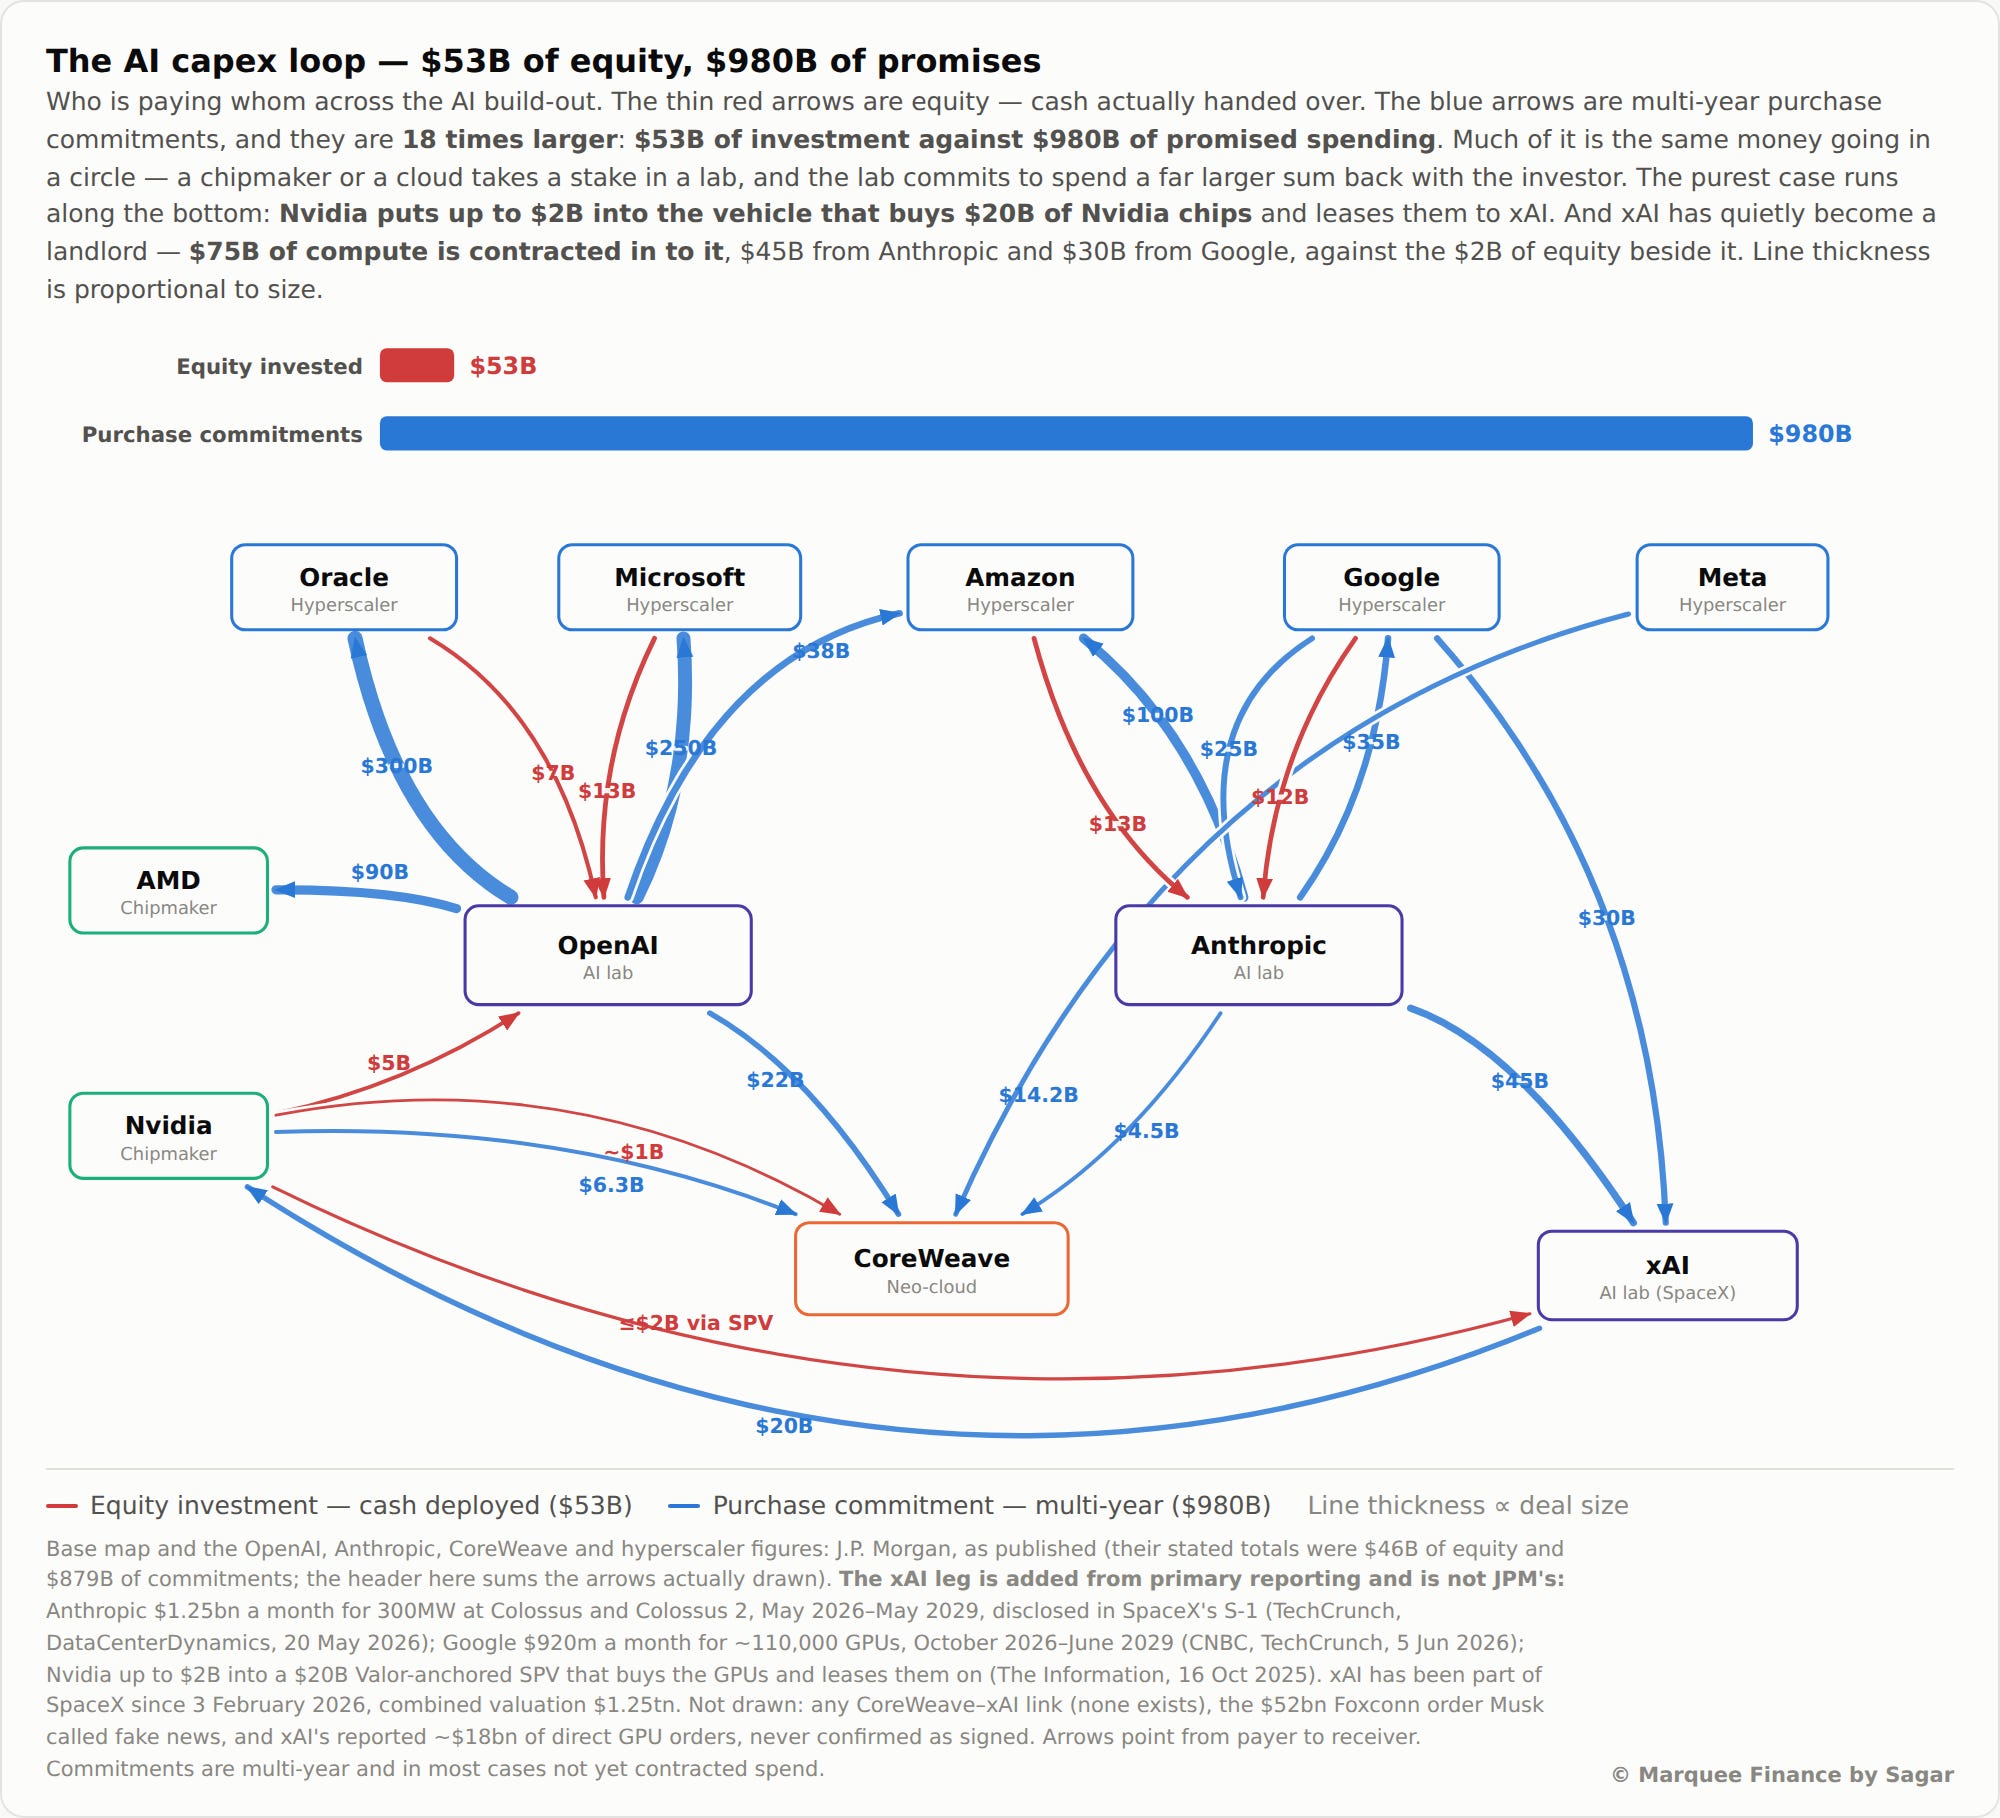
Furthermore, off-balance-sheet borrowings have ballooned, with “trillions” of debt now sitting in obscure SPVs across hyperscalers. As a result, corporate bond markets have also begun revolting.
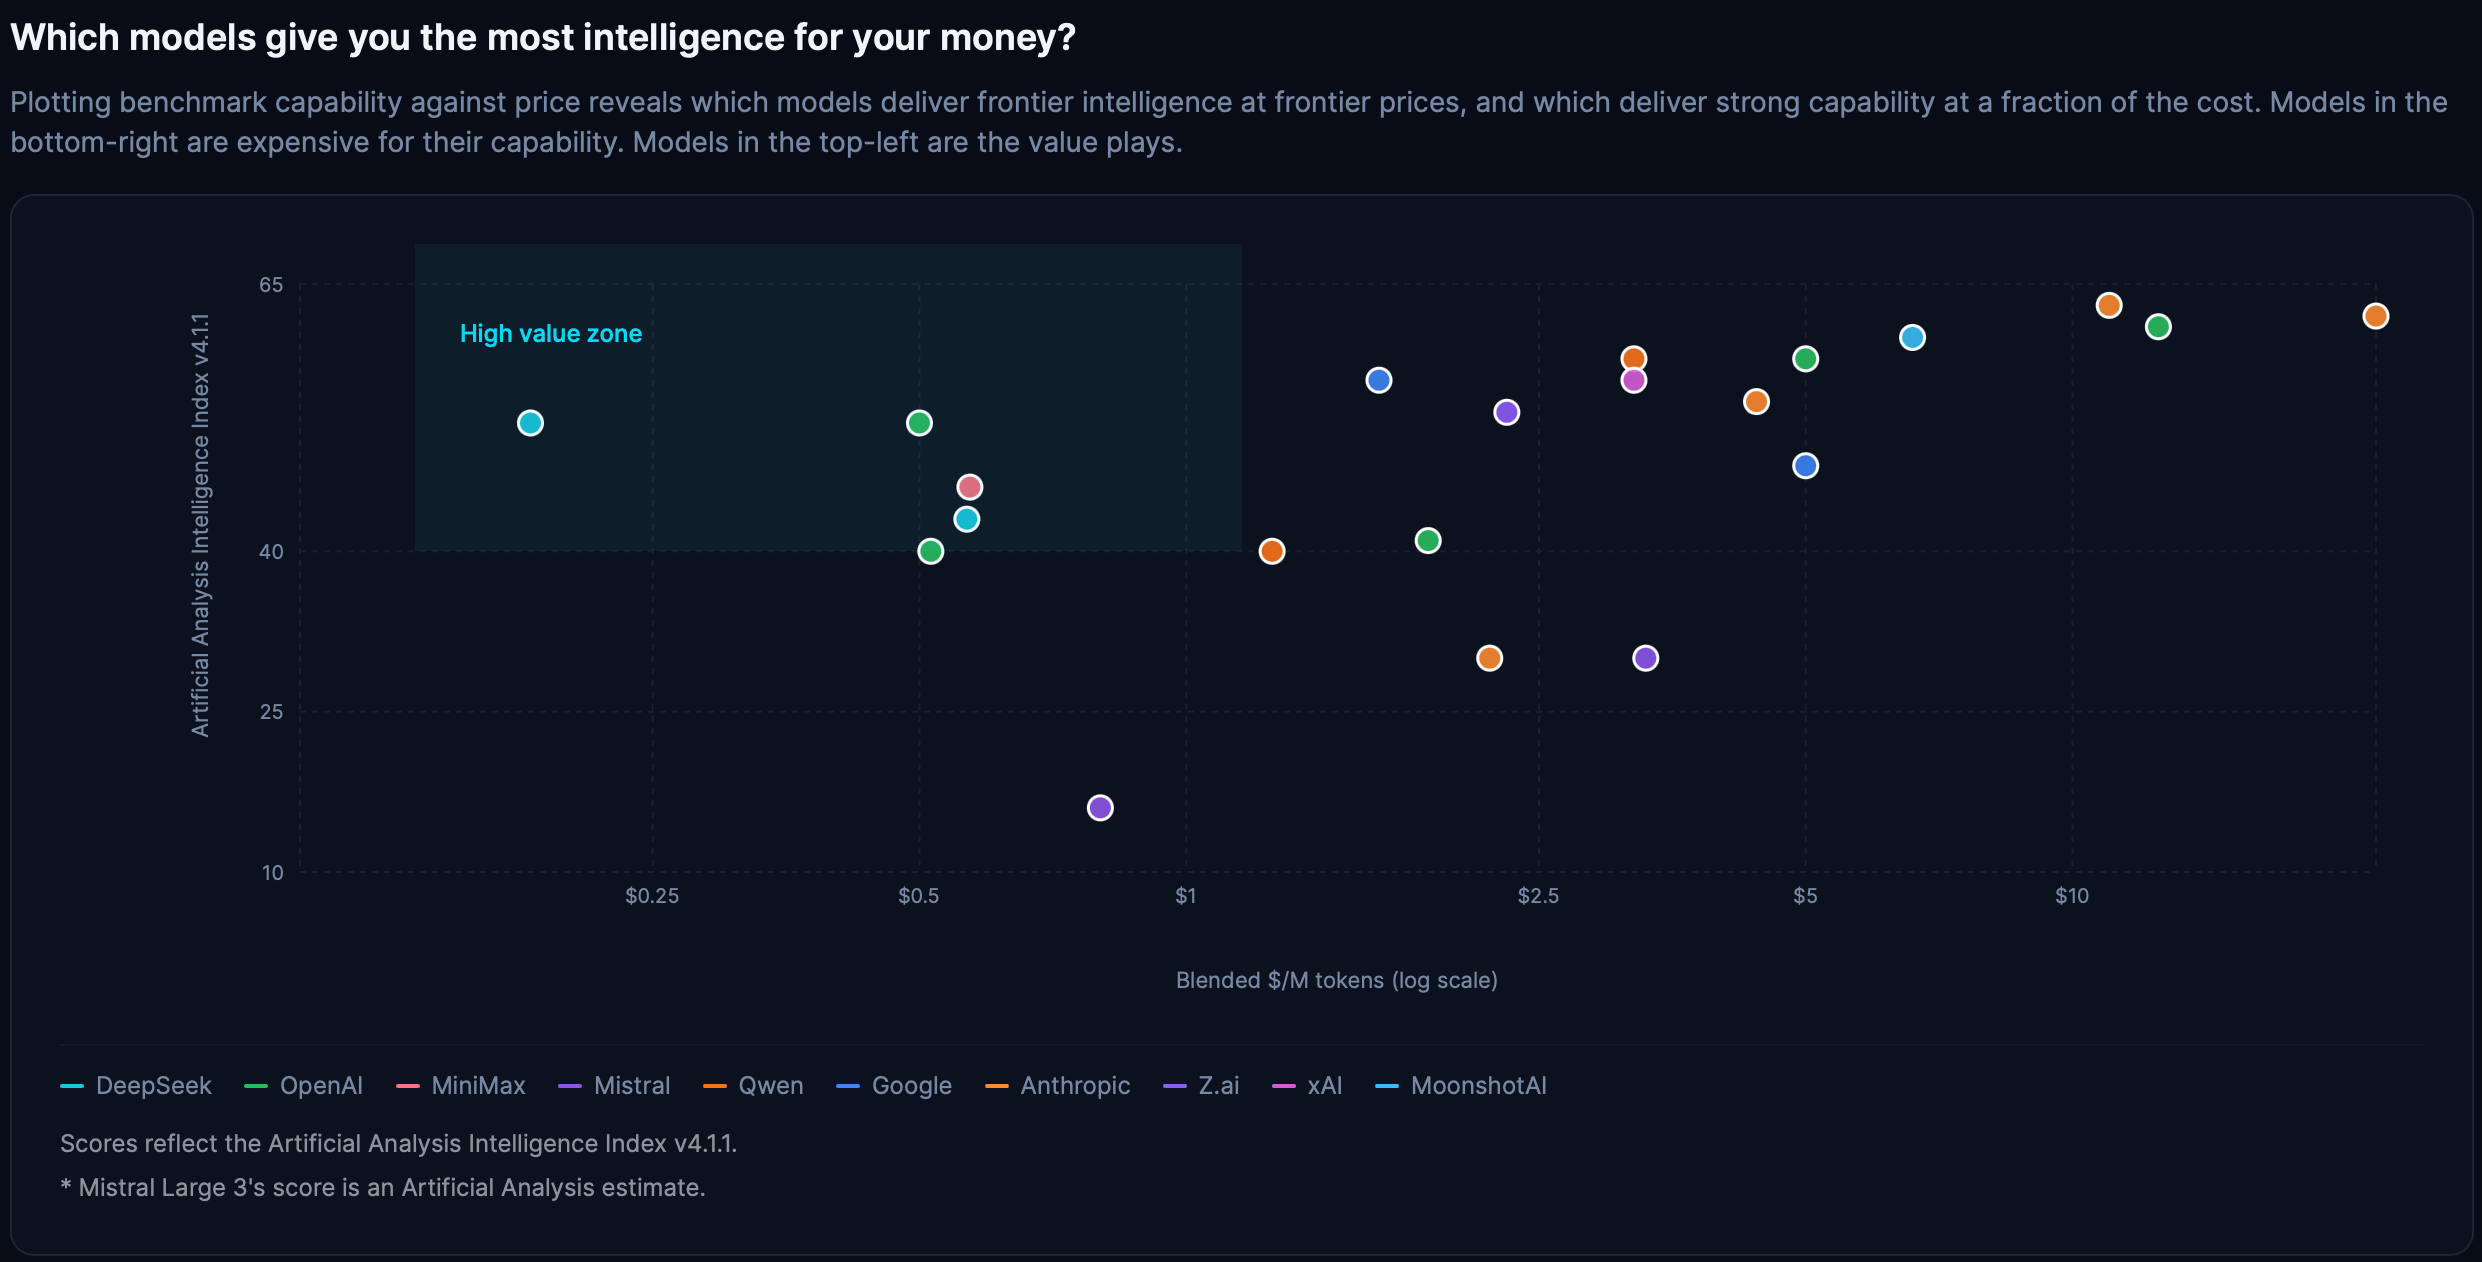
We have been portraying for weeks now how the rise of Chinese open-source models will lead to a price war, and closed models will have a tough time competing.
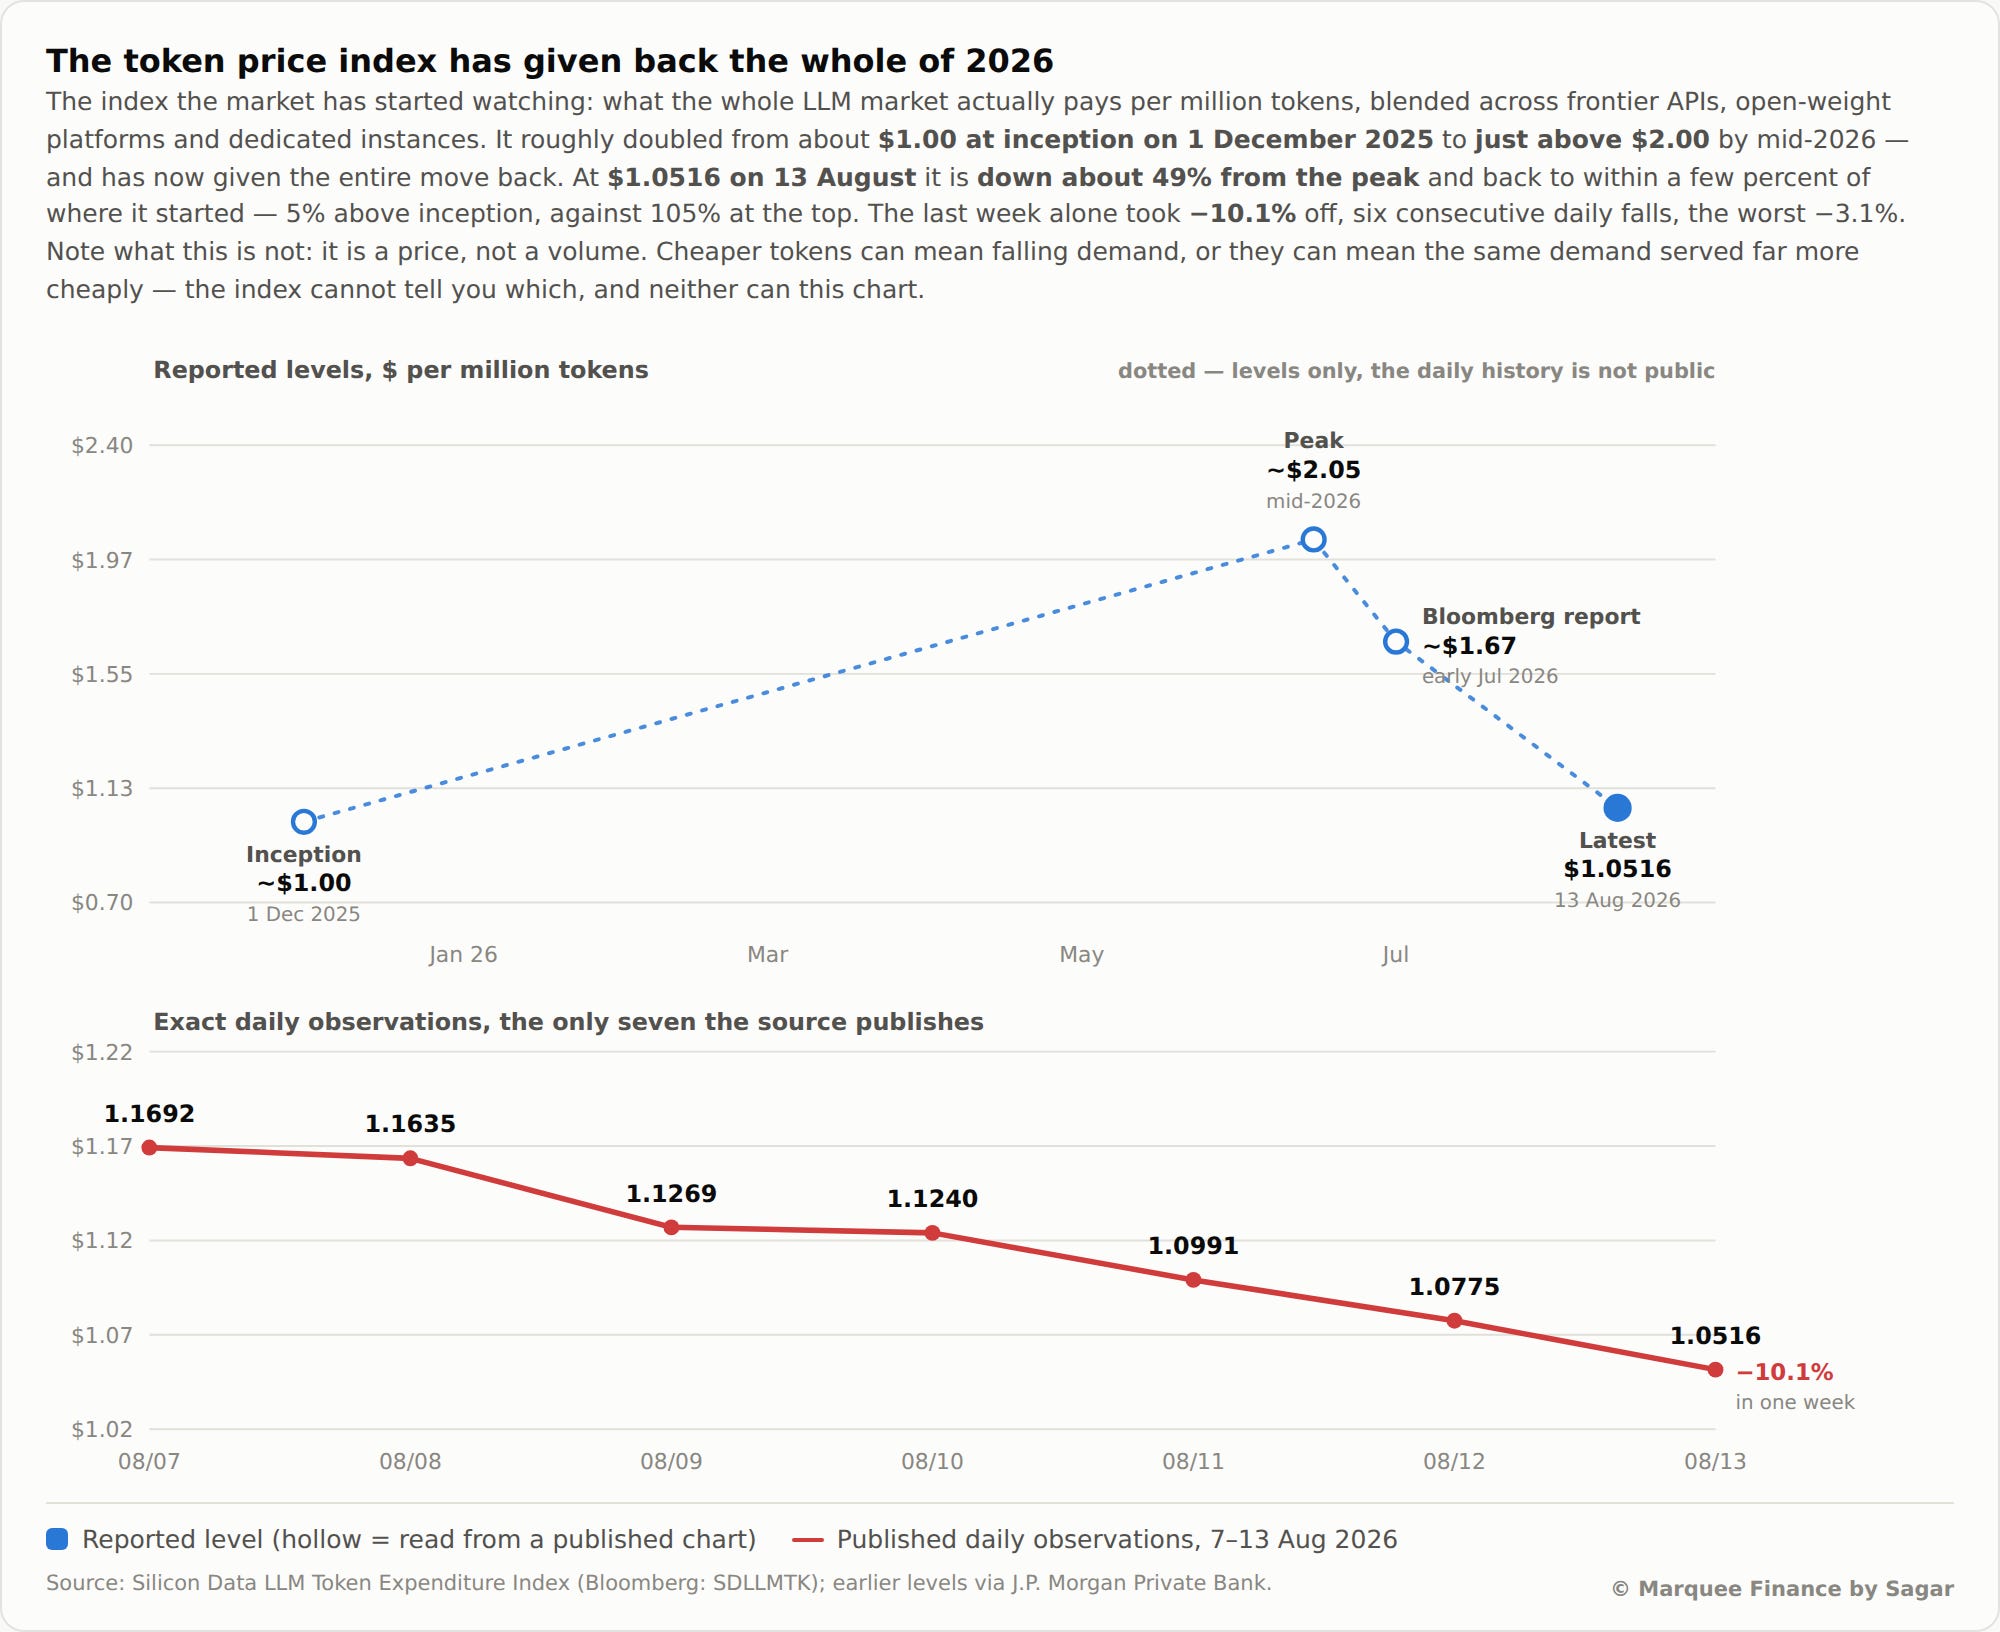
The Silicon Data LLM Token Expenditure Index is now down a whopping 49% from the peak and has given up all the gains since the launch of Agentic AI.
Despite the recent price rise by Deepseek, it still offers the best value for money, as visible in the chart below.
We believe that as we approach the IPO’s of Anthropic and OpenAI, the time has come for investors to reassess their portfolios and the AI trade, especially the entities involved in circular financing.
We will discuss more later on.
Barring March, when we saw a 3.93% drawdown, all other months have generated positive returns this year.
We are up 7.48% YTD. Our high cash exposure, along with our China and India exposure, has weighed on returns (roughly 300 bps).

We remain confident in medium-term outperformance.
PS: We are announcing a price increase for our subscription plans, driven by significant new features and upcoming updates. Starting next 24 hours, the monthly plan will increase from $ 29.99 to $ 39.99, and the annual plan will increase from $ 299.99 to $ 399.
Existing subscribers will “NOT” see any changes and will remain on their current plans.
We have introduced the following features in the past few weeks:
US Macro Dashboard.
China and Japan Macro Dashboard.
Cross-Asset Volatility Monitor.
Custom Equity Greed and Fear Index.
Stay tuned as we have much more in the pipeline.
Let us take a deep dive into the macro universe and analyse cross-asset markets!
US/ Equities/ Bonds/ Dollar/ Oil/Gold!
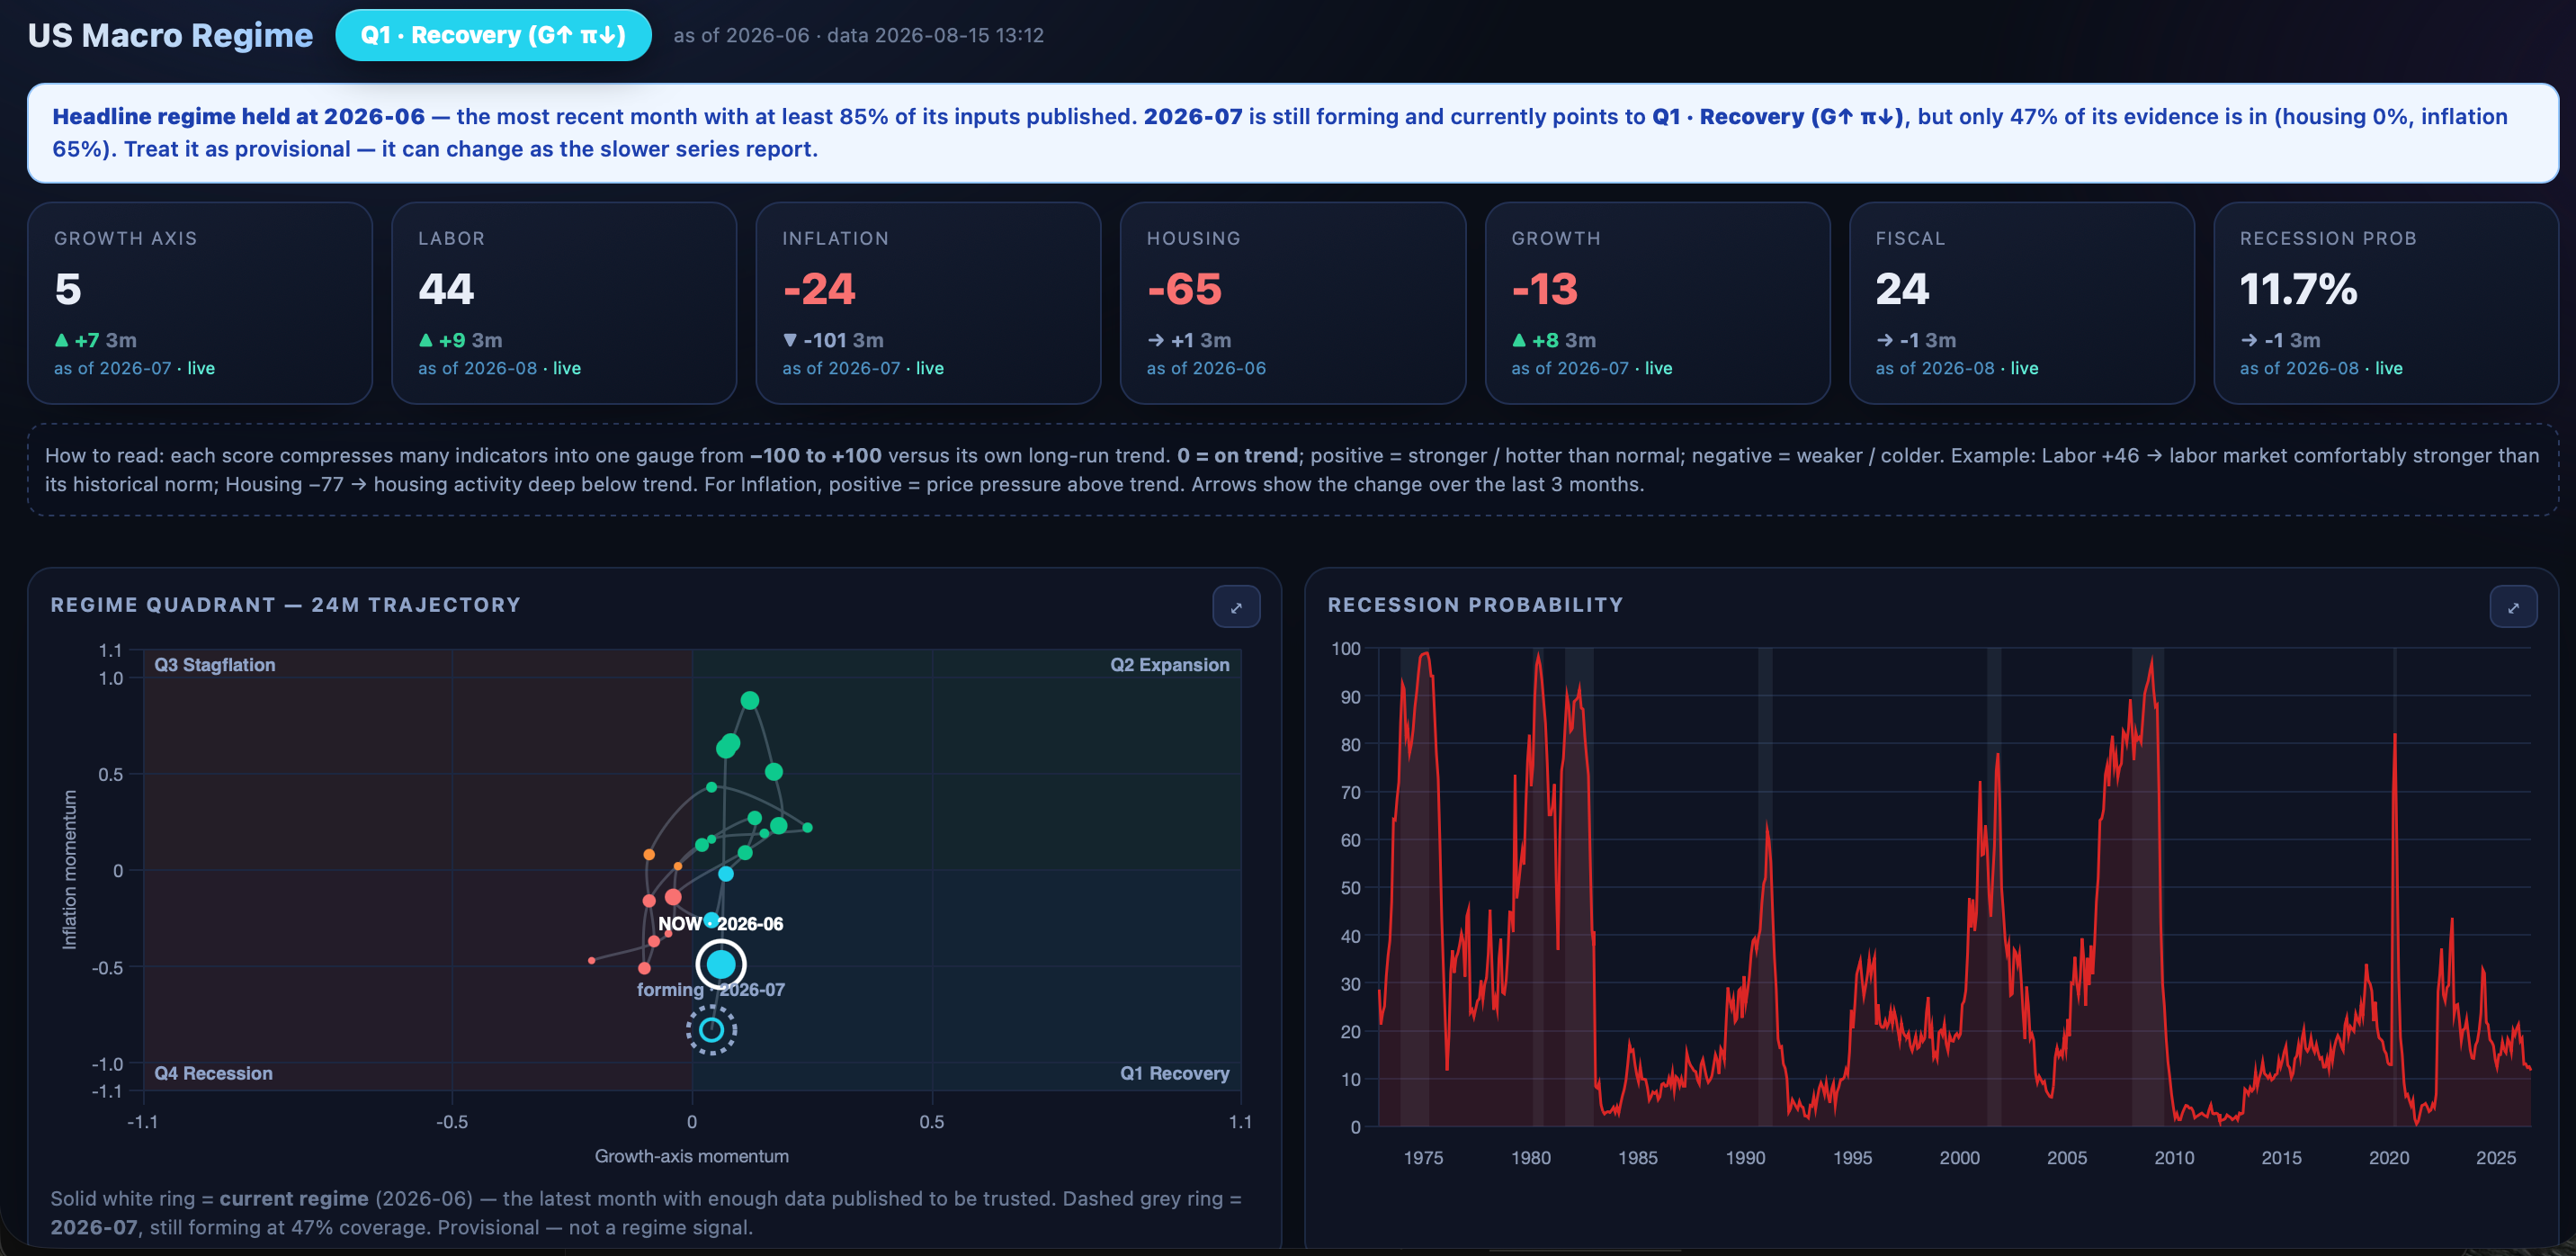
US Macro Dashboard is available for the last 24 hours for all subscribers at: https://dashboard.marqueefinancebysagar.com
From tomorrow, it will be available only to paid subscribers, published every Saturday.
This week was data-heavy, with CPI/PPI/Retail Sales and NFIB releases.
Headline and Core CPI came bang in line with estimates at 0.1% MoM and 0.2% MoM, respectively.
The 3M annualised rates have collapsed, with the headline printing at just 0.5%, thanks to a plunge in energy prices (which may not last, given the situation).
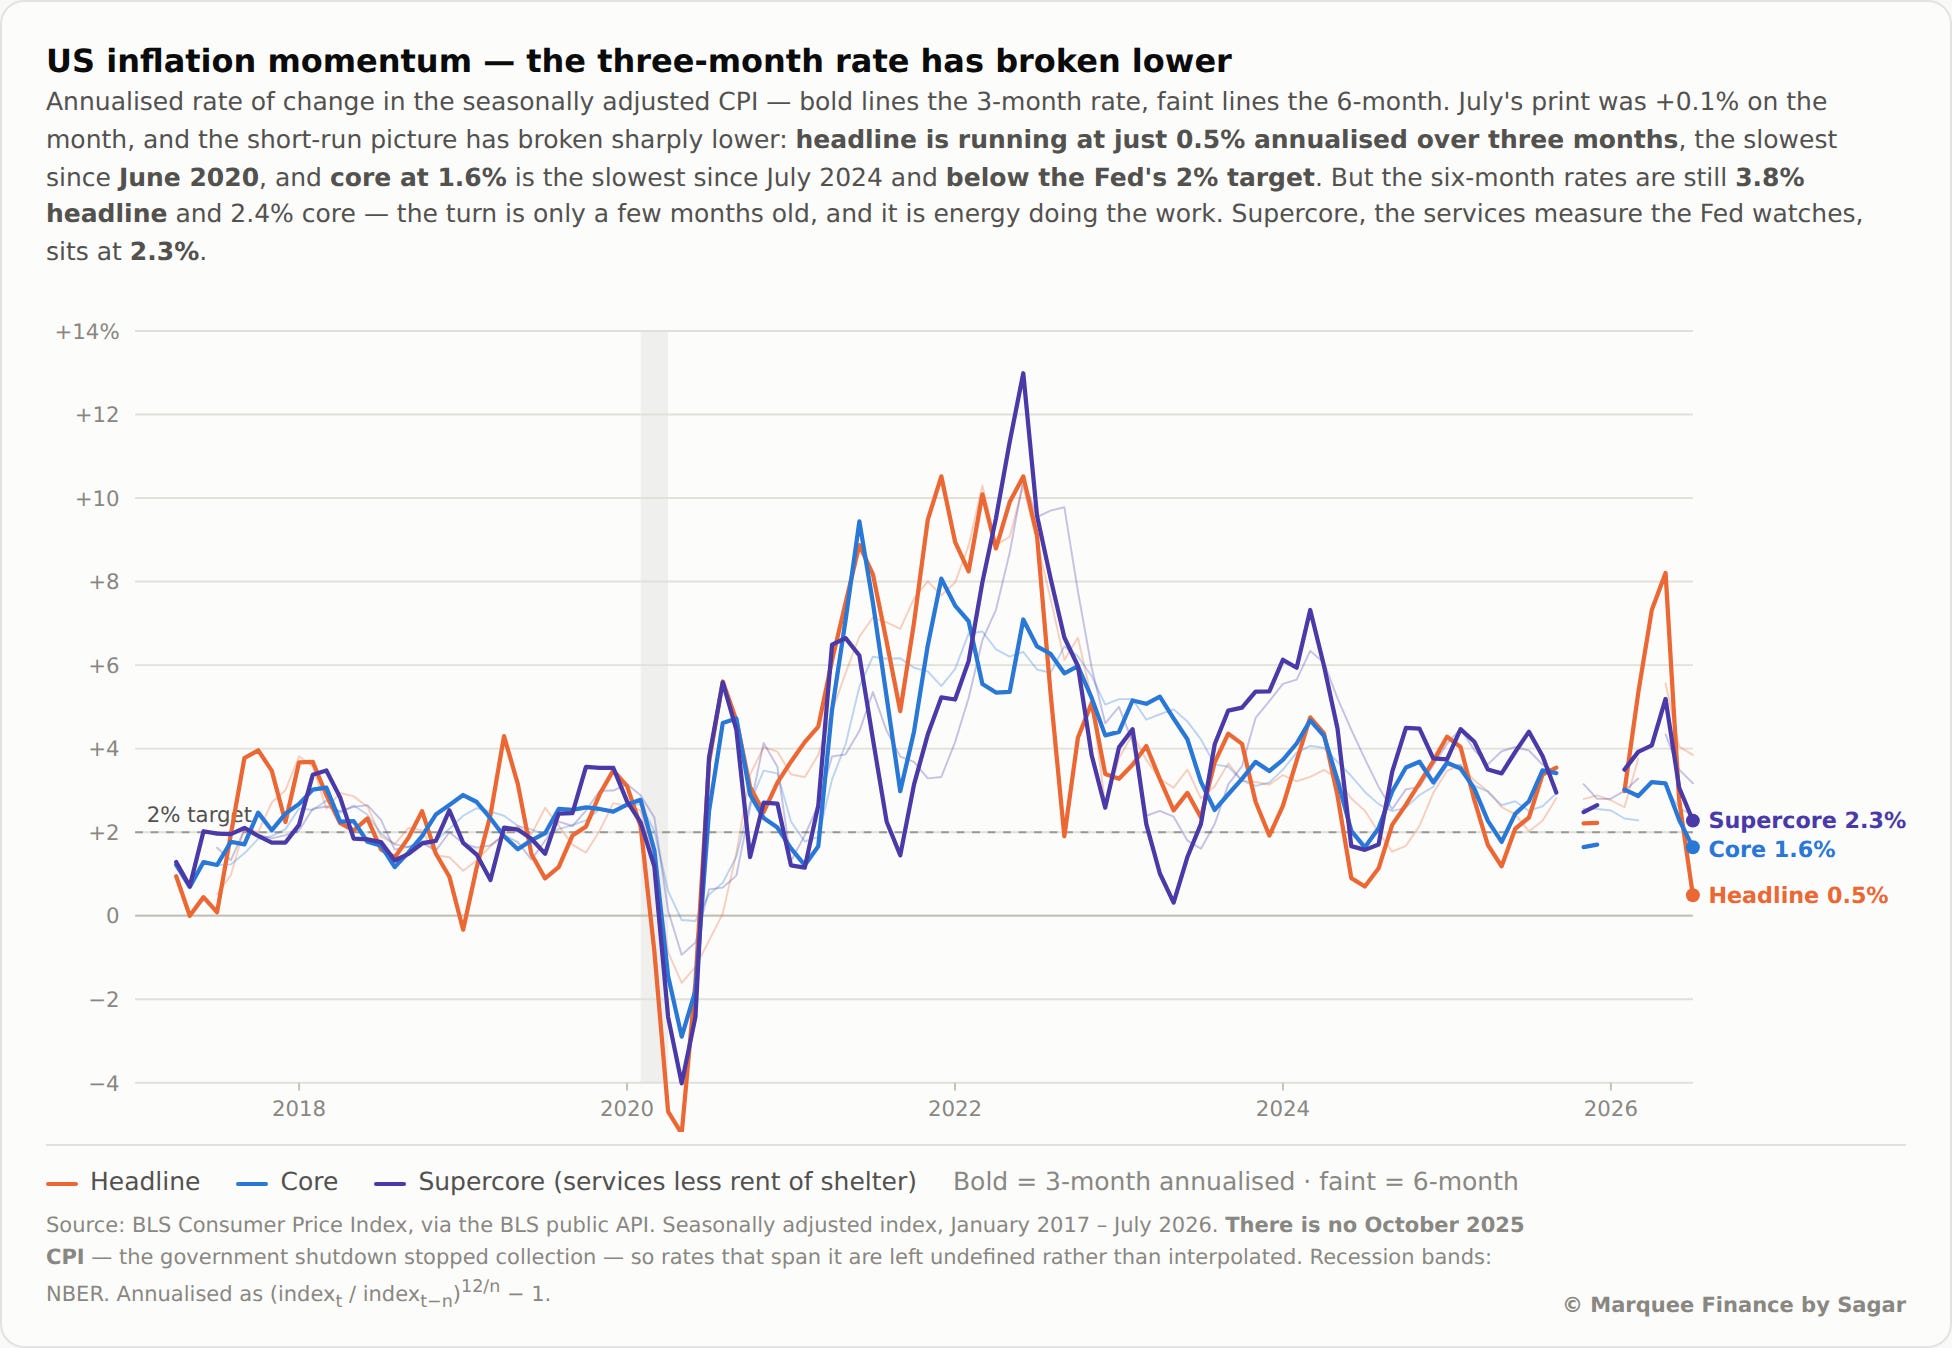
Although 3M Supercore also moderated, the 6M annualised rates remain sticky, with the headline at 3.8% and the core at 2.4%.
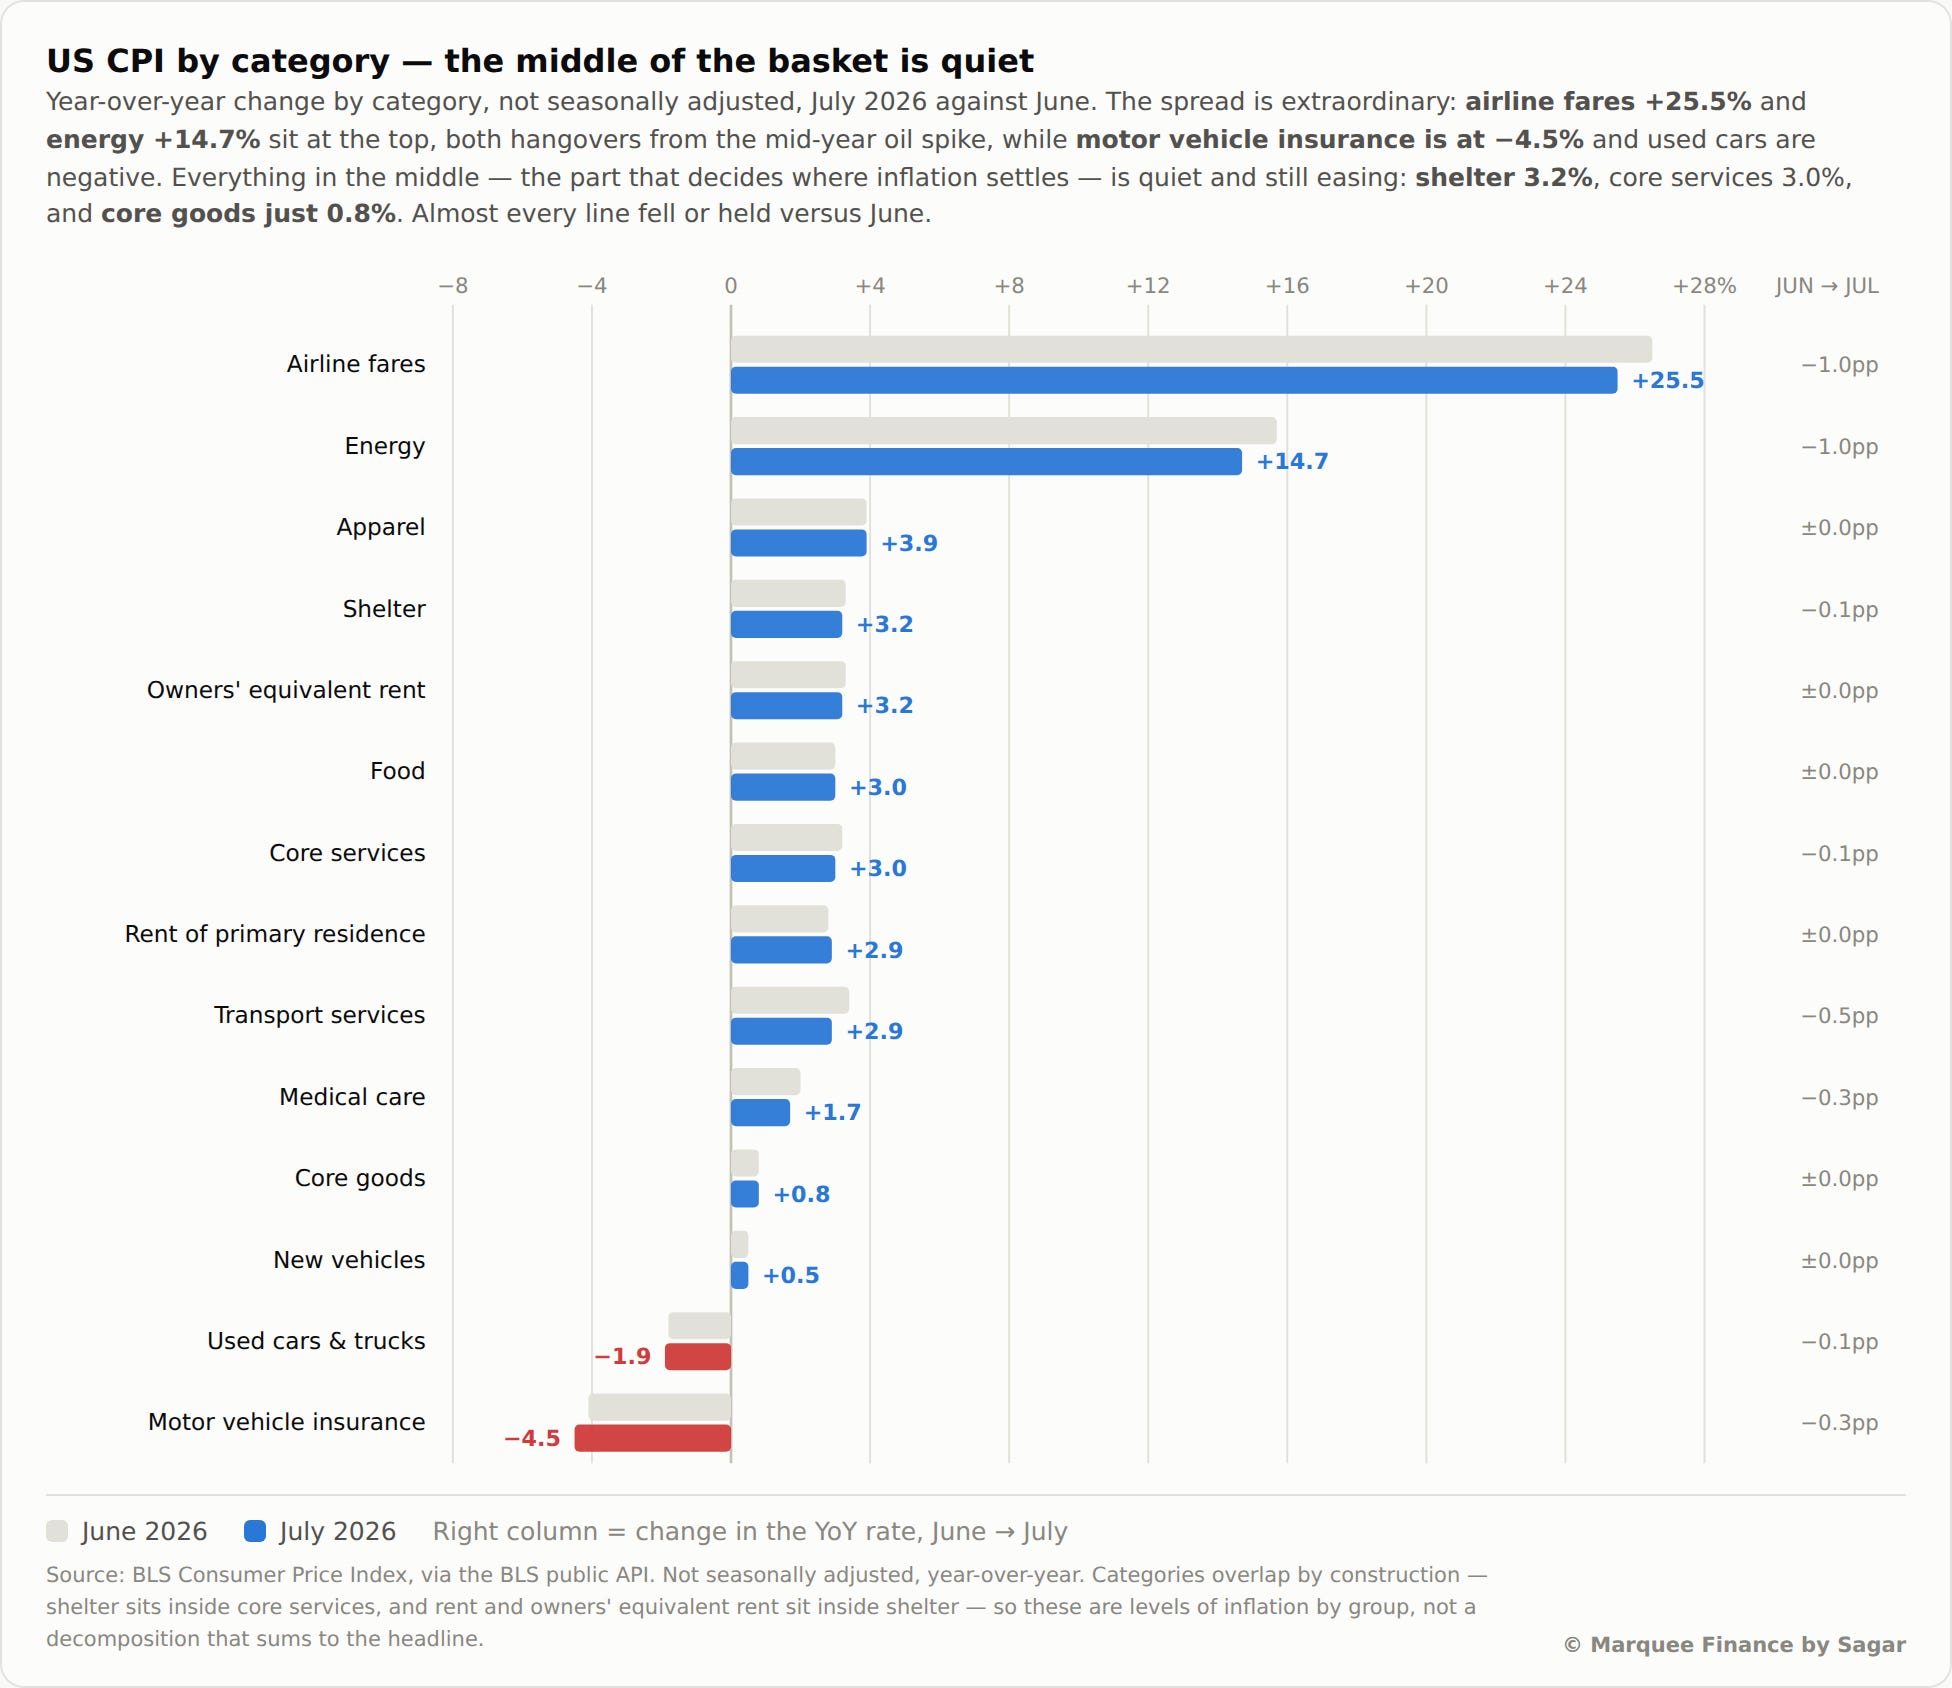
Looking at the YoY change in components, motor vehicle insurance and used cars were the negative surprises.
Shelter remains sticky at 3.2% with OER stubborn at 3% annualised growth after wild swings in the past few years.
There were two shockers of the week.
The first was PPI: headline PPI came in at 0% MoM, 20 bps below expectations. Core PPI was 0.2%, 10 bps below expectations.
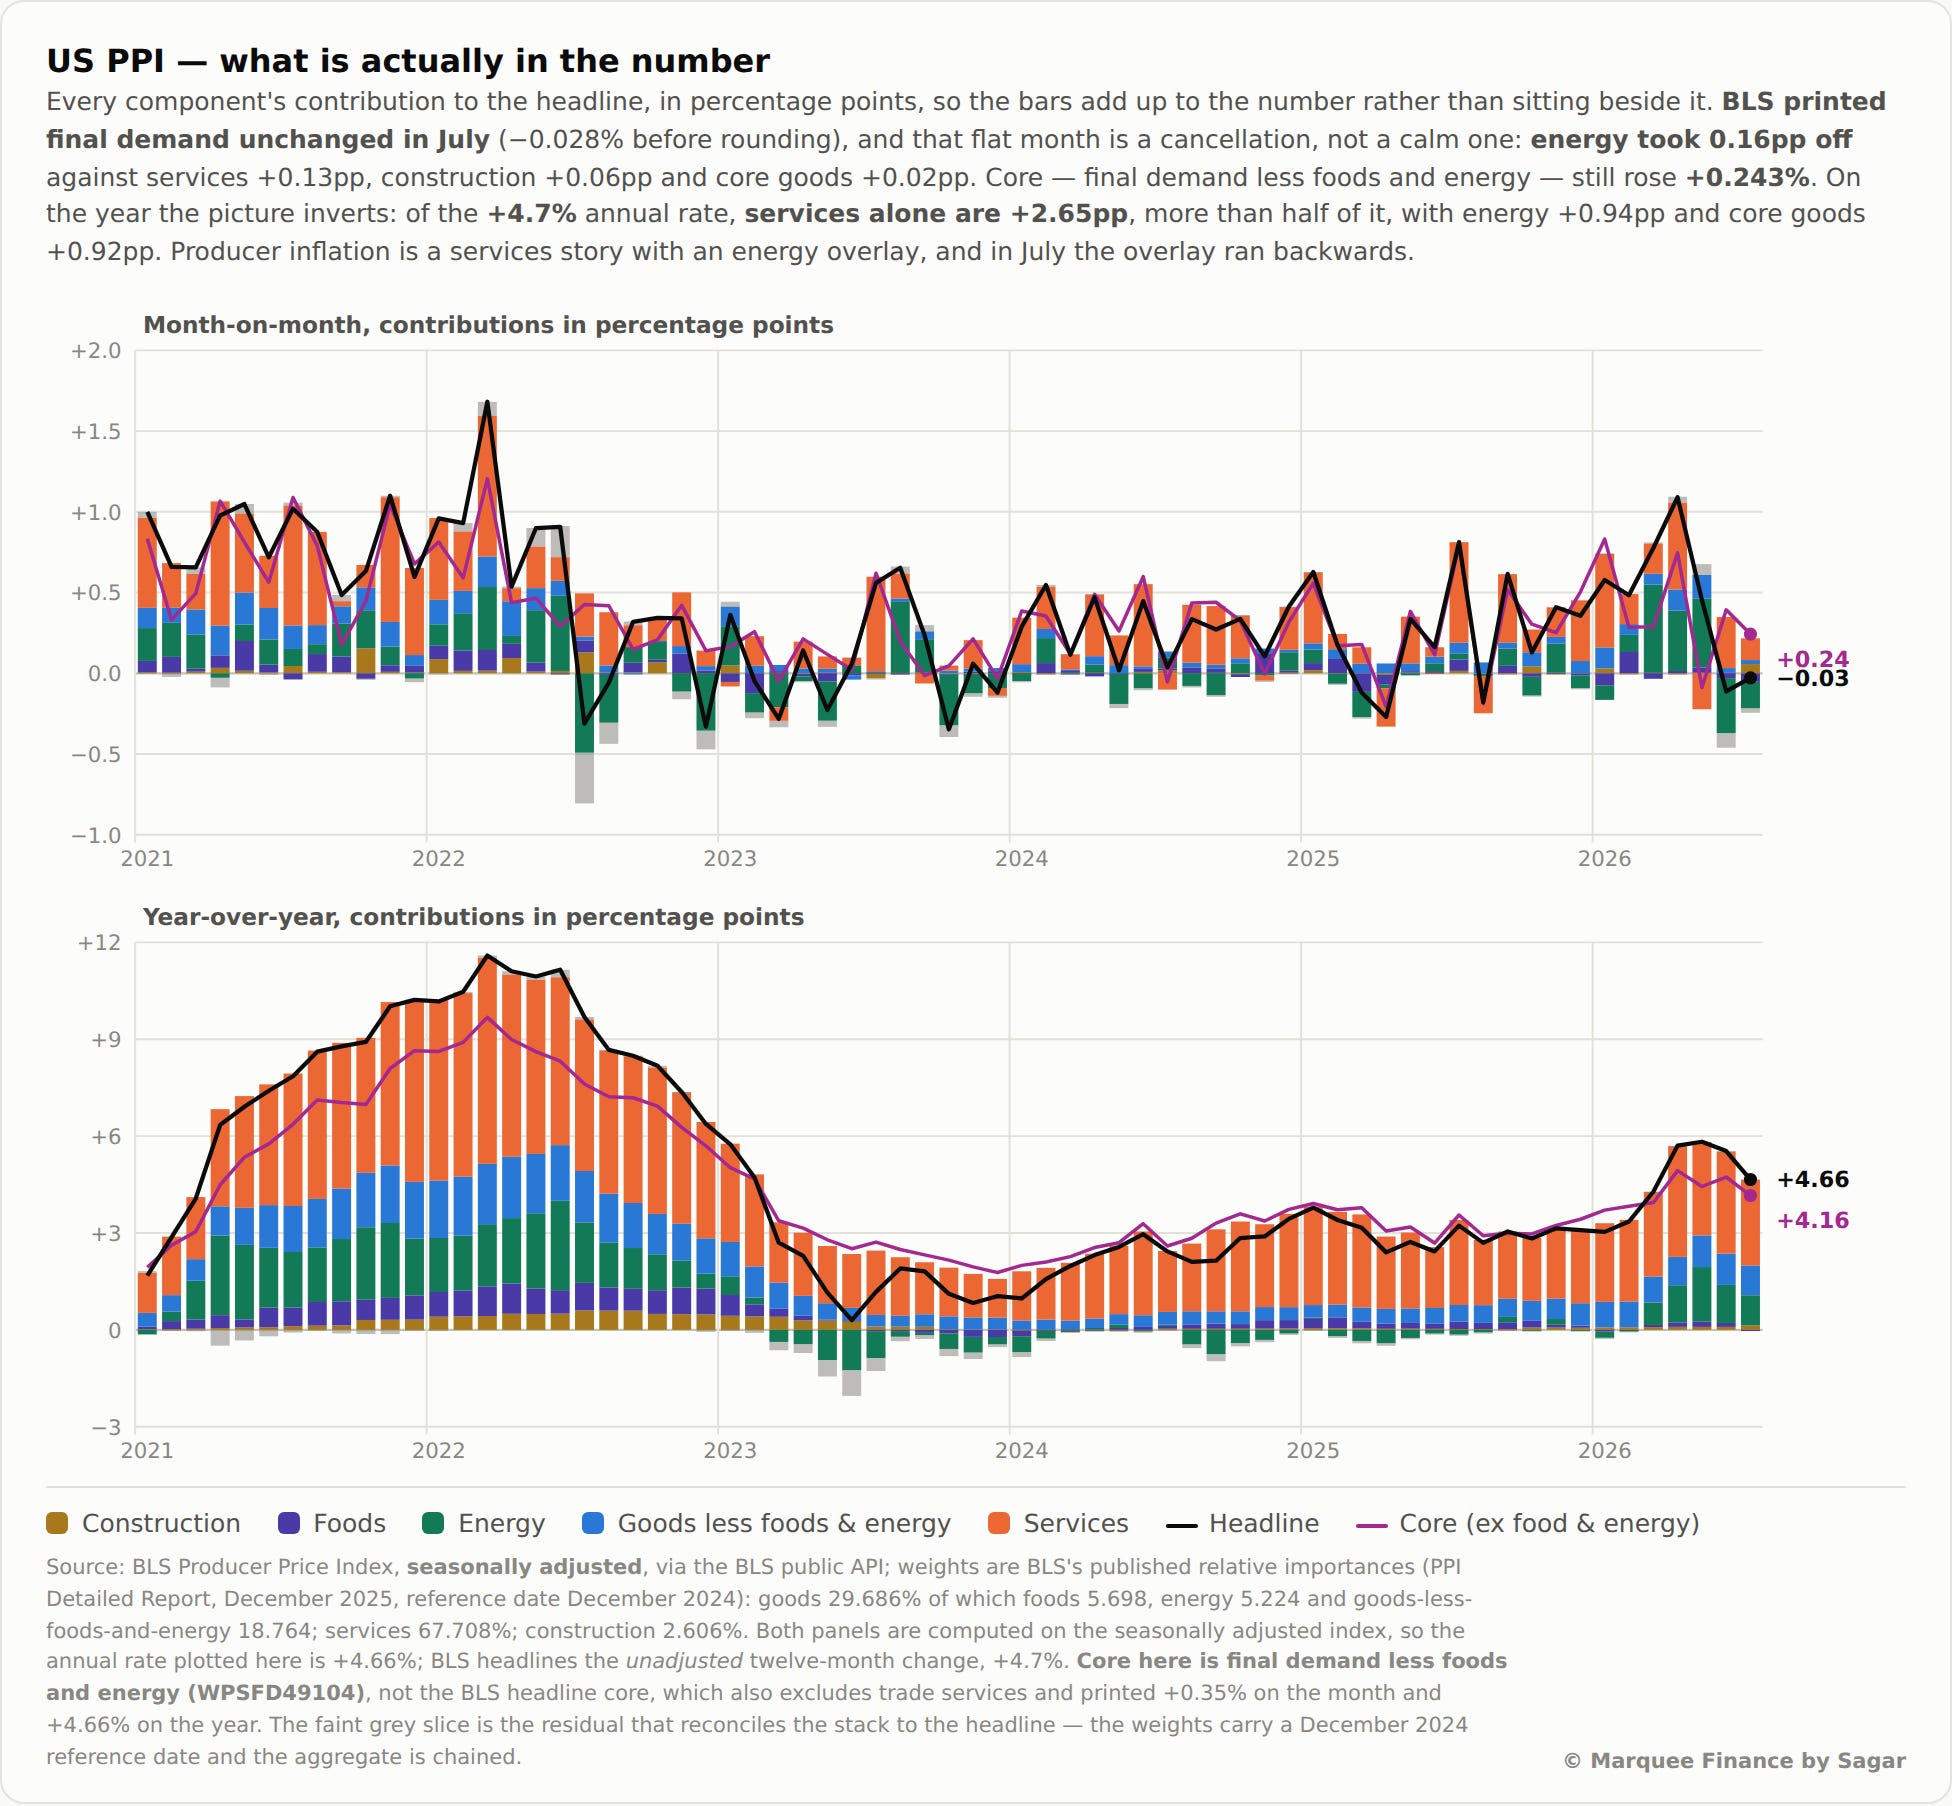
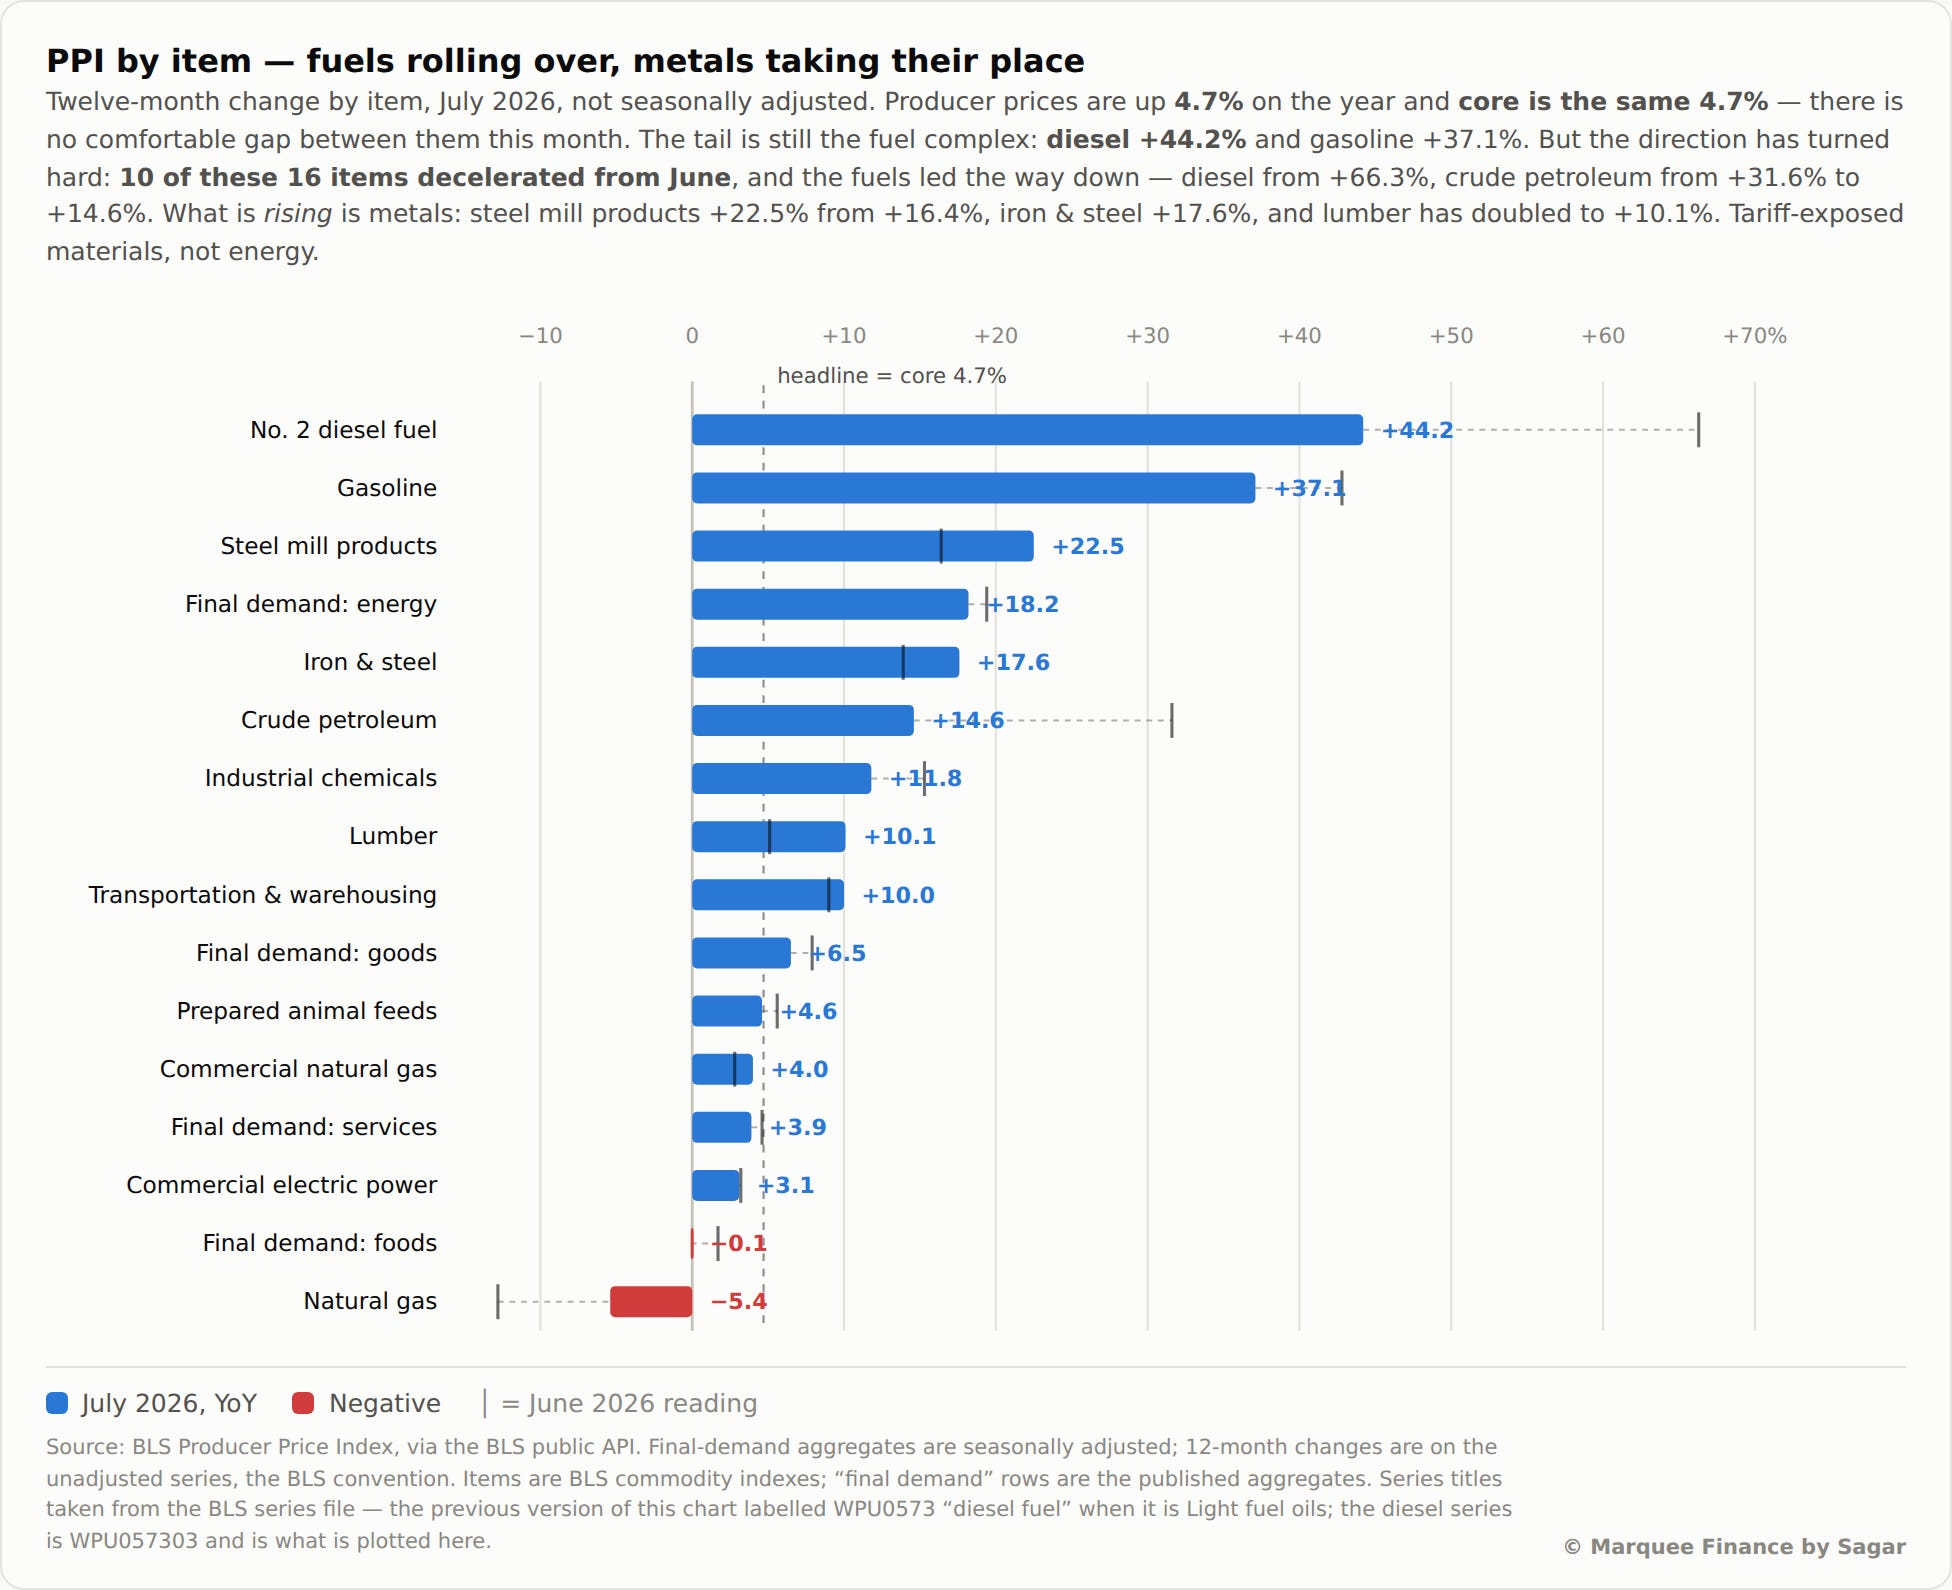
Same story as CPI: rolling-over fuel prices were the biggest downside contributors MoM.
Nevertheless, the YoY change is still running above 37% for both gasoline and diesel.
Retail Sales was the second biggest shocker of the week.
Headline Retail Sales came in at -0.6% MoM v/s exp of 0.1% MoM.
Retail Sales Ex-Auto came in at -0.35% MoM v/s exp of 0.2% MoM.
Retail Sales Control Group came in at 0.4% MoM v/s exp of 0.3% MoM.
Five of thirteen categories fell, and the two biggest were motor vehicles (-1.8%) and non-store (-2.2%).
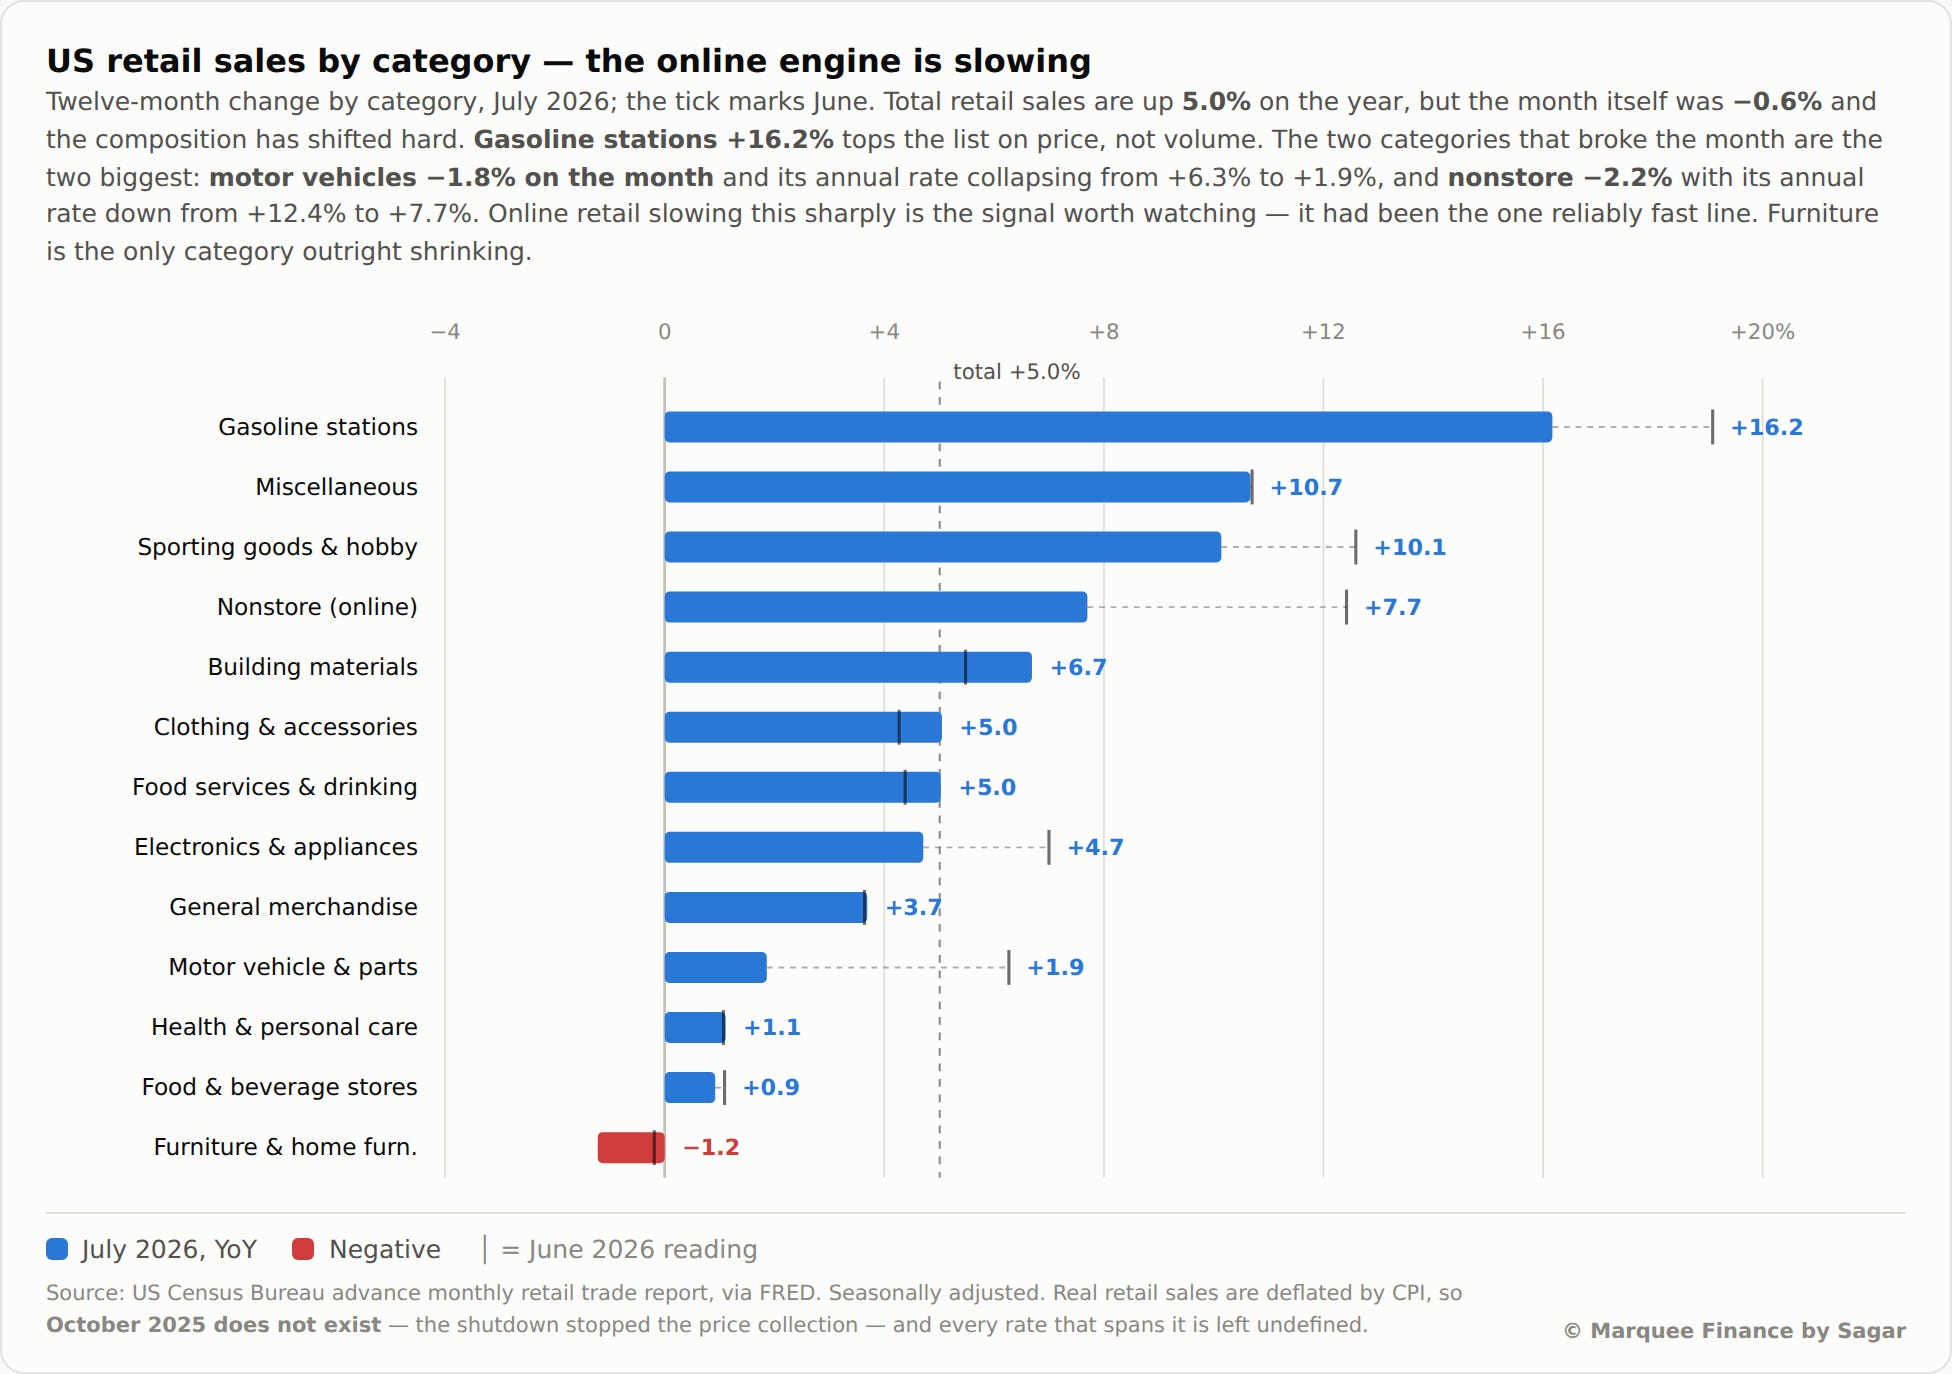
In fact, non-store retailers, or online sales, recorded the second-biggest MoM drop since 2021.
Interestingly, the culprit was the slowdown in non-discretionary spending by high-income households.
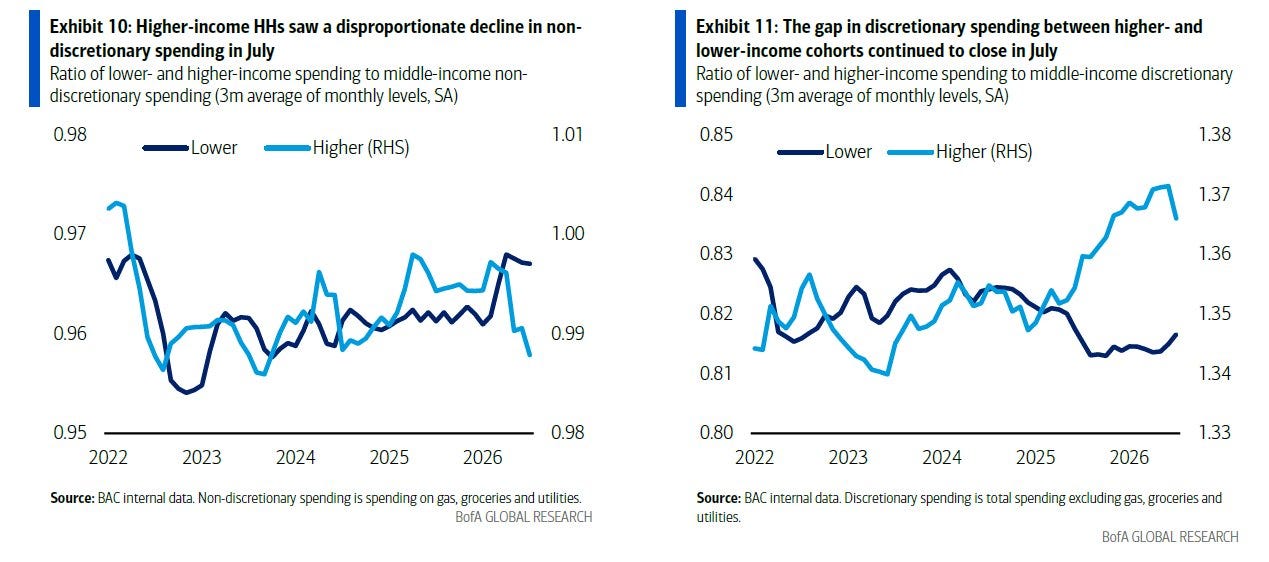
We will watch this trend, as it could snowball into a bigger slowdown.
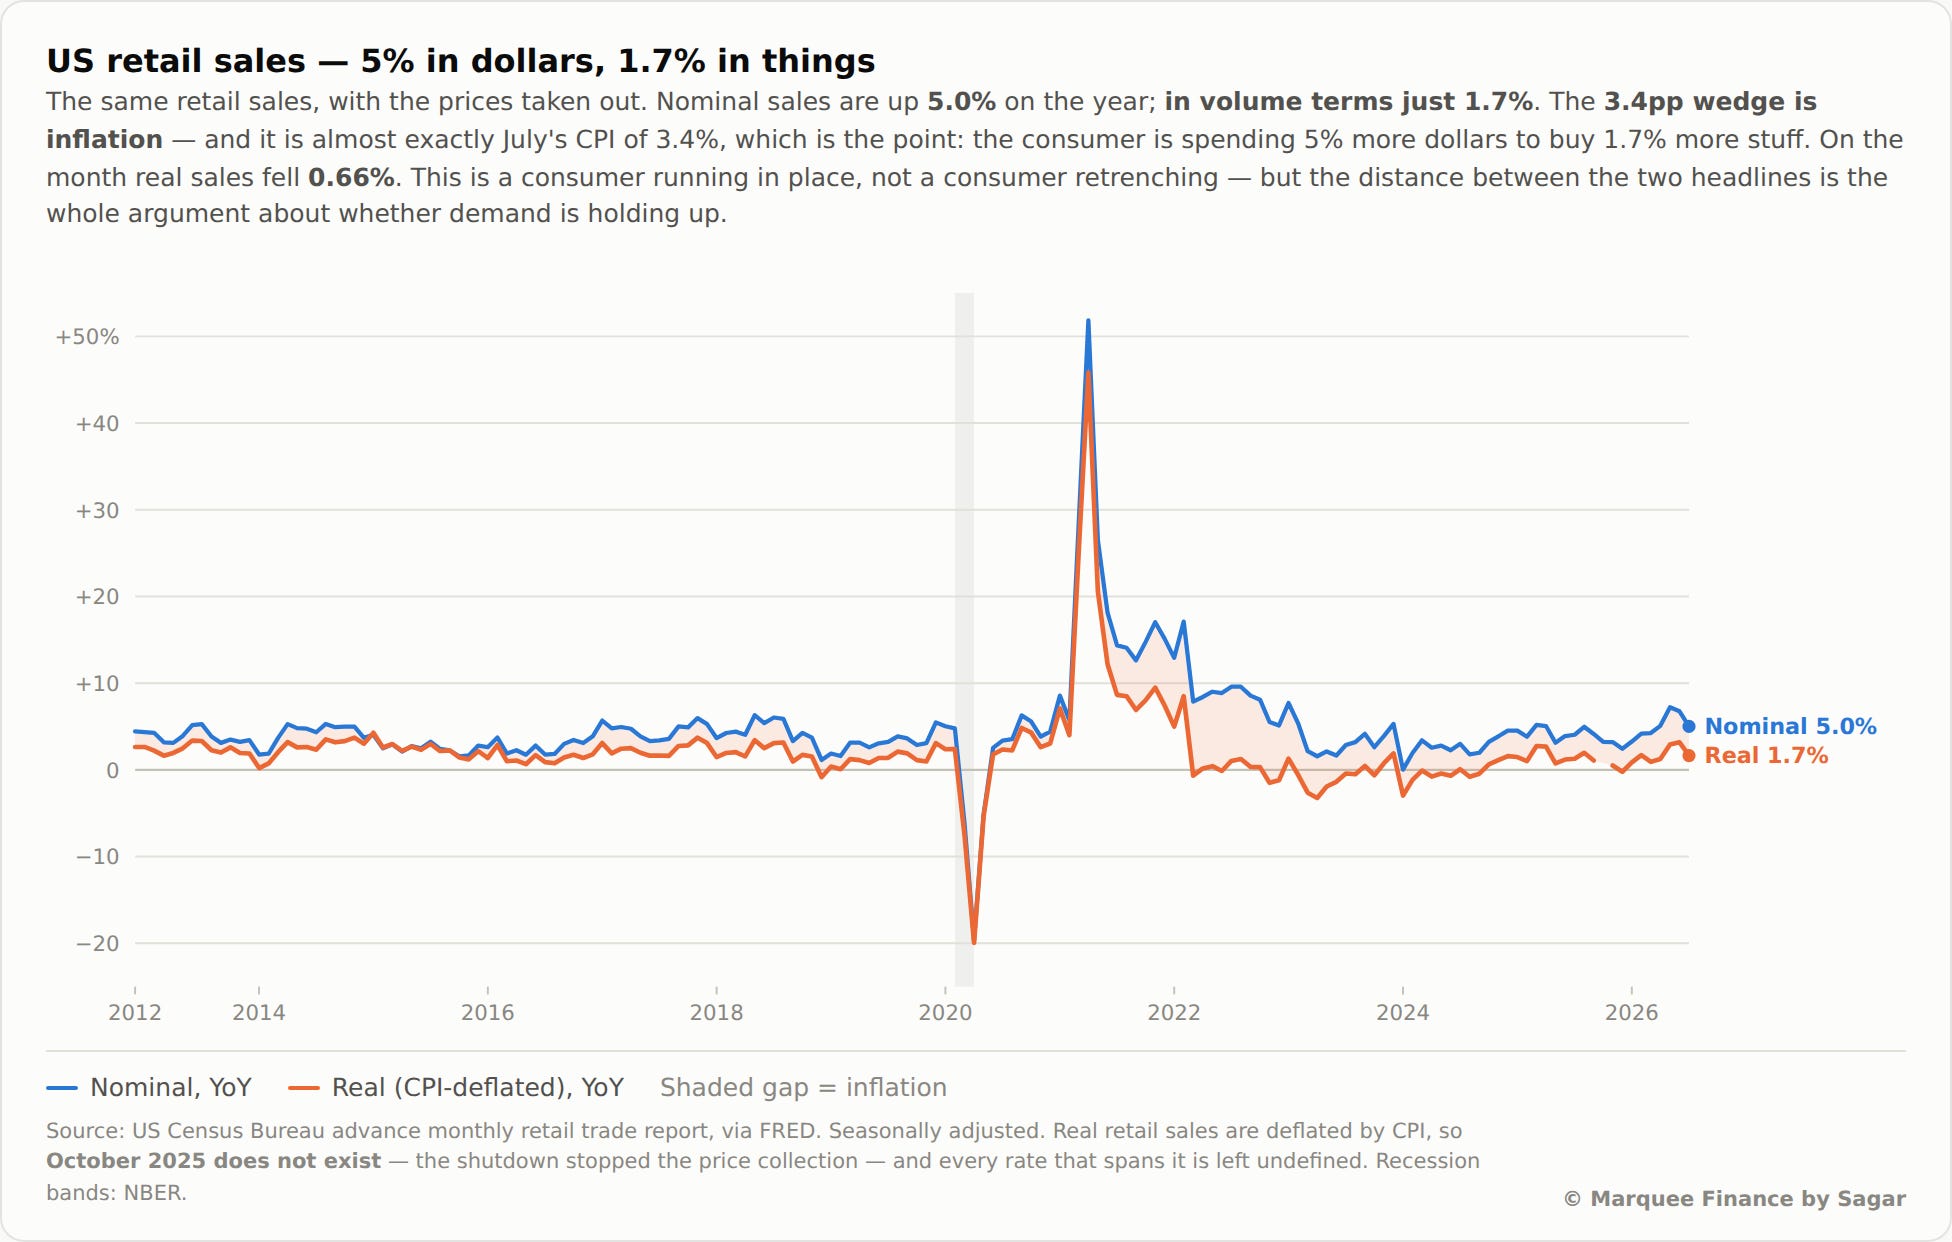
Real retail sales have been struggling, and there is further evidence of this.
While nominal sales were up +5.0% YoY, in volume terms, it was only up +1.7%.
We also got the NFIB Small Business Survey.
The Single Most Important Problem saw a mind-boggling change.
The Quality of Labor (Single Most Important Problem) saw the third-largest on-month rise in 40 years and jumped to 26.6%, up 800 bps.
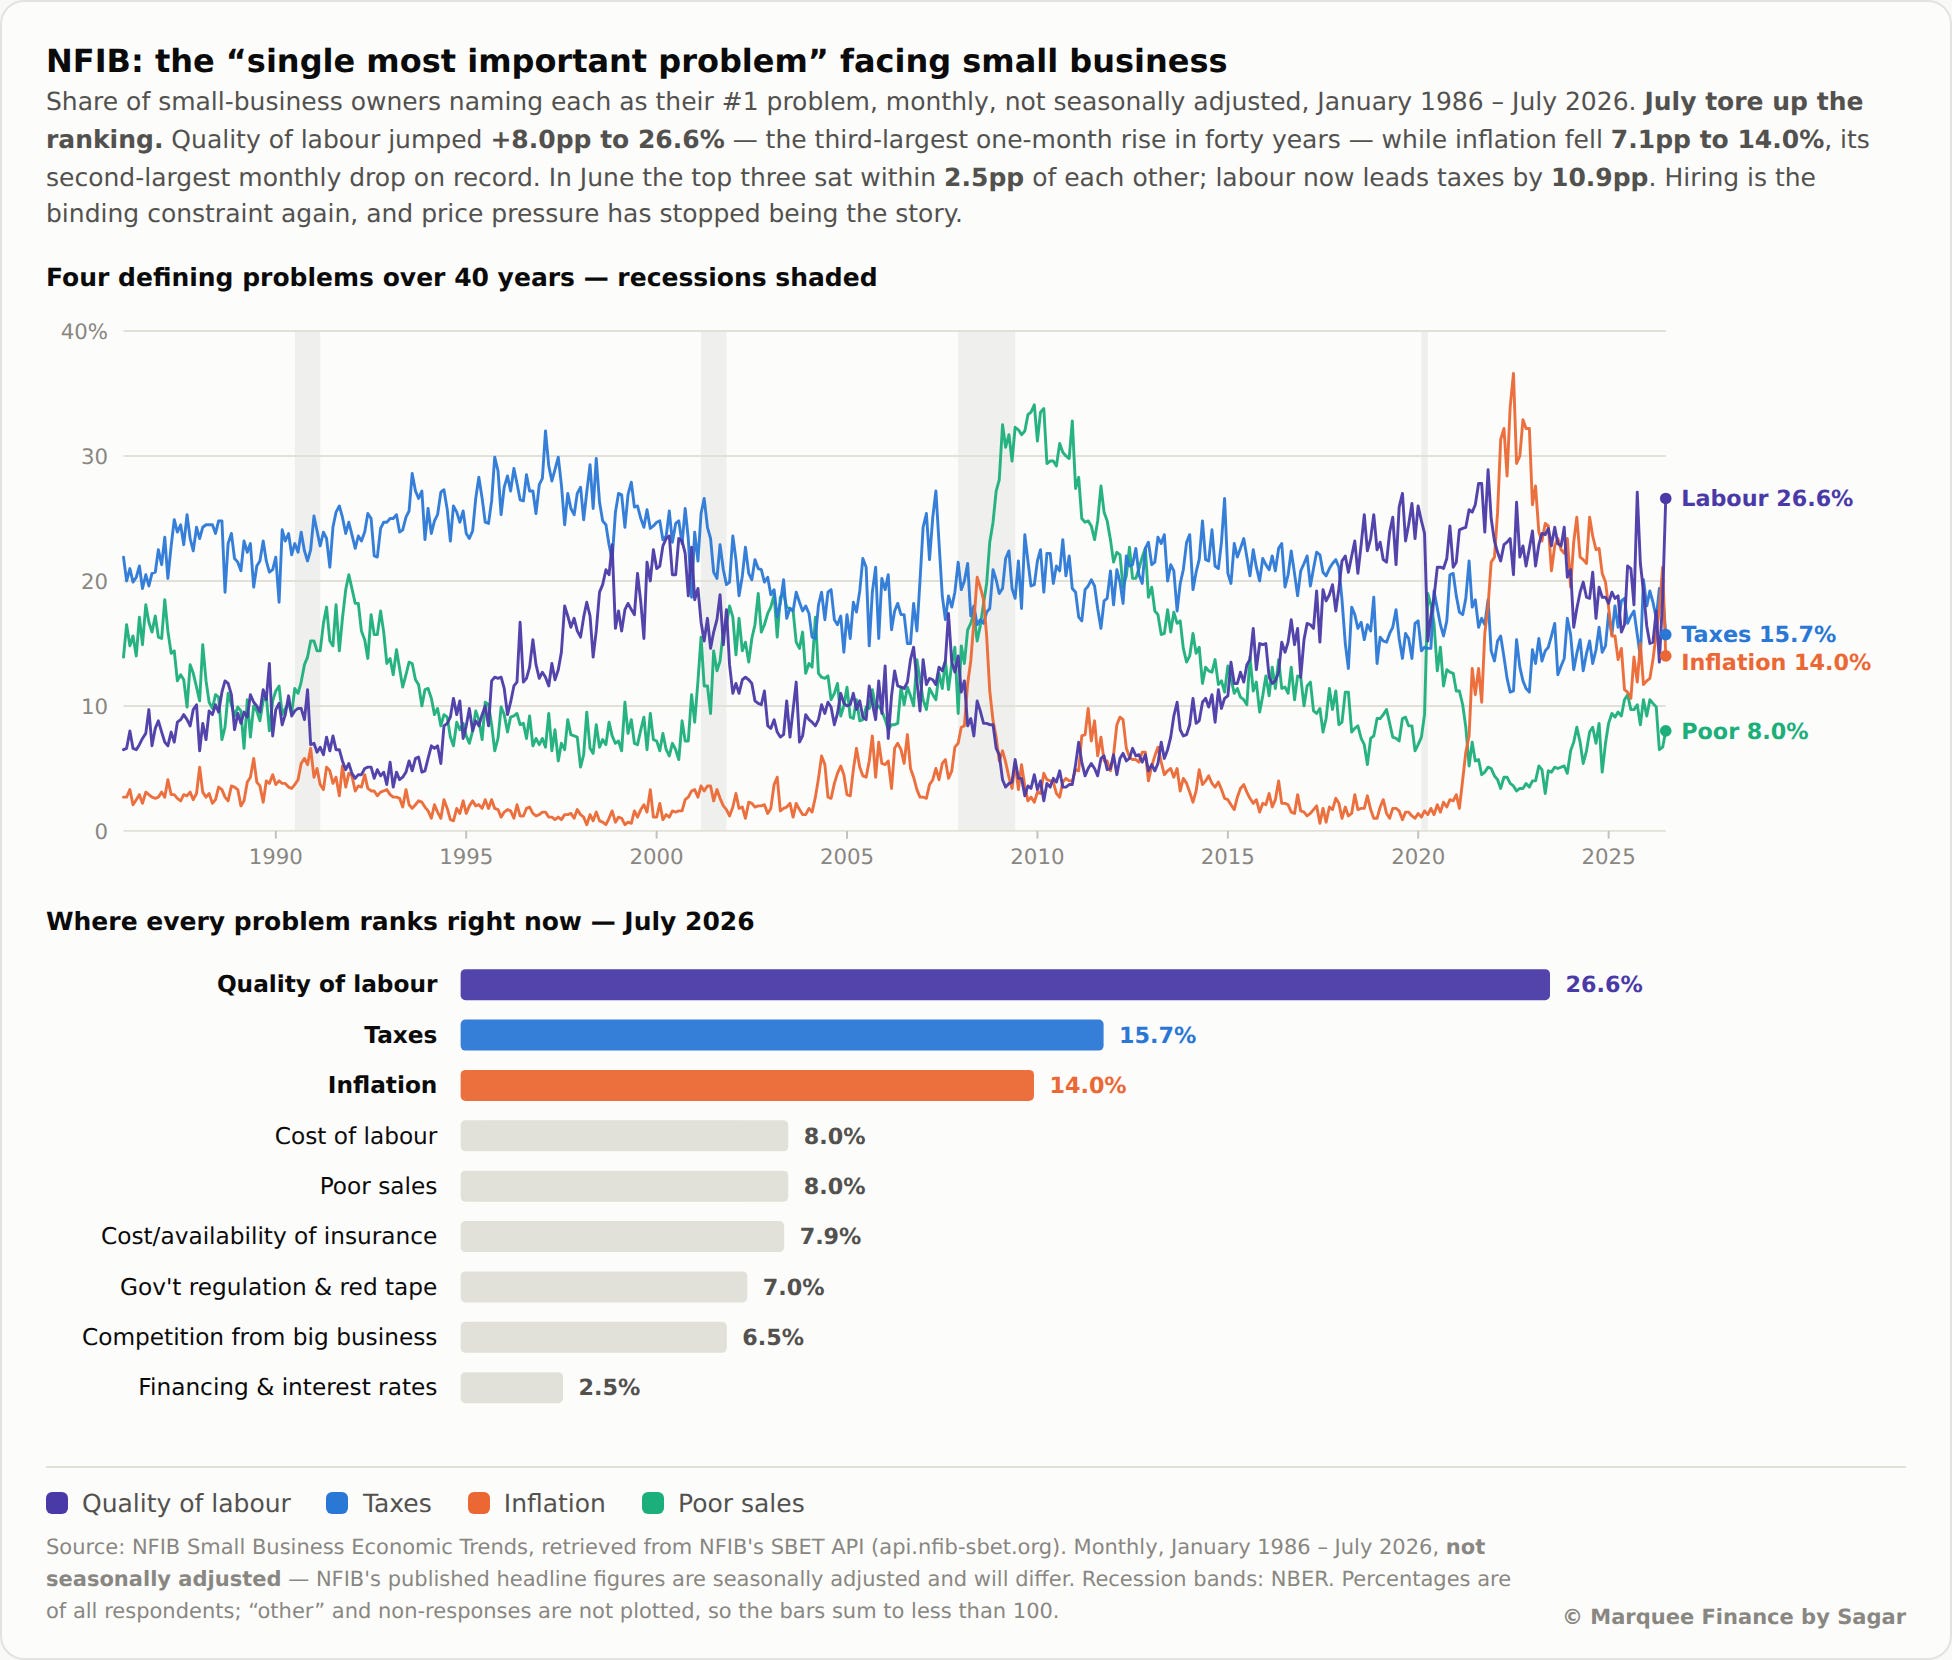
Unsurprisingly, the labour market is undergoing significant structural changes as we discussed in detail last week, and that is now visible in the data as well.
One must note that the labour market is the most lagging indicator.
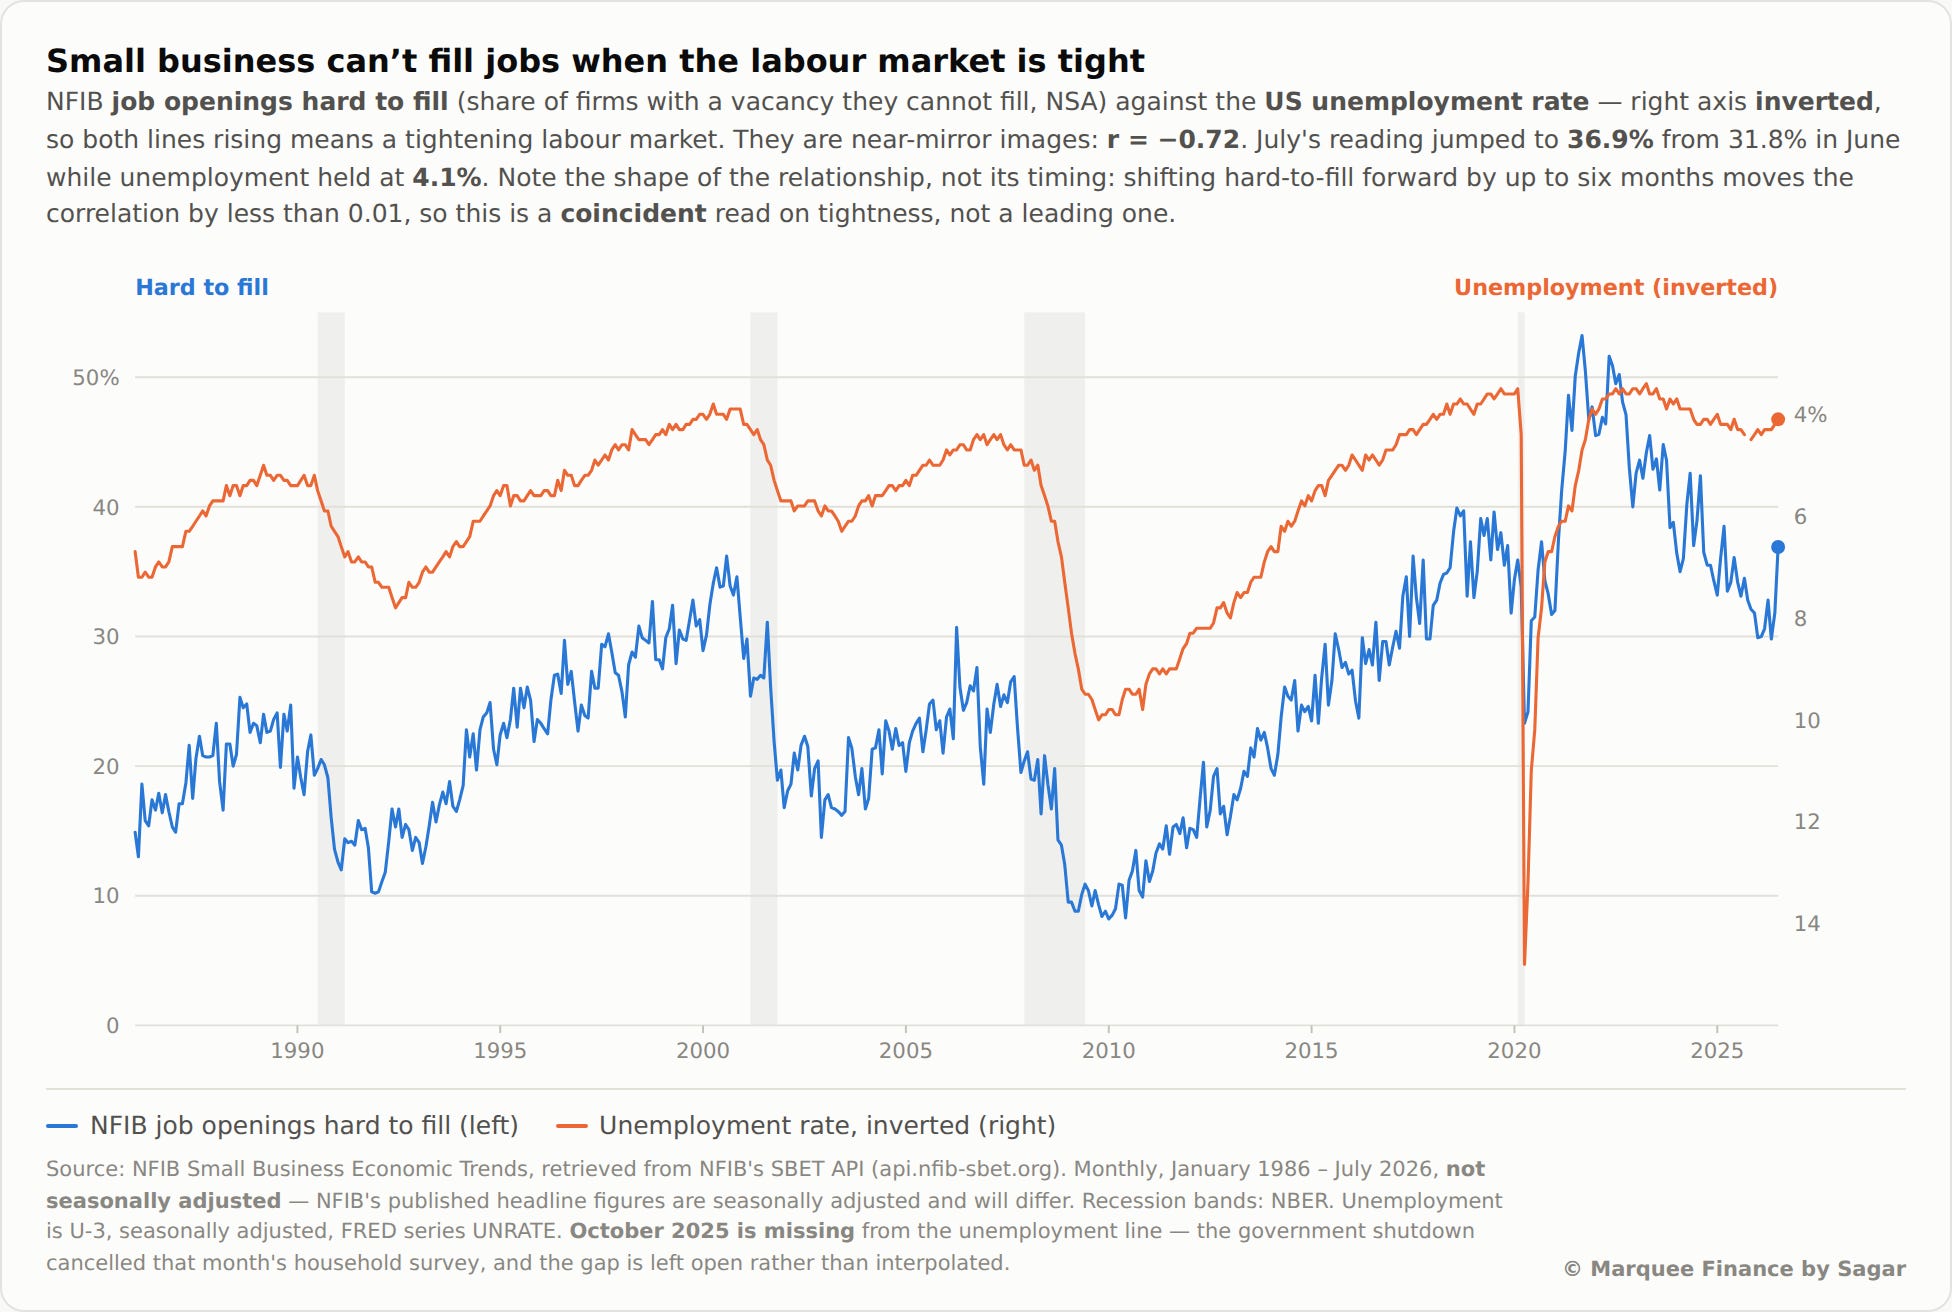
The other NFIB chart that suggests tightening in the labour market (not the actual tightening, but the “quality” component/requisite skill) is “Jobs hard to fill.”
Jobs Hard to Fill jumped from 31.8% to 36.9%.
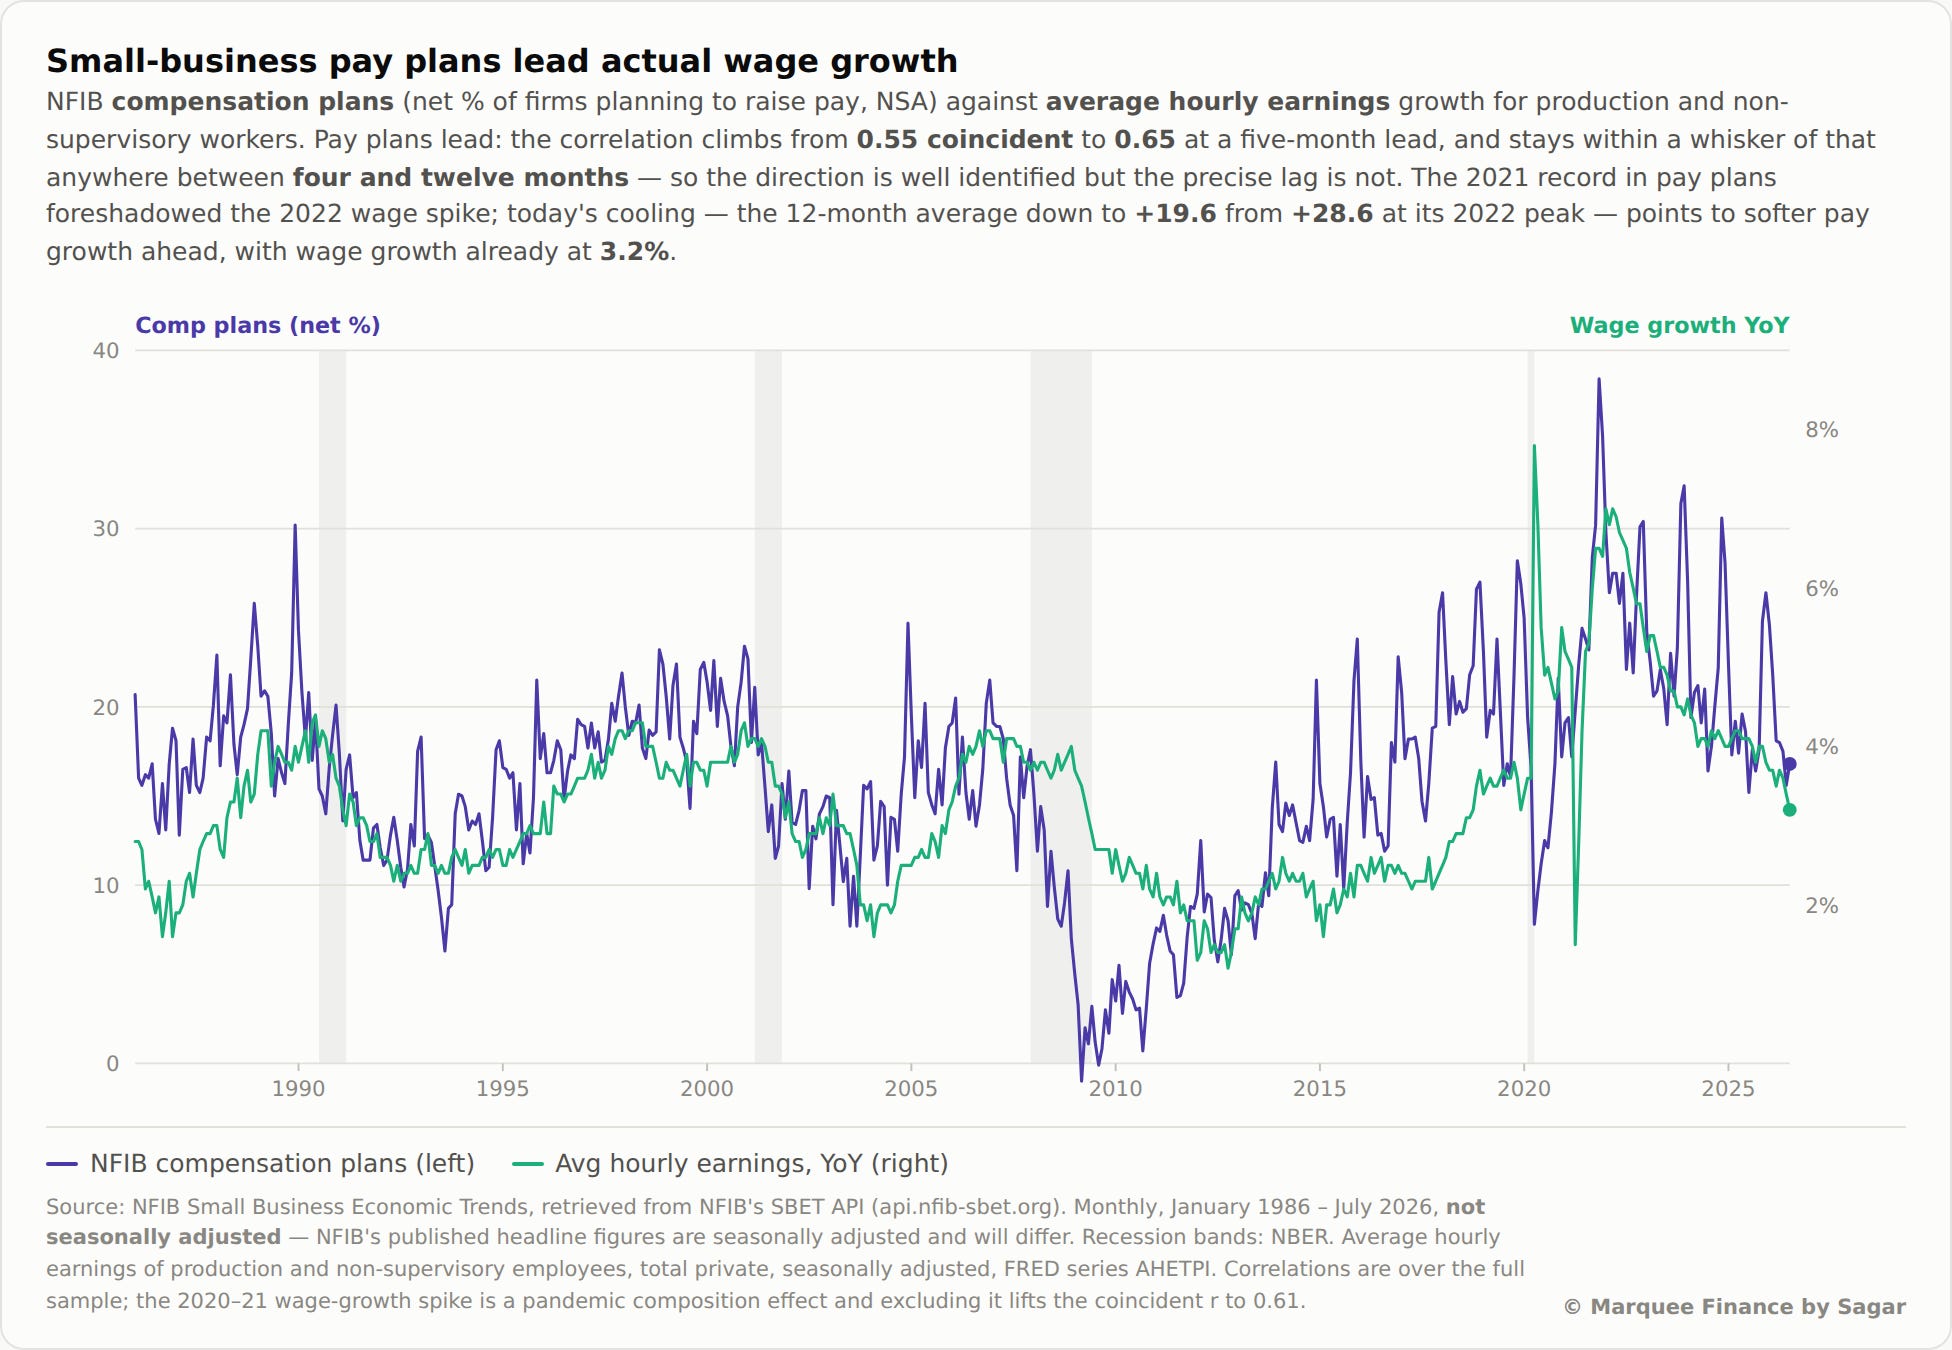
Despite the state of the labour market and high inflation, wage growth has been moderating, as visible by NFIB compensation plans.
Equities!
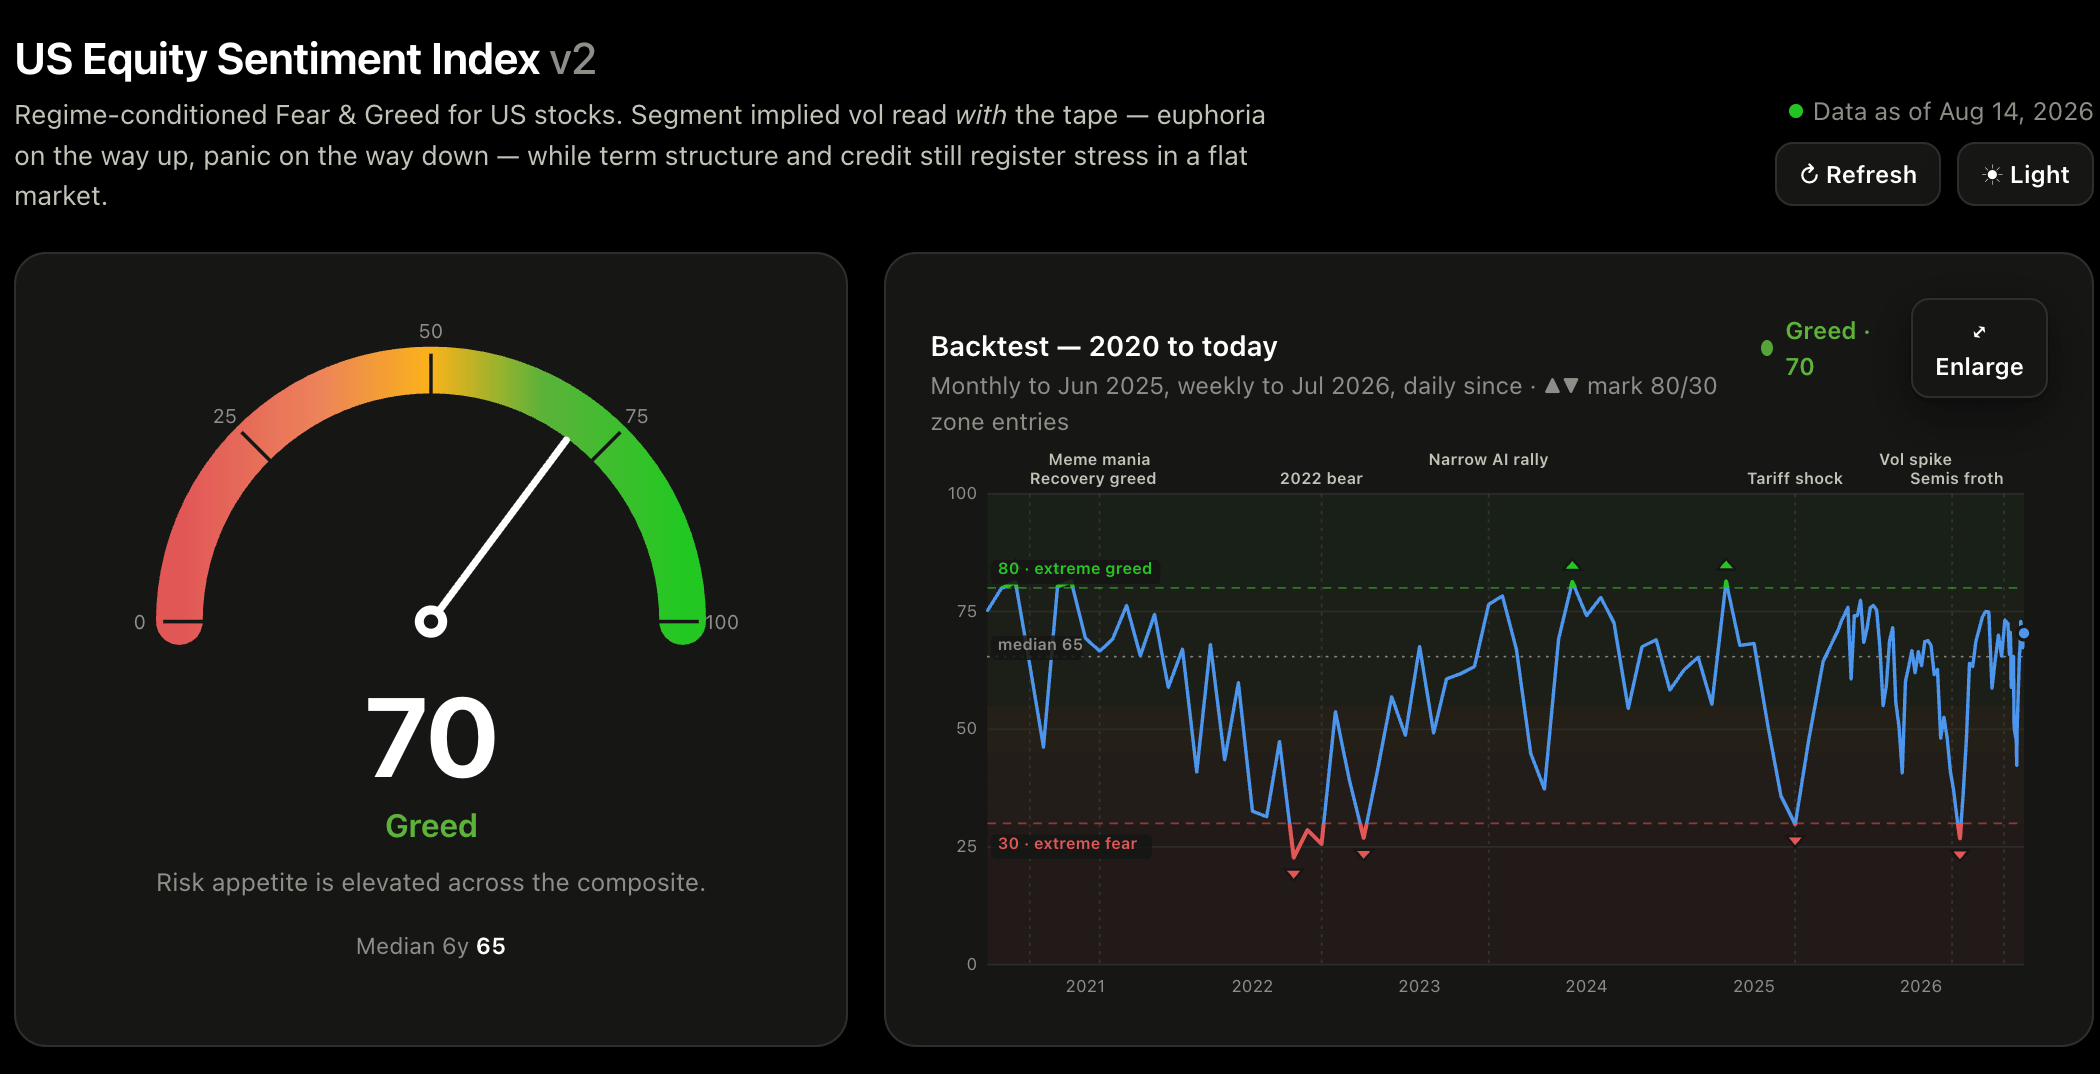
The Greed and Fear Index is firmly in greed with a reading of 70.
The good part for the bulls is that we are not in the “extreme greed” section.
SPX closed at a fresh weekly ATH.
Our measured target from the breakout zone was 7850.