

Last week we wrote, “Is It Beginning Or Is It Over?” and paid subscribers would have known what we meant.
We were waiting for this opportunity for long and we are glad to inform that we benefitted the most from the current drawdown in equity markets due to our short position and the anti-AI names in our portfolio.
In fact, our PF touched fresh YTD highs on Thursday as the street witnessed a bloodbath.
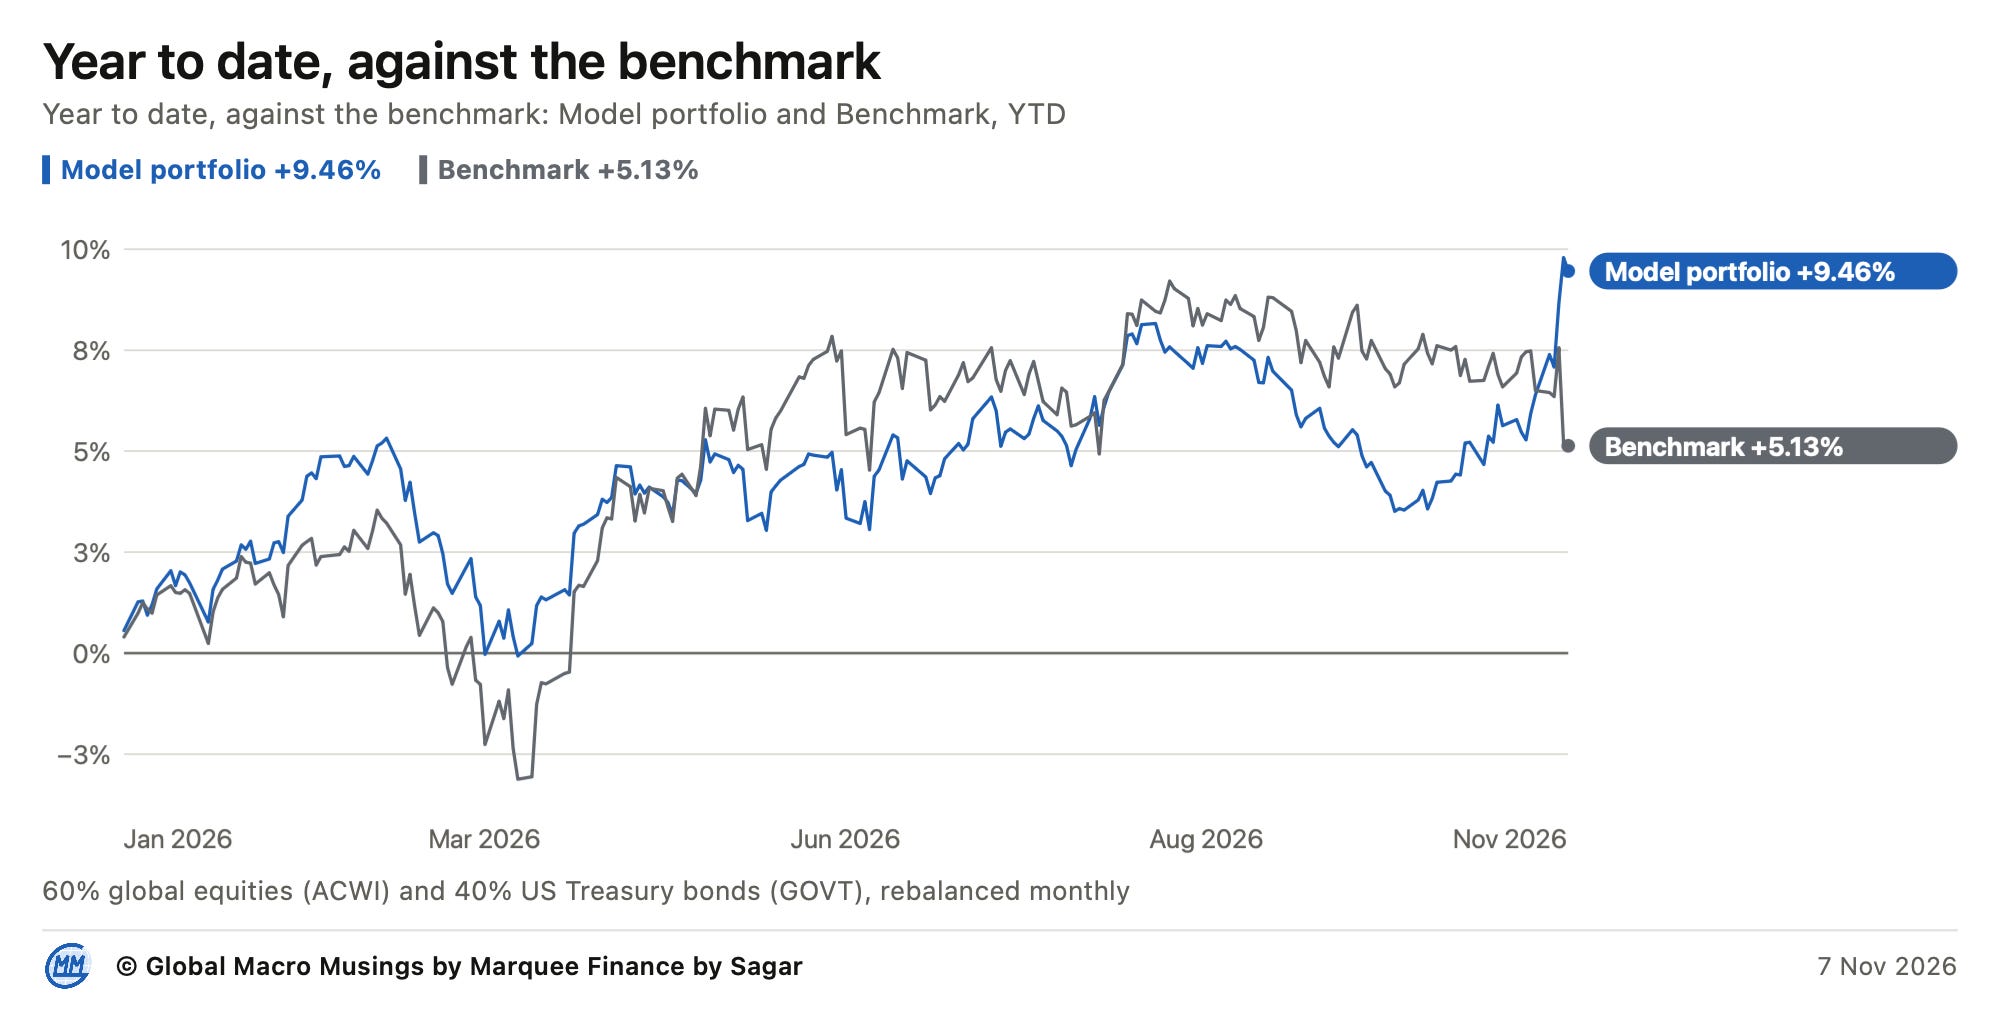
We are now outperforming the benchmark by 400 bps and are on target to post double-digit returns this year, as we promised.
Nevertheless, not everybody had the privilege of gaining from the market crash.
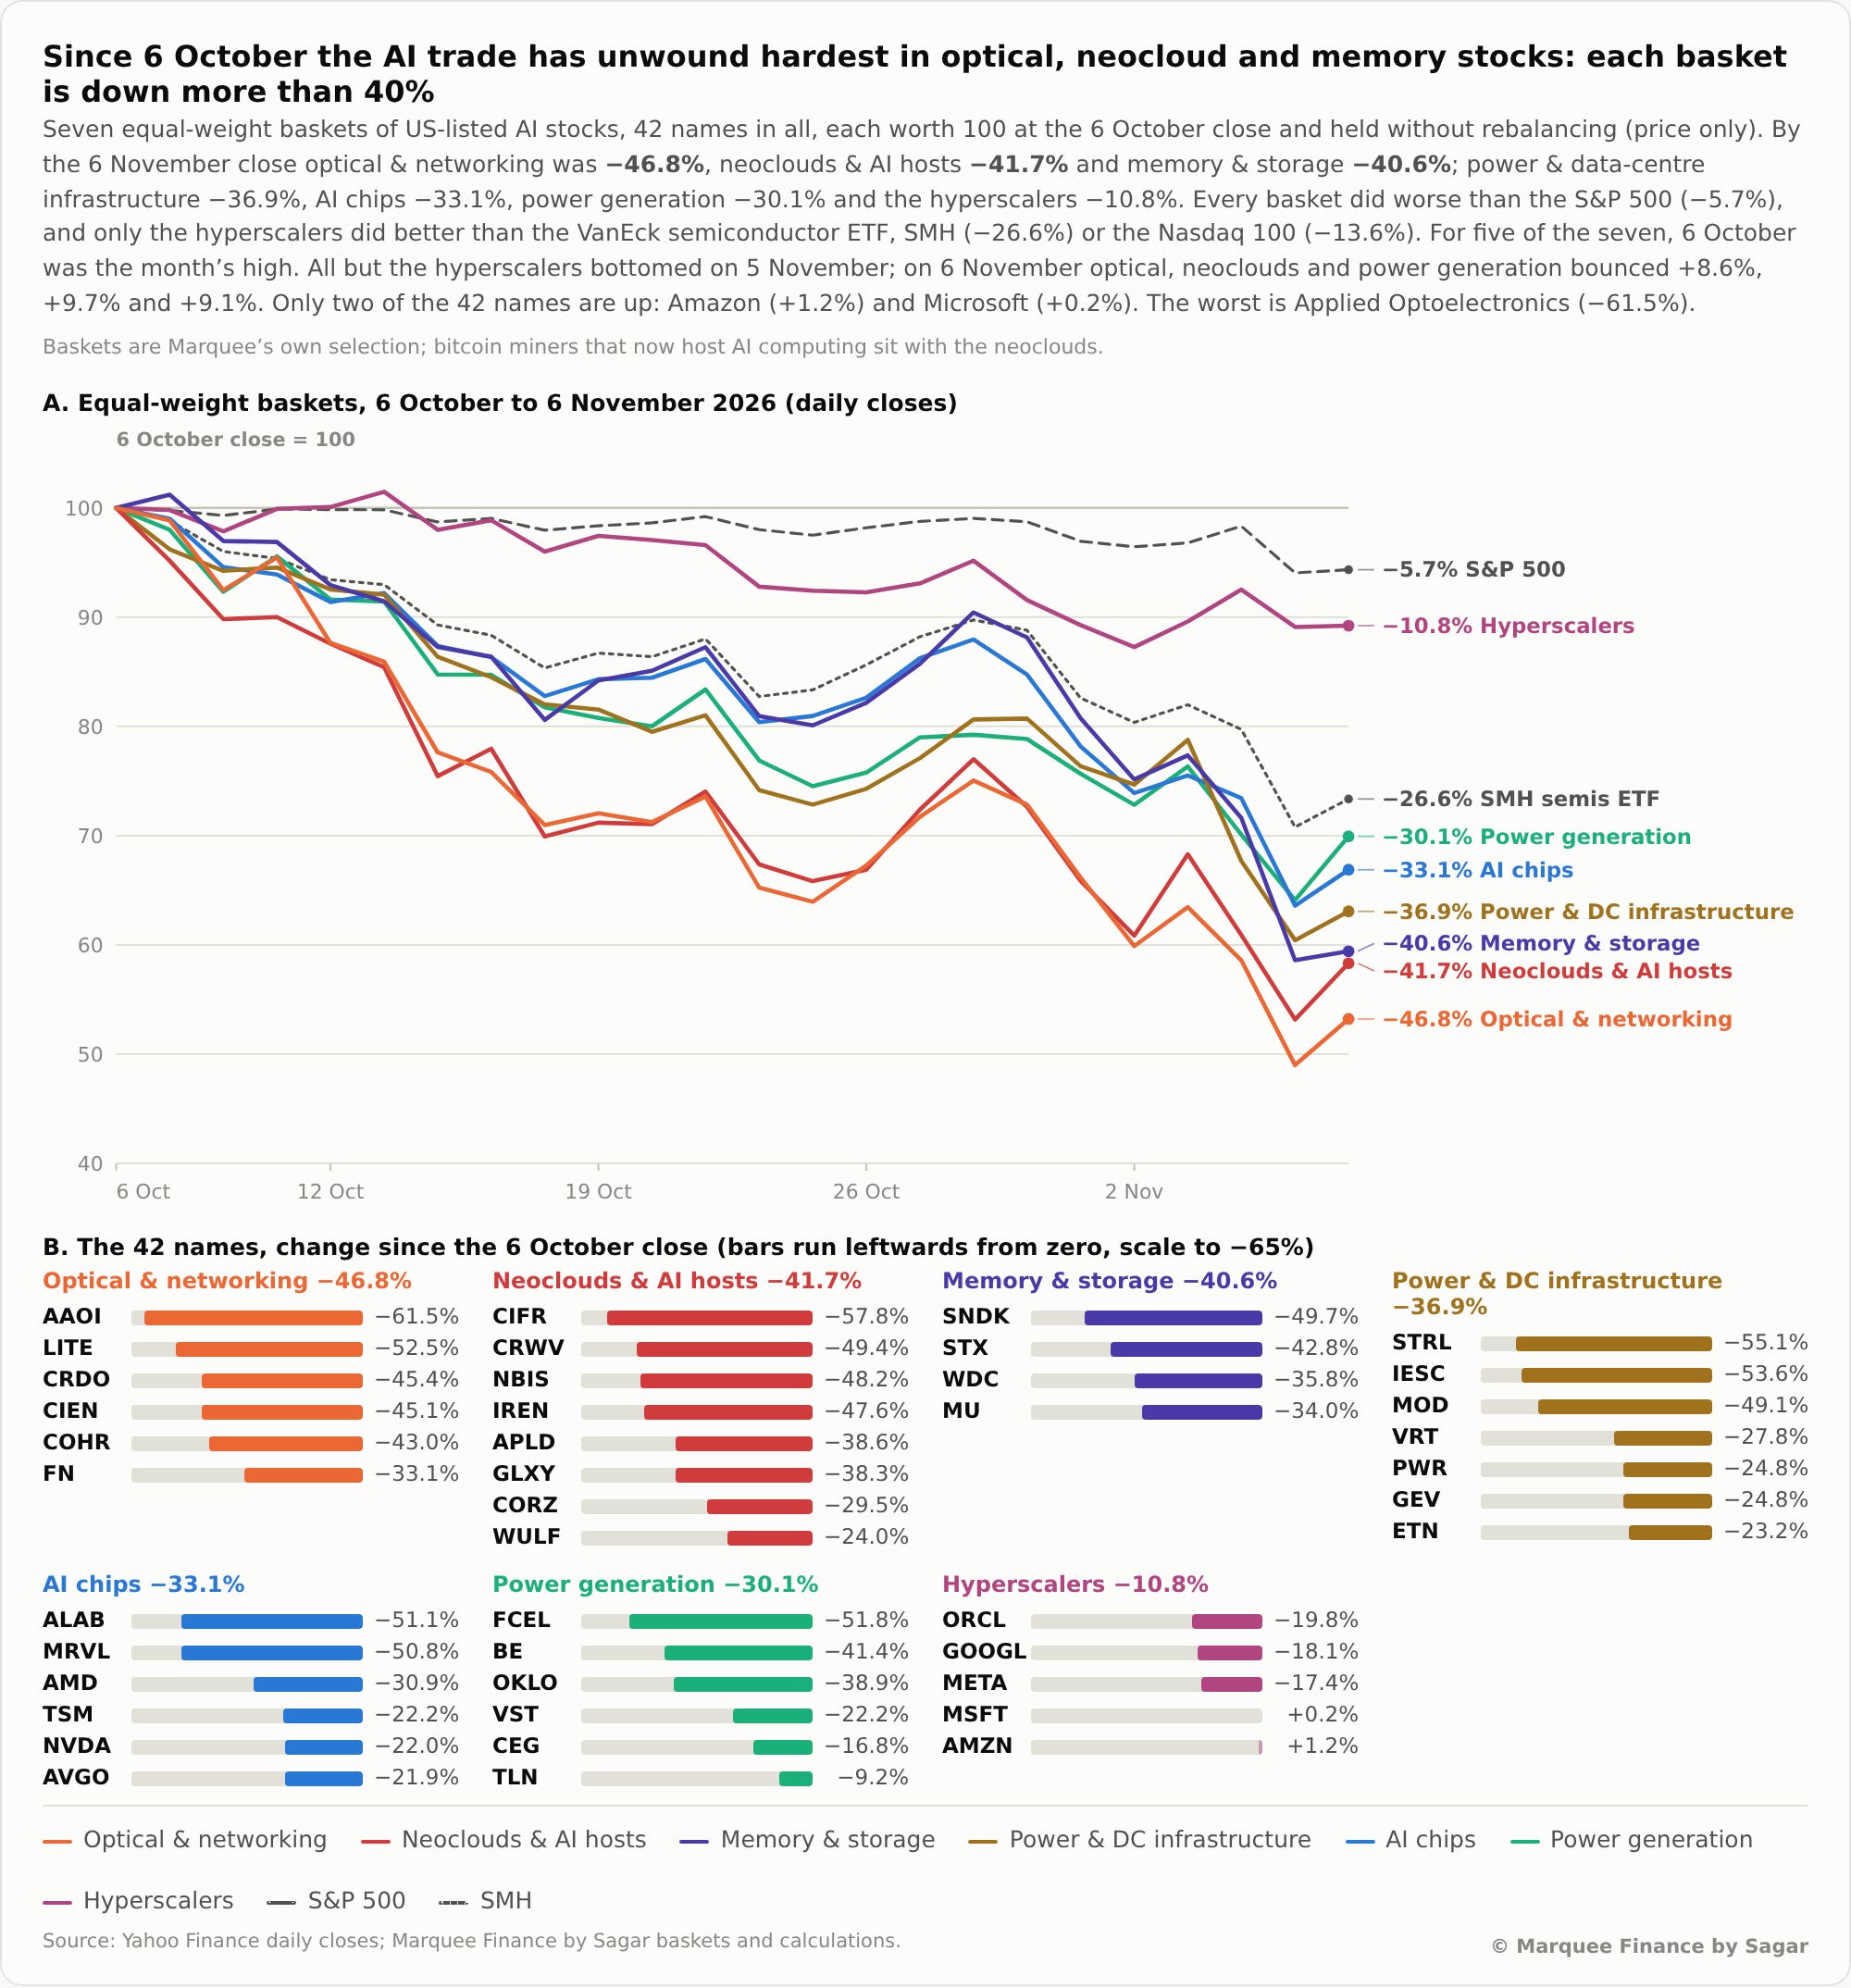
As everyone from retail investors to institutions to hedge funds piled into the long AI trade, we saw massive unwinding in the last month.
The whole AI complex is down 30-50%, excluding hyperscalers (lower drawdown as they did nothing in the last 12 months).
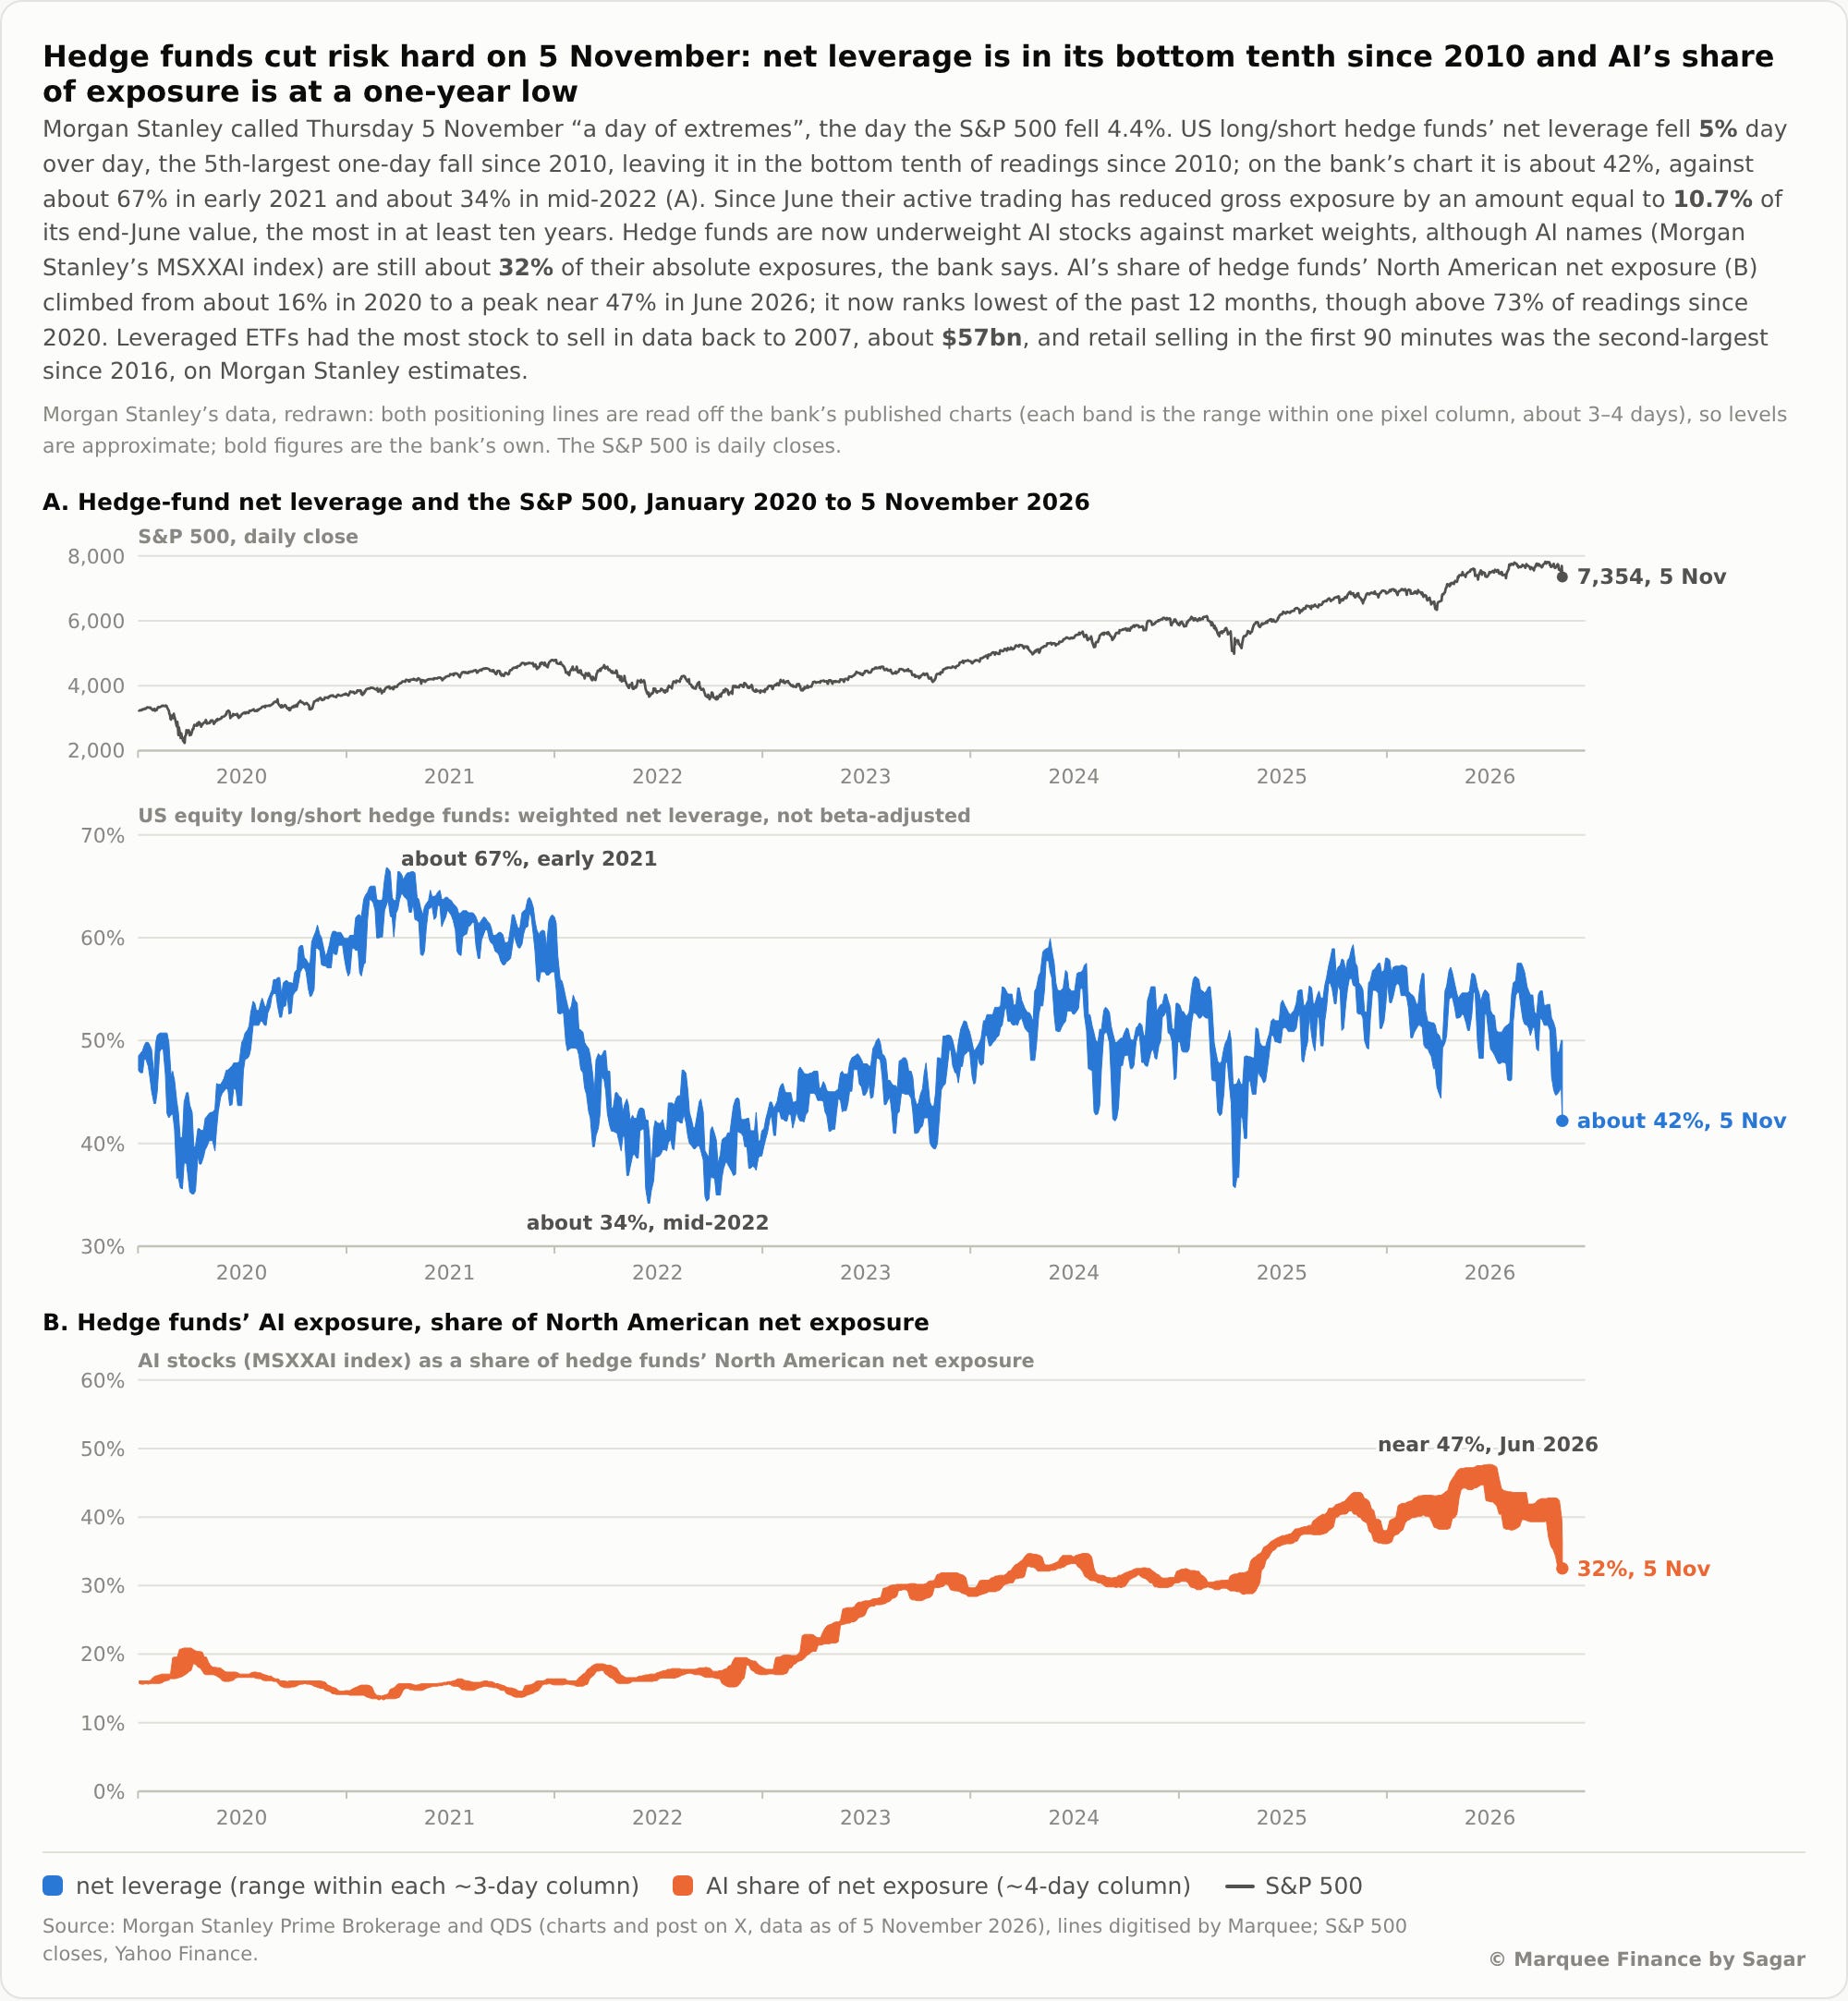
We saw carnage in the hedge fund universe as there was massive deleveraging on Thursday, when NDX fell by more than 6%, and SMH/SOX recorded one of its worst-ever days in the last 2 decades.
As a result, the net leverage fell by a whopping 5% (Day V/s Day) in a single day.
Notably, it was the 5th largest one-day fall since 2010.
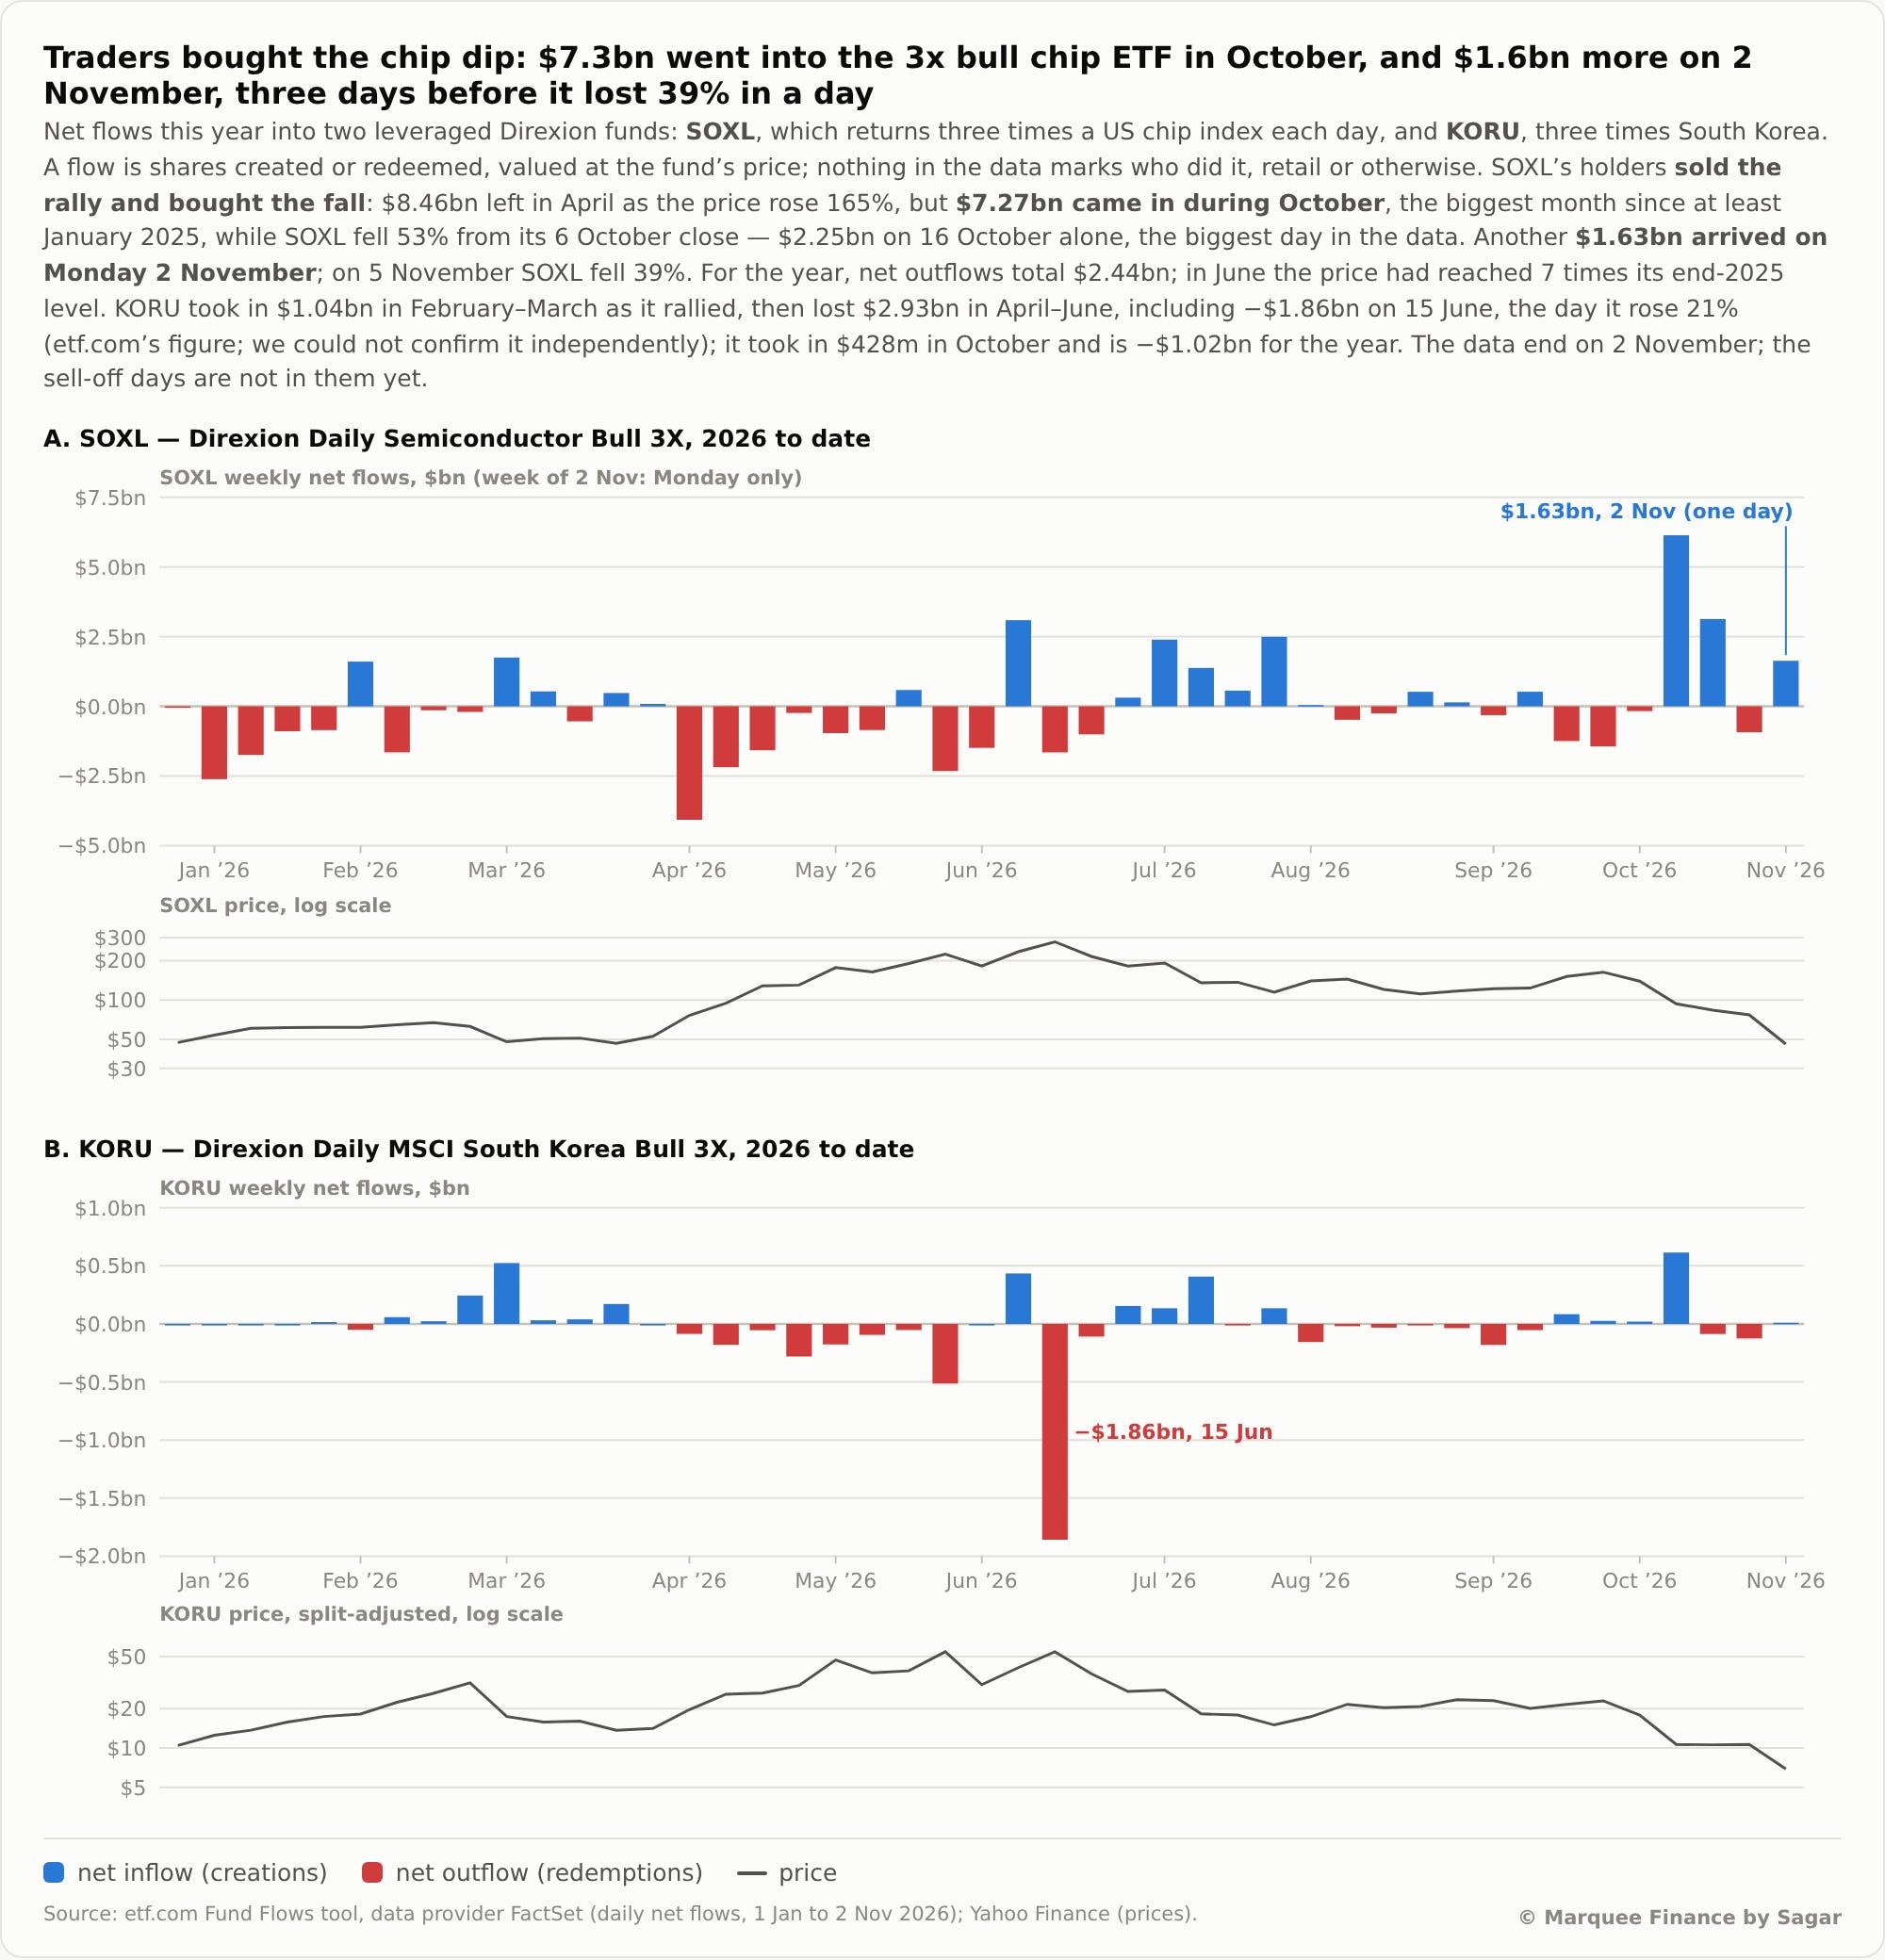
Not only did the hedge fund universe feel the pain, but retail investors/traders got rekt as they poured $1.6 billion into SOXL, the 3X-leveraged ETF, three days before it lost 39% on Thursday.
We are seeing a trend in 2026: one asset class gets pumped to the moon with insane narratives across social media, then dumped hard.
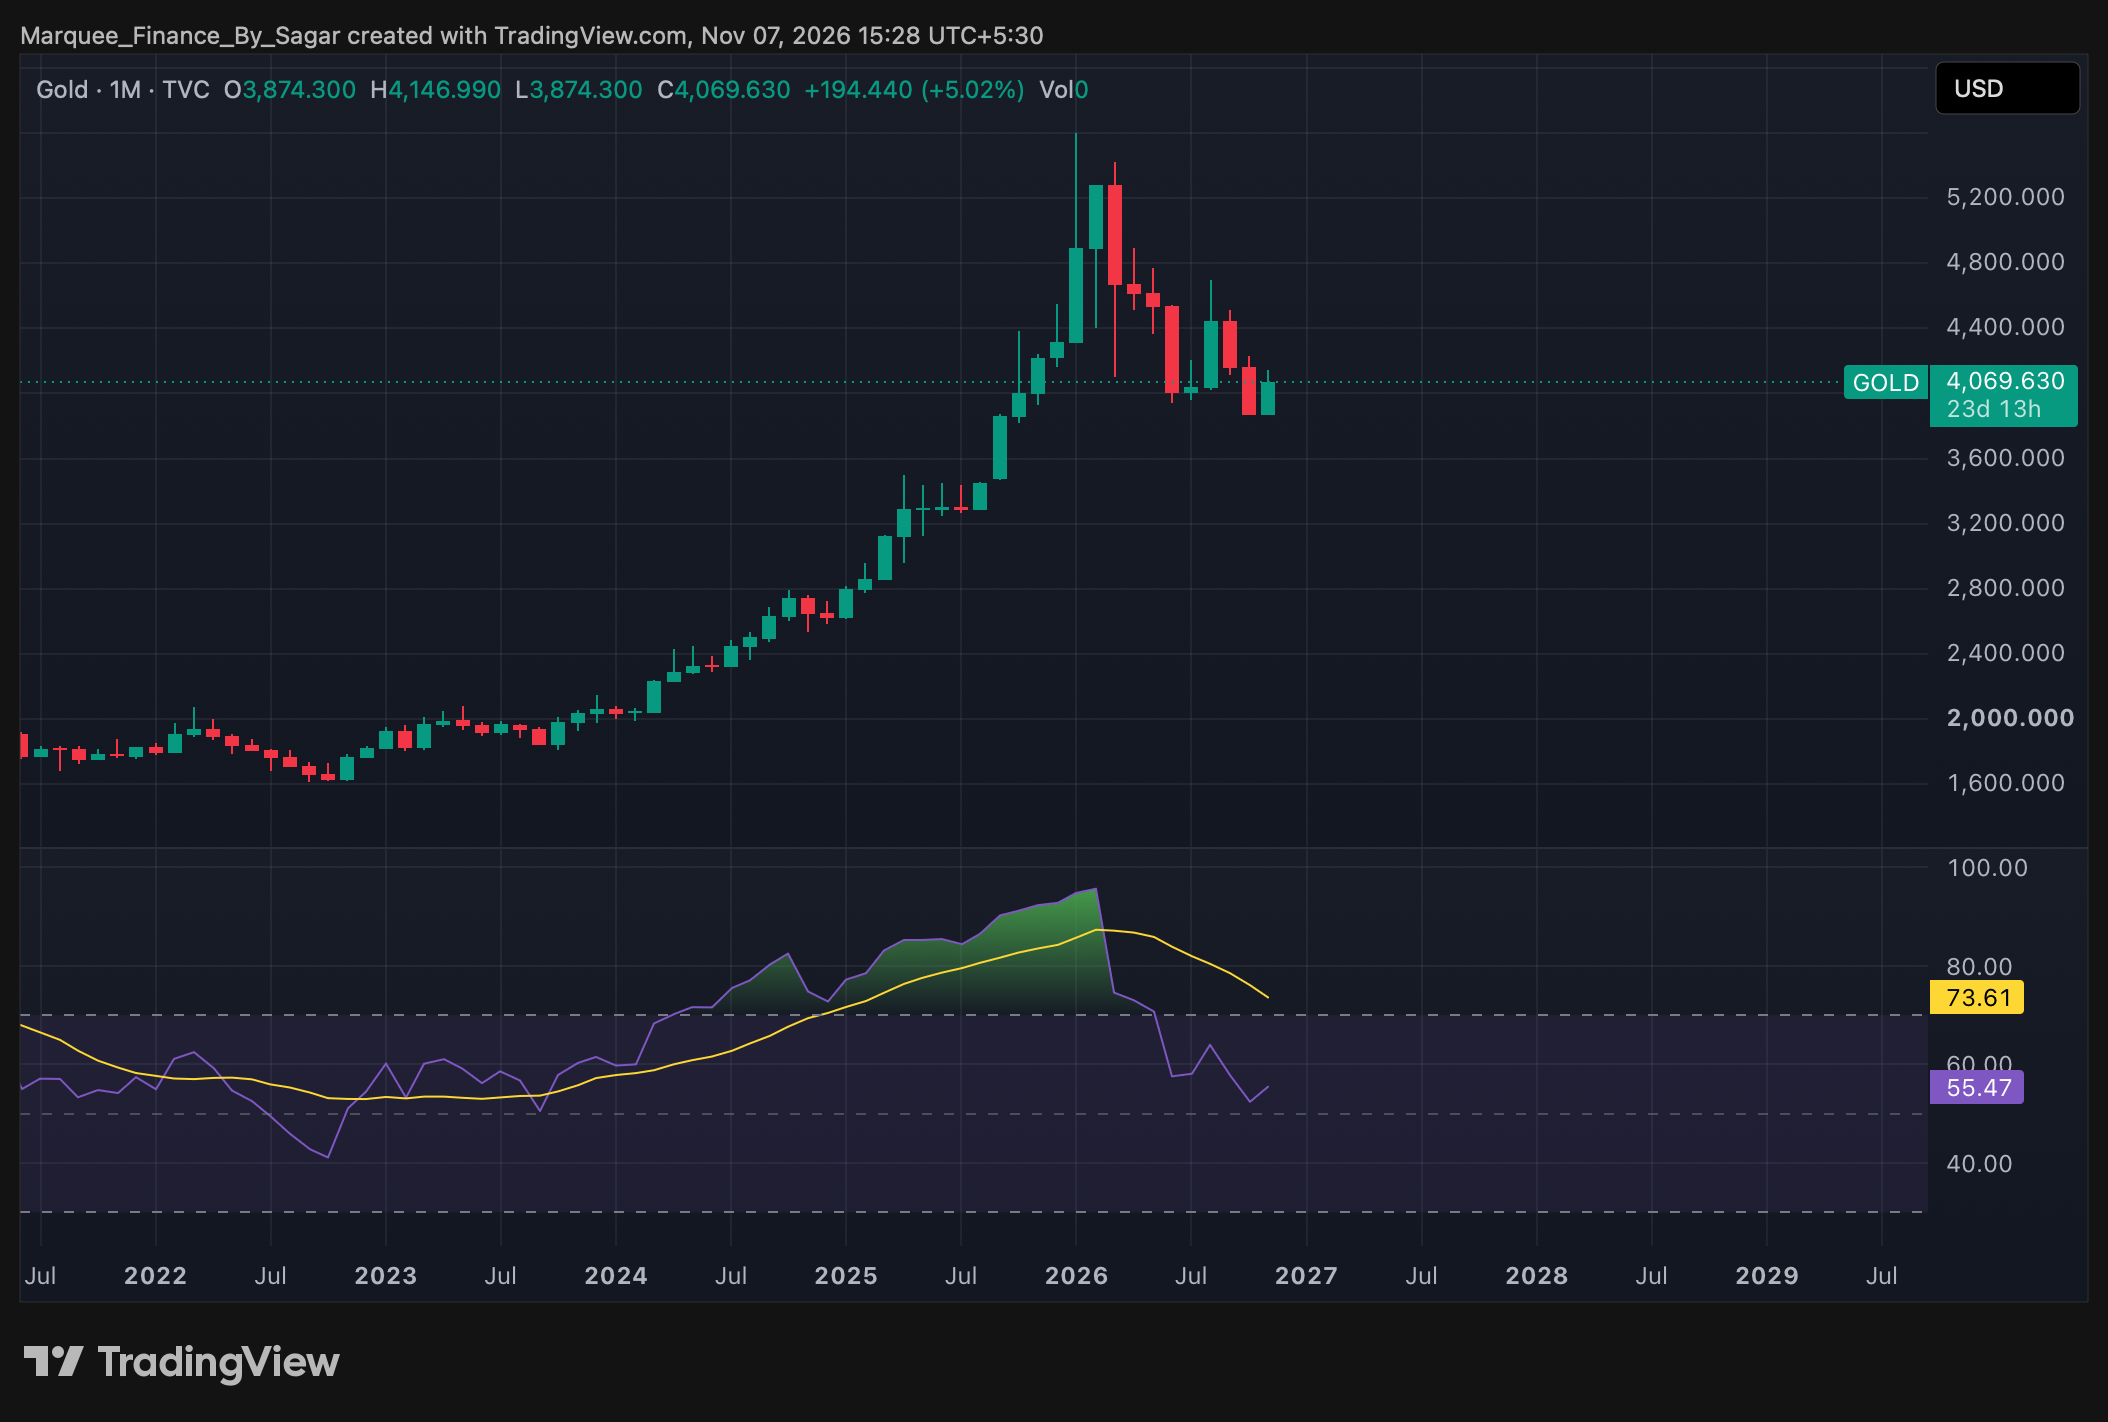
We saw Gold's monthly RSI cross 95 for the first time this year, when the “de-dollarisation” narrative peaked, and then it dumped hard in late January.
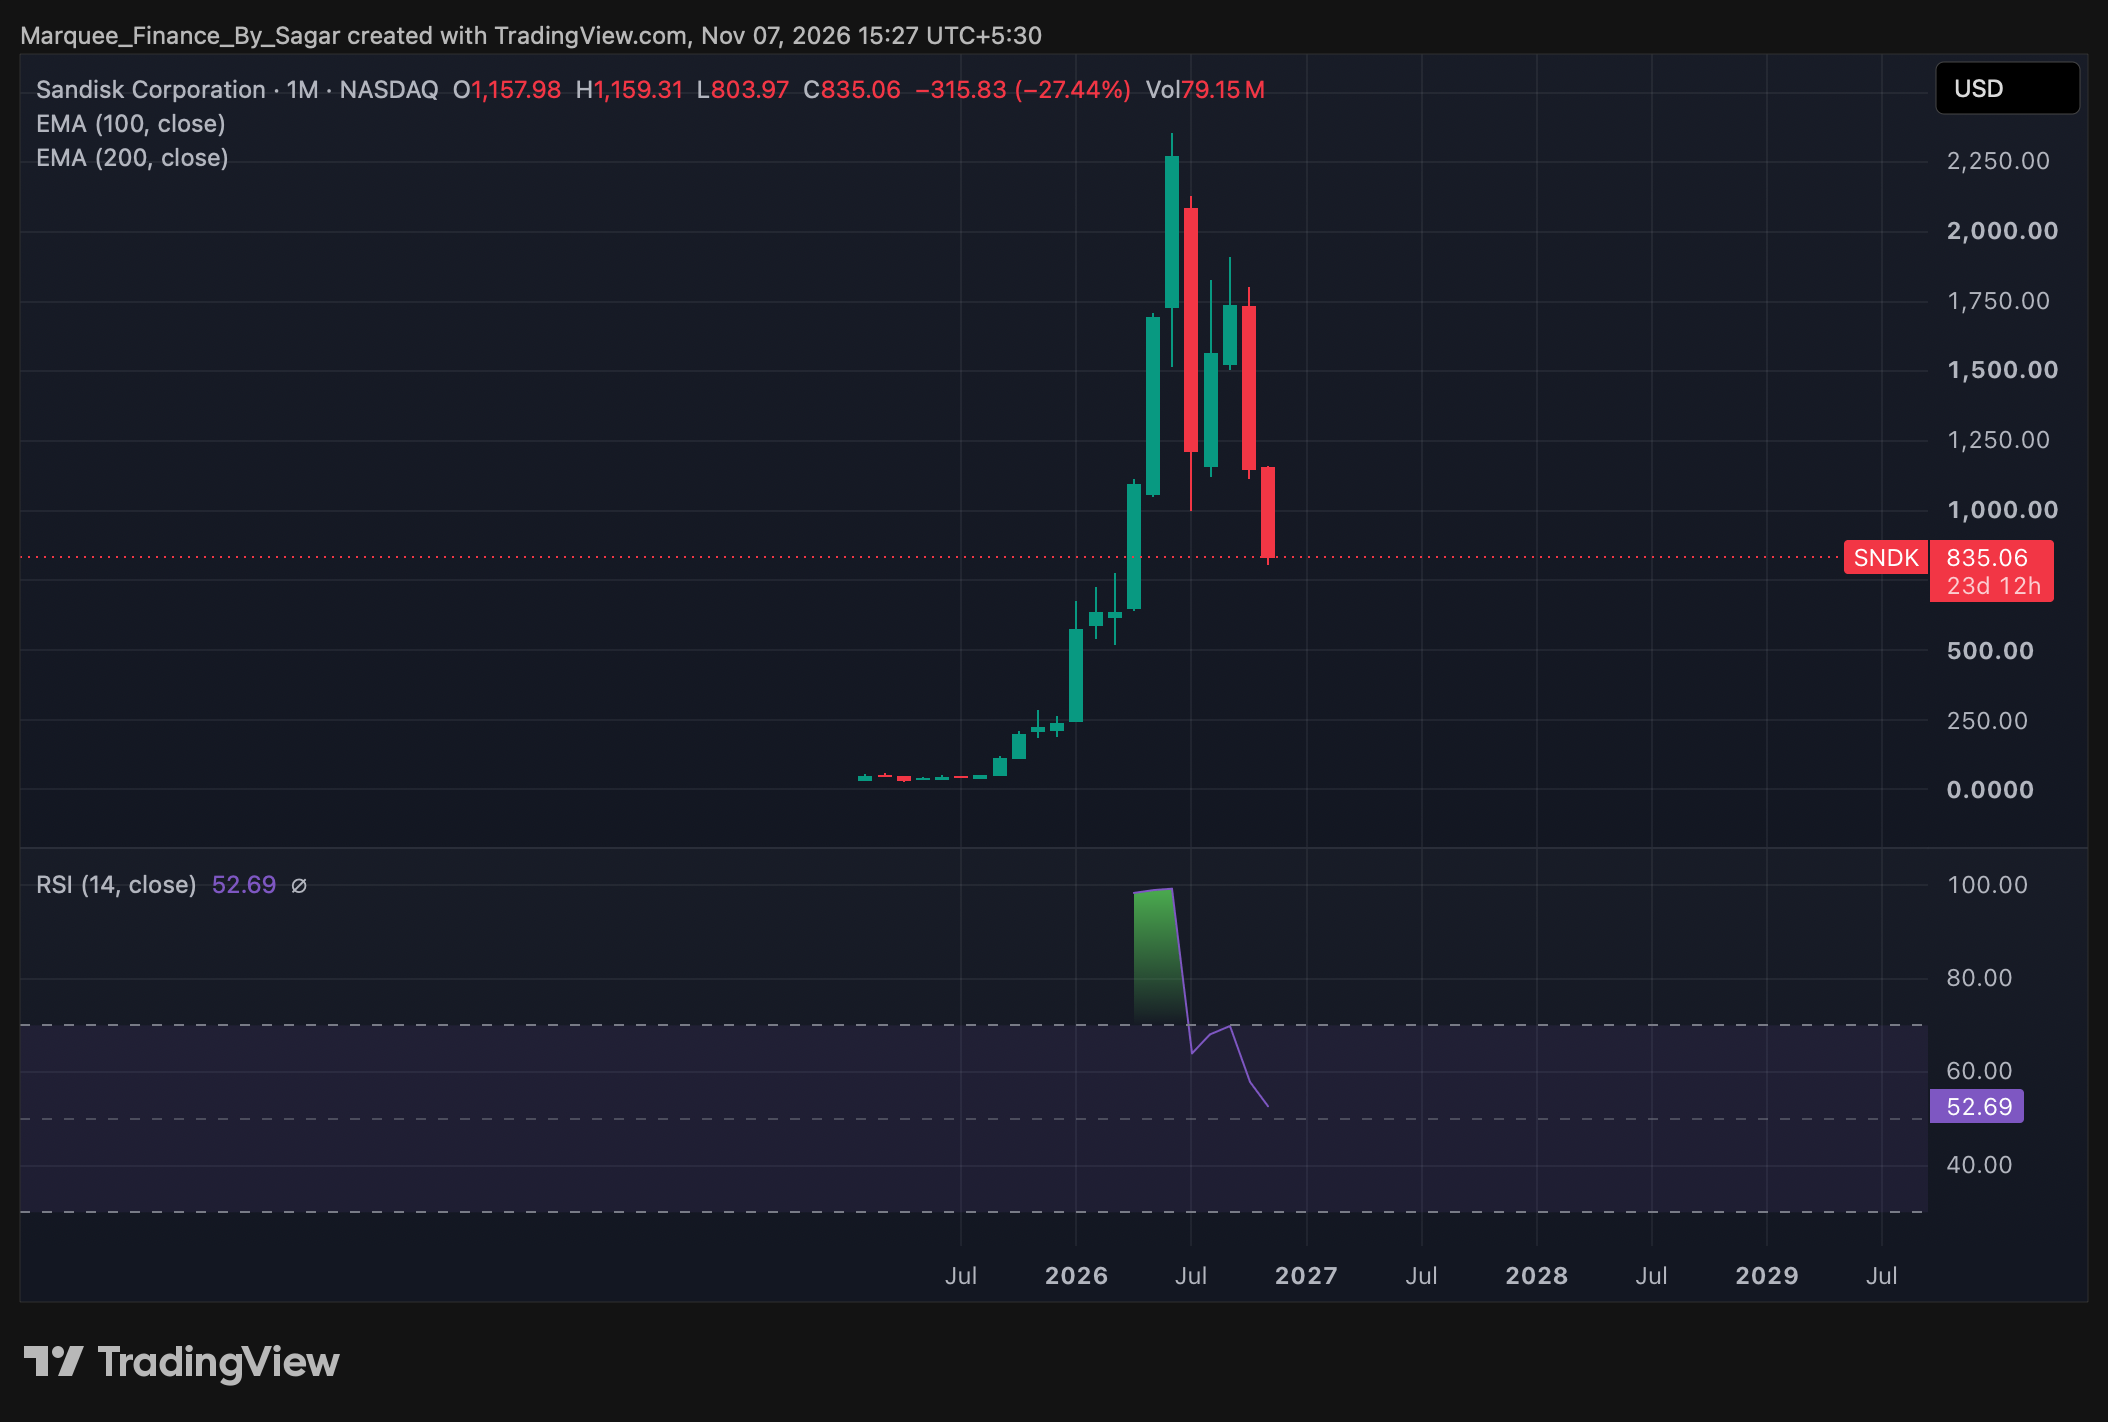
Next, after the Iran war ceasefire news, the memory stocks were pumped, with stocks like SNDK reporting a monthly RSI of nearly 99, testing the limits of technical analysis and momentum trading.
Now the dump is in process, with retail becoming the biggest bagholder.
As markets make a U-turn, we will be hunting for the next asset class to be pumped, as we saw with precious metals and semiconductors/memory this year.
Let us take a deep dive into the macro universe and comprehend the cross-asset price action.
US/Equities/Bonds/Gold/Dollar/Oil!
Our favourite cyclical indicator has been ISM Manufacturing.
The headline ISM Manufacturing came in at 55.5, slightly beating market expectations of 54.5.
Within ISM Manufacturing, we track New Orders Less Inventories because it leads the headline index.
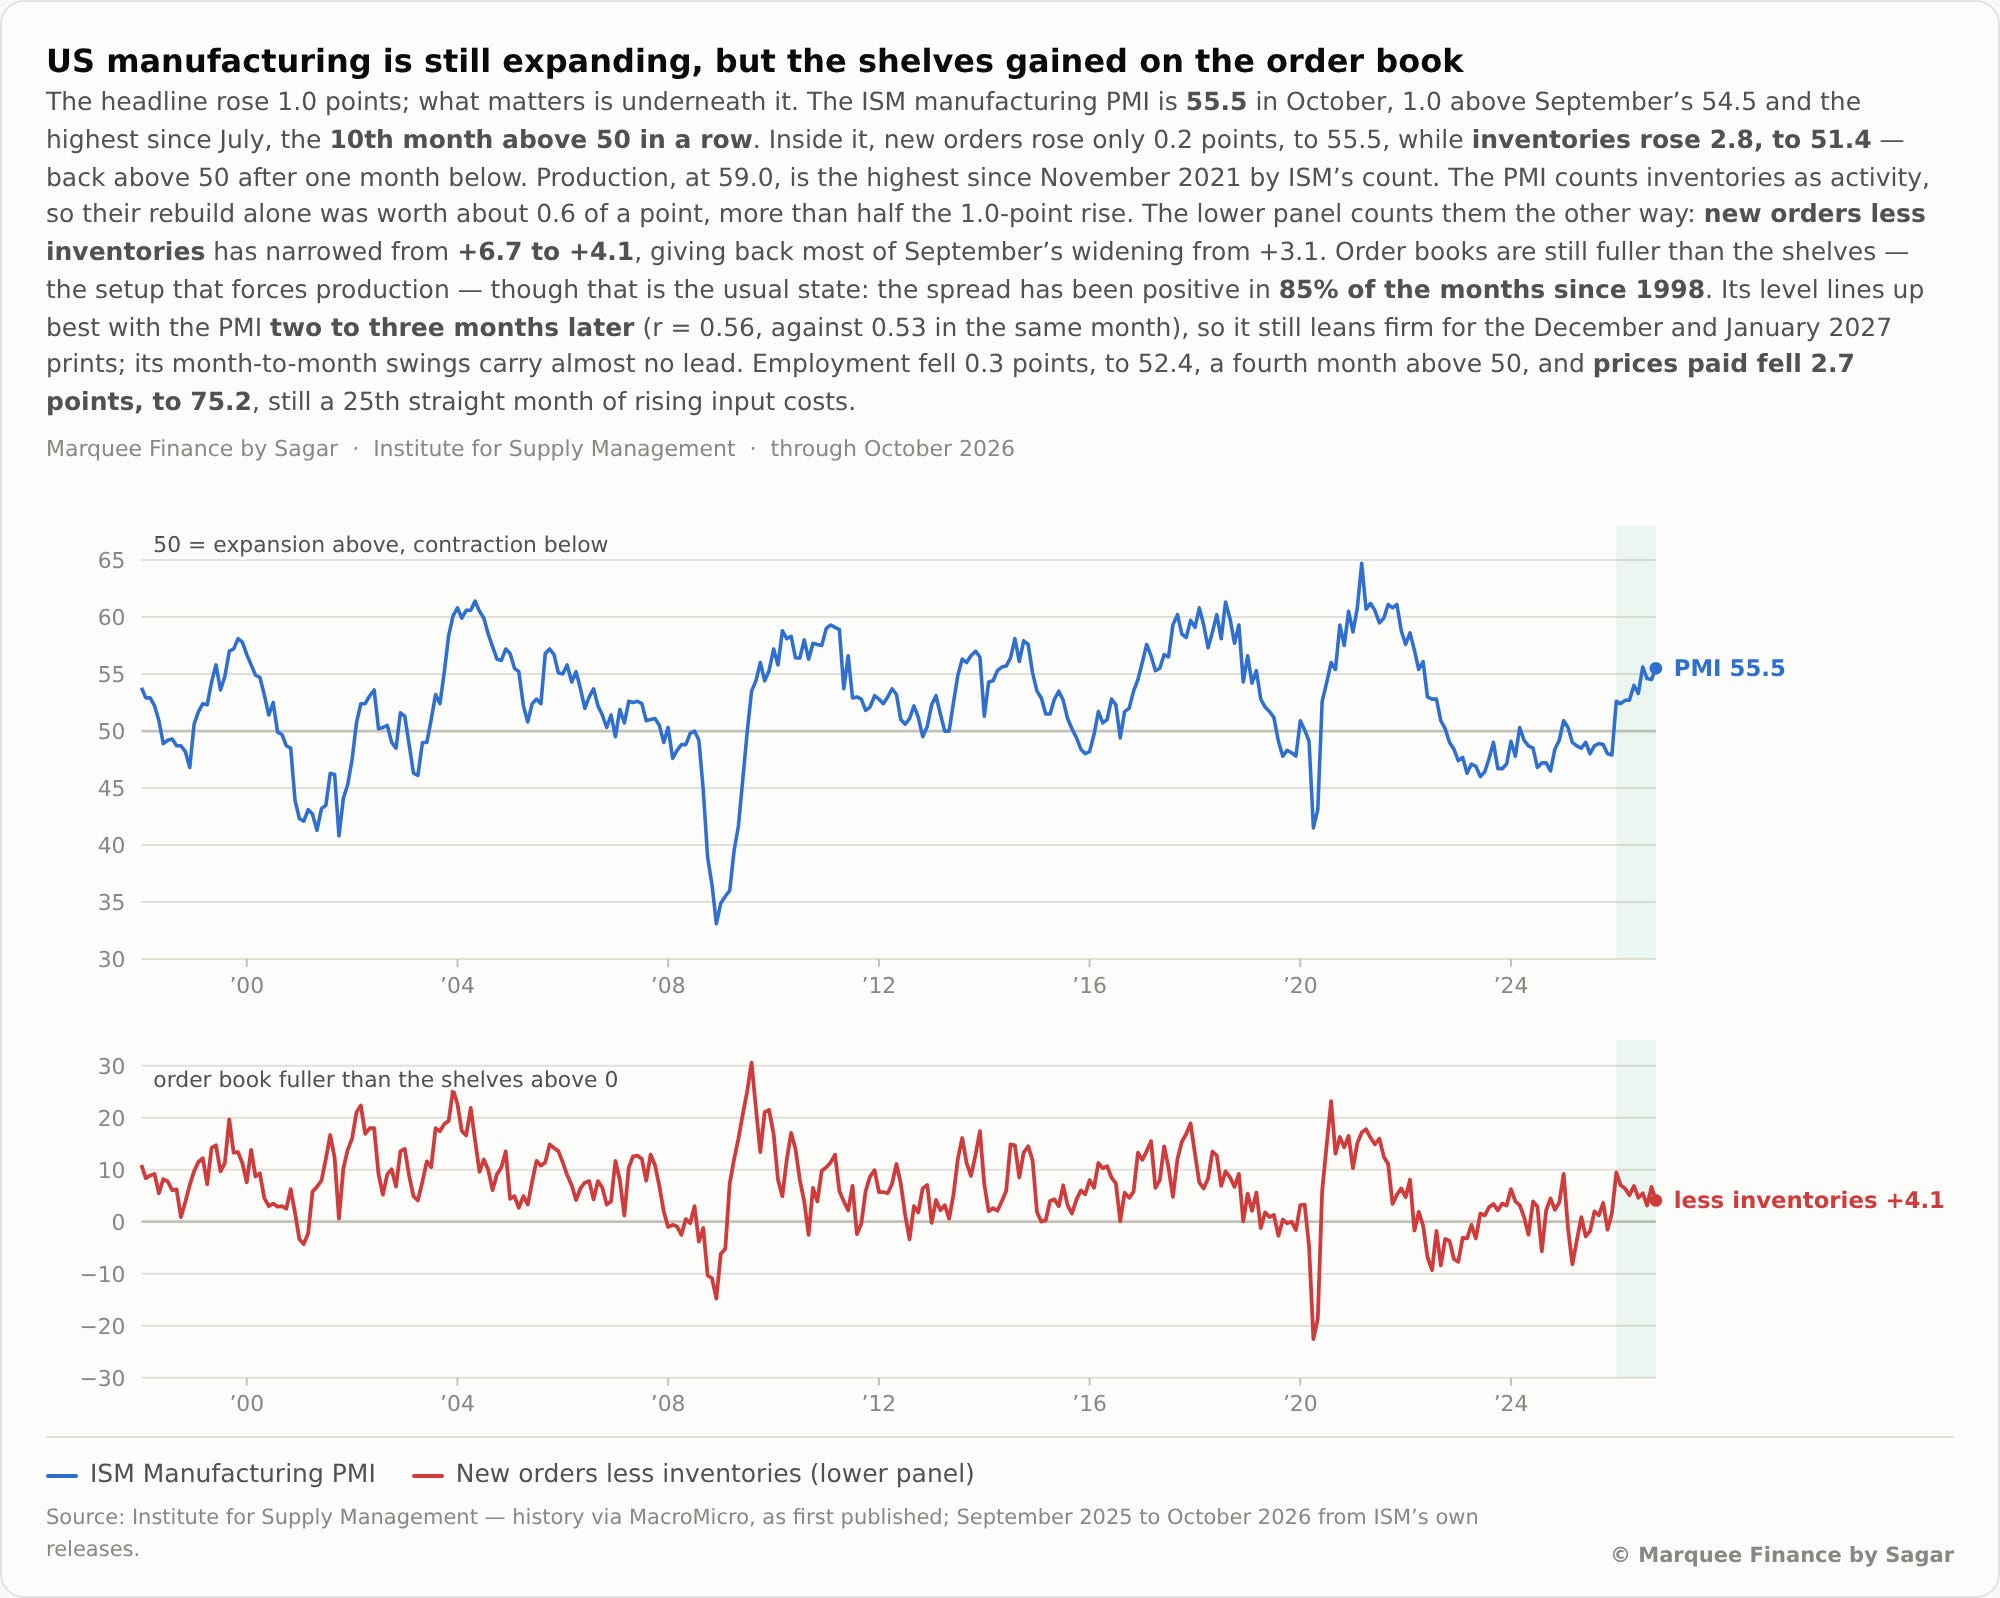
New Orders Less Inventories suggests we may have seen an interim top in ISM Manufacturing.
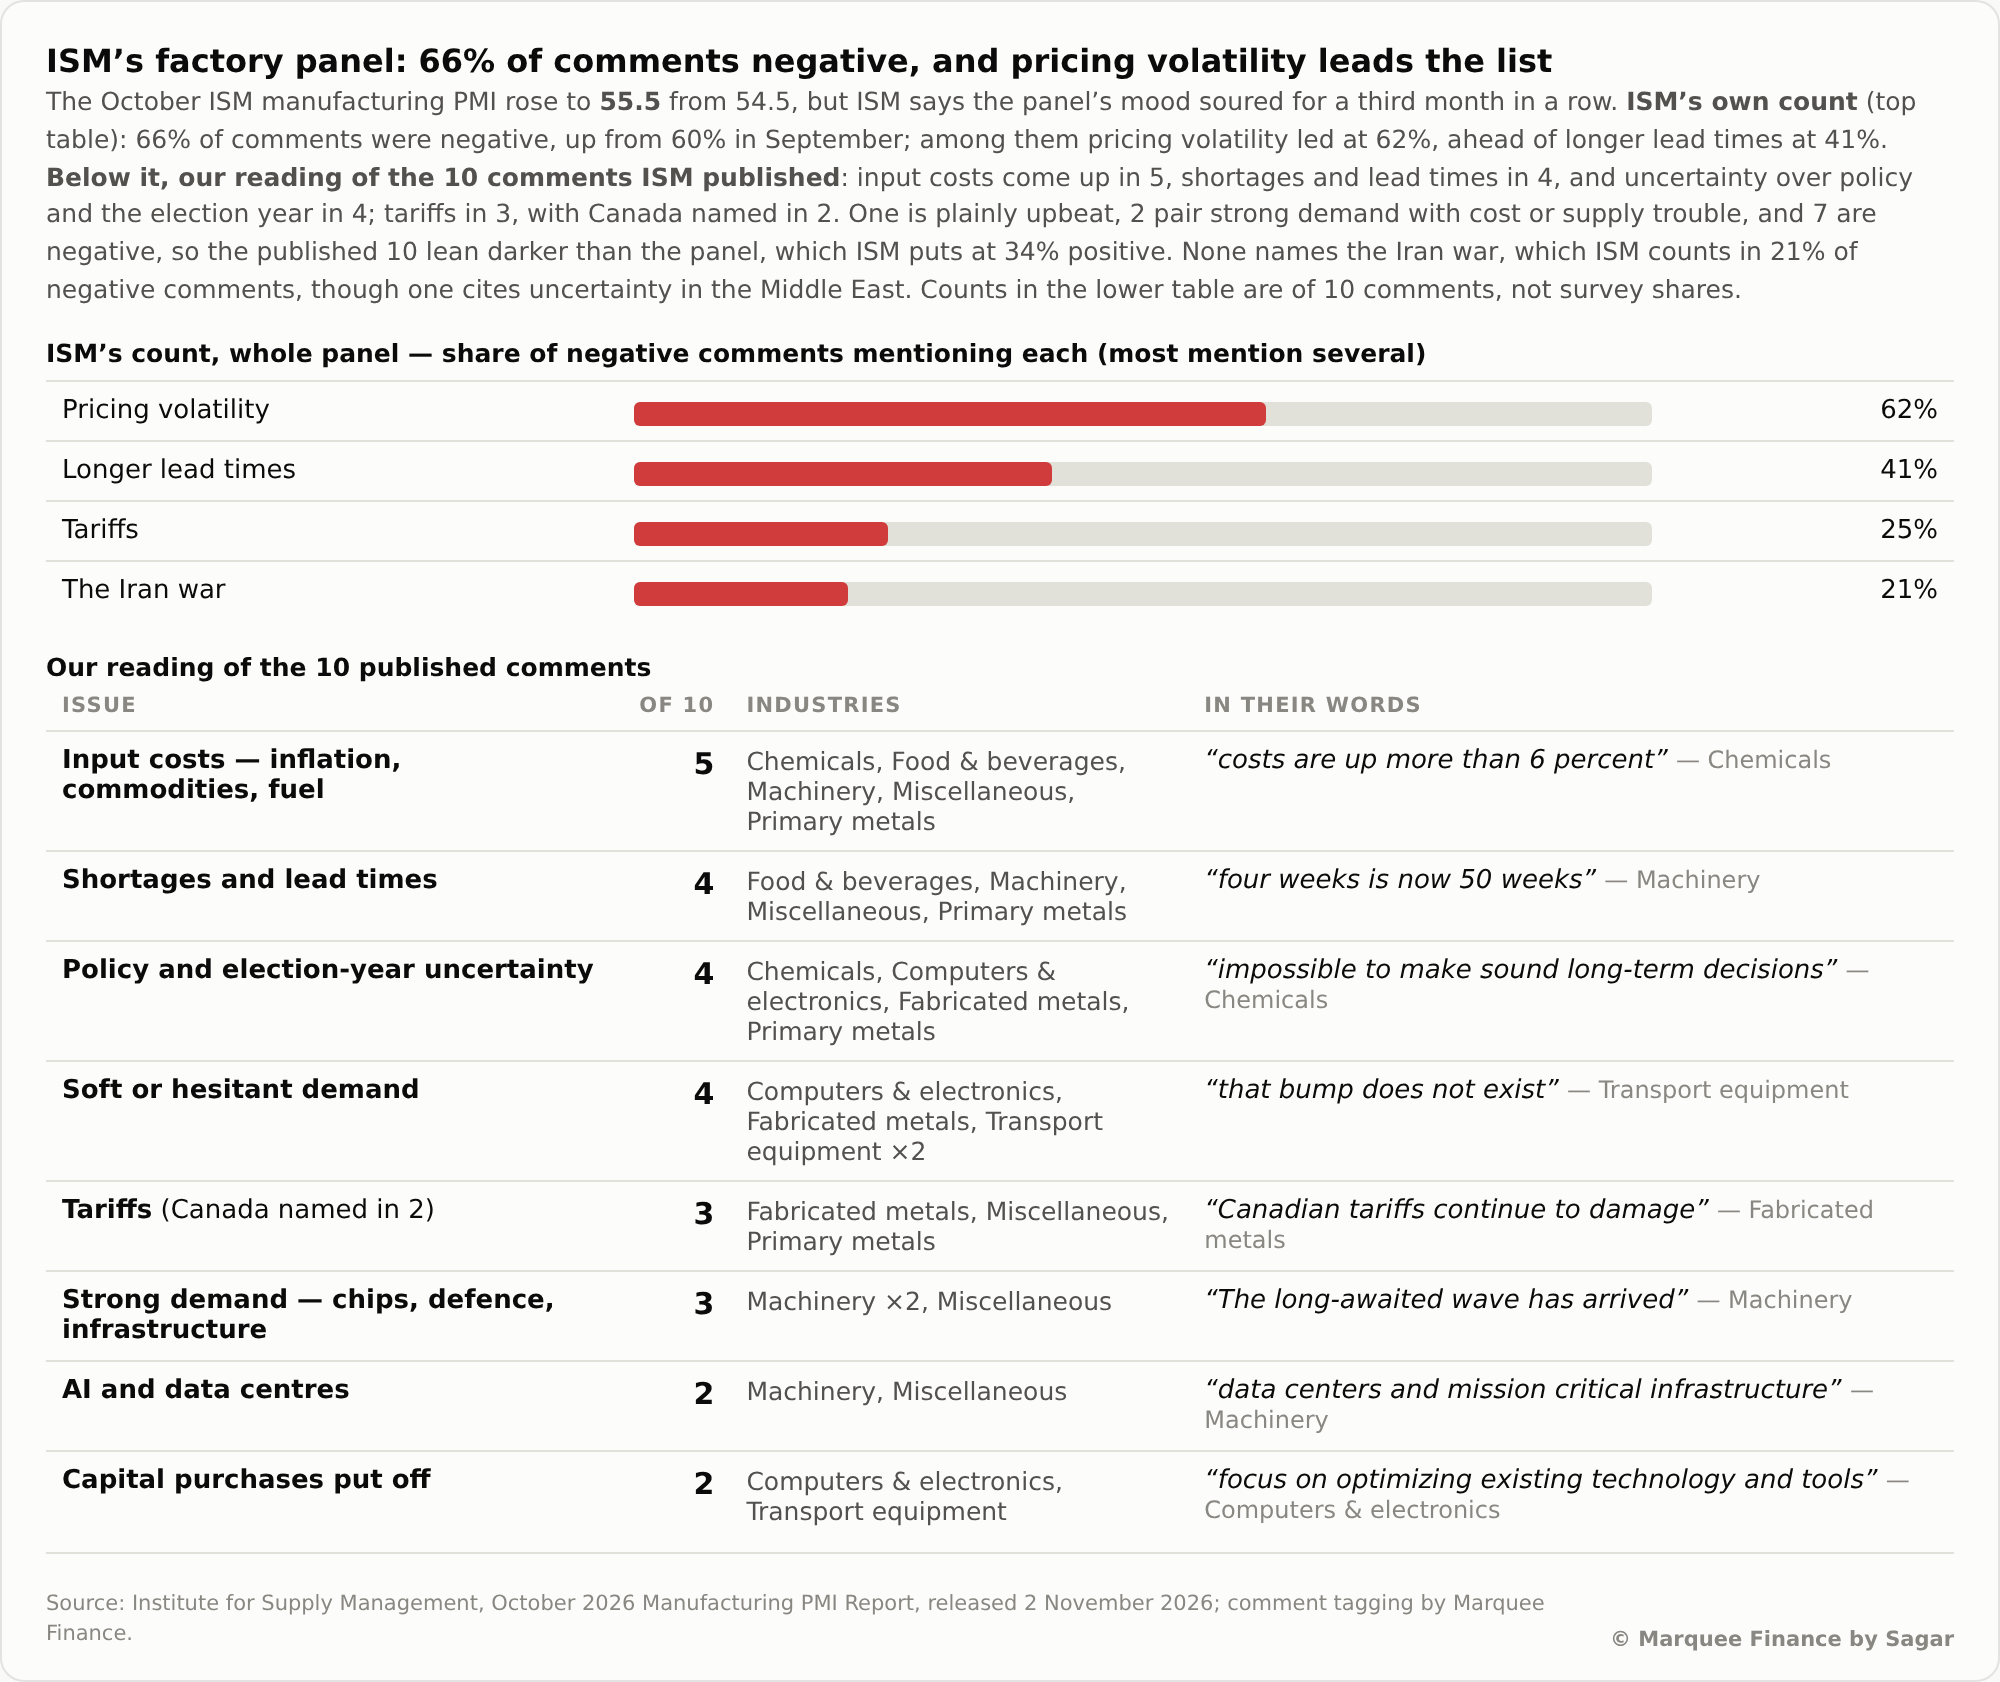
When we analyse the comments, negative comments increased from 60% to 66% as respondents face multiple headwinds in their businesses.
Tariffs, policy uncertainty, inflation and shortages have begun hurting the manufacturing sector as the problems have compounded.
Furthermore, the prolonged disruption is evident even in the ISM Services Survey.
The survey also shows that “more pricing pressure is on the way”, as firms are expected to pass costs on to consumers in the next few months.
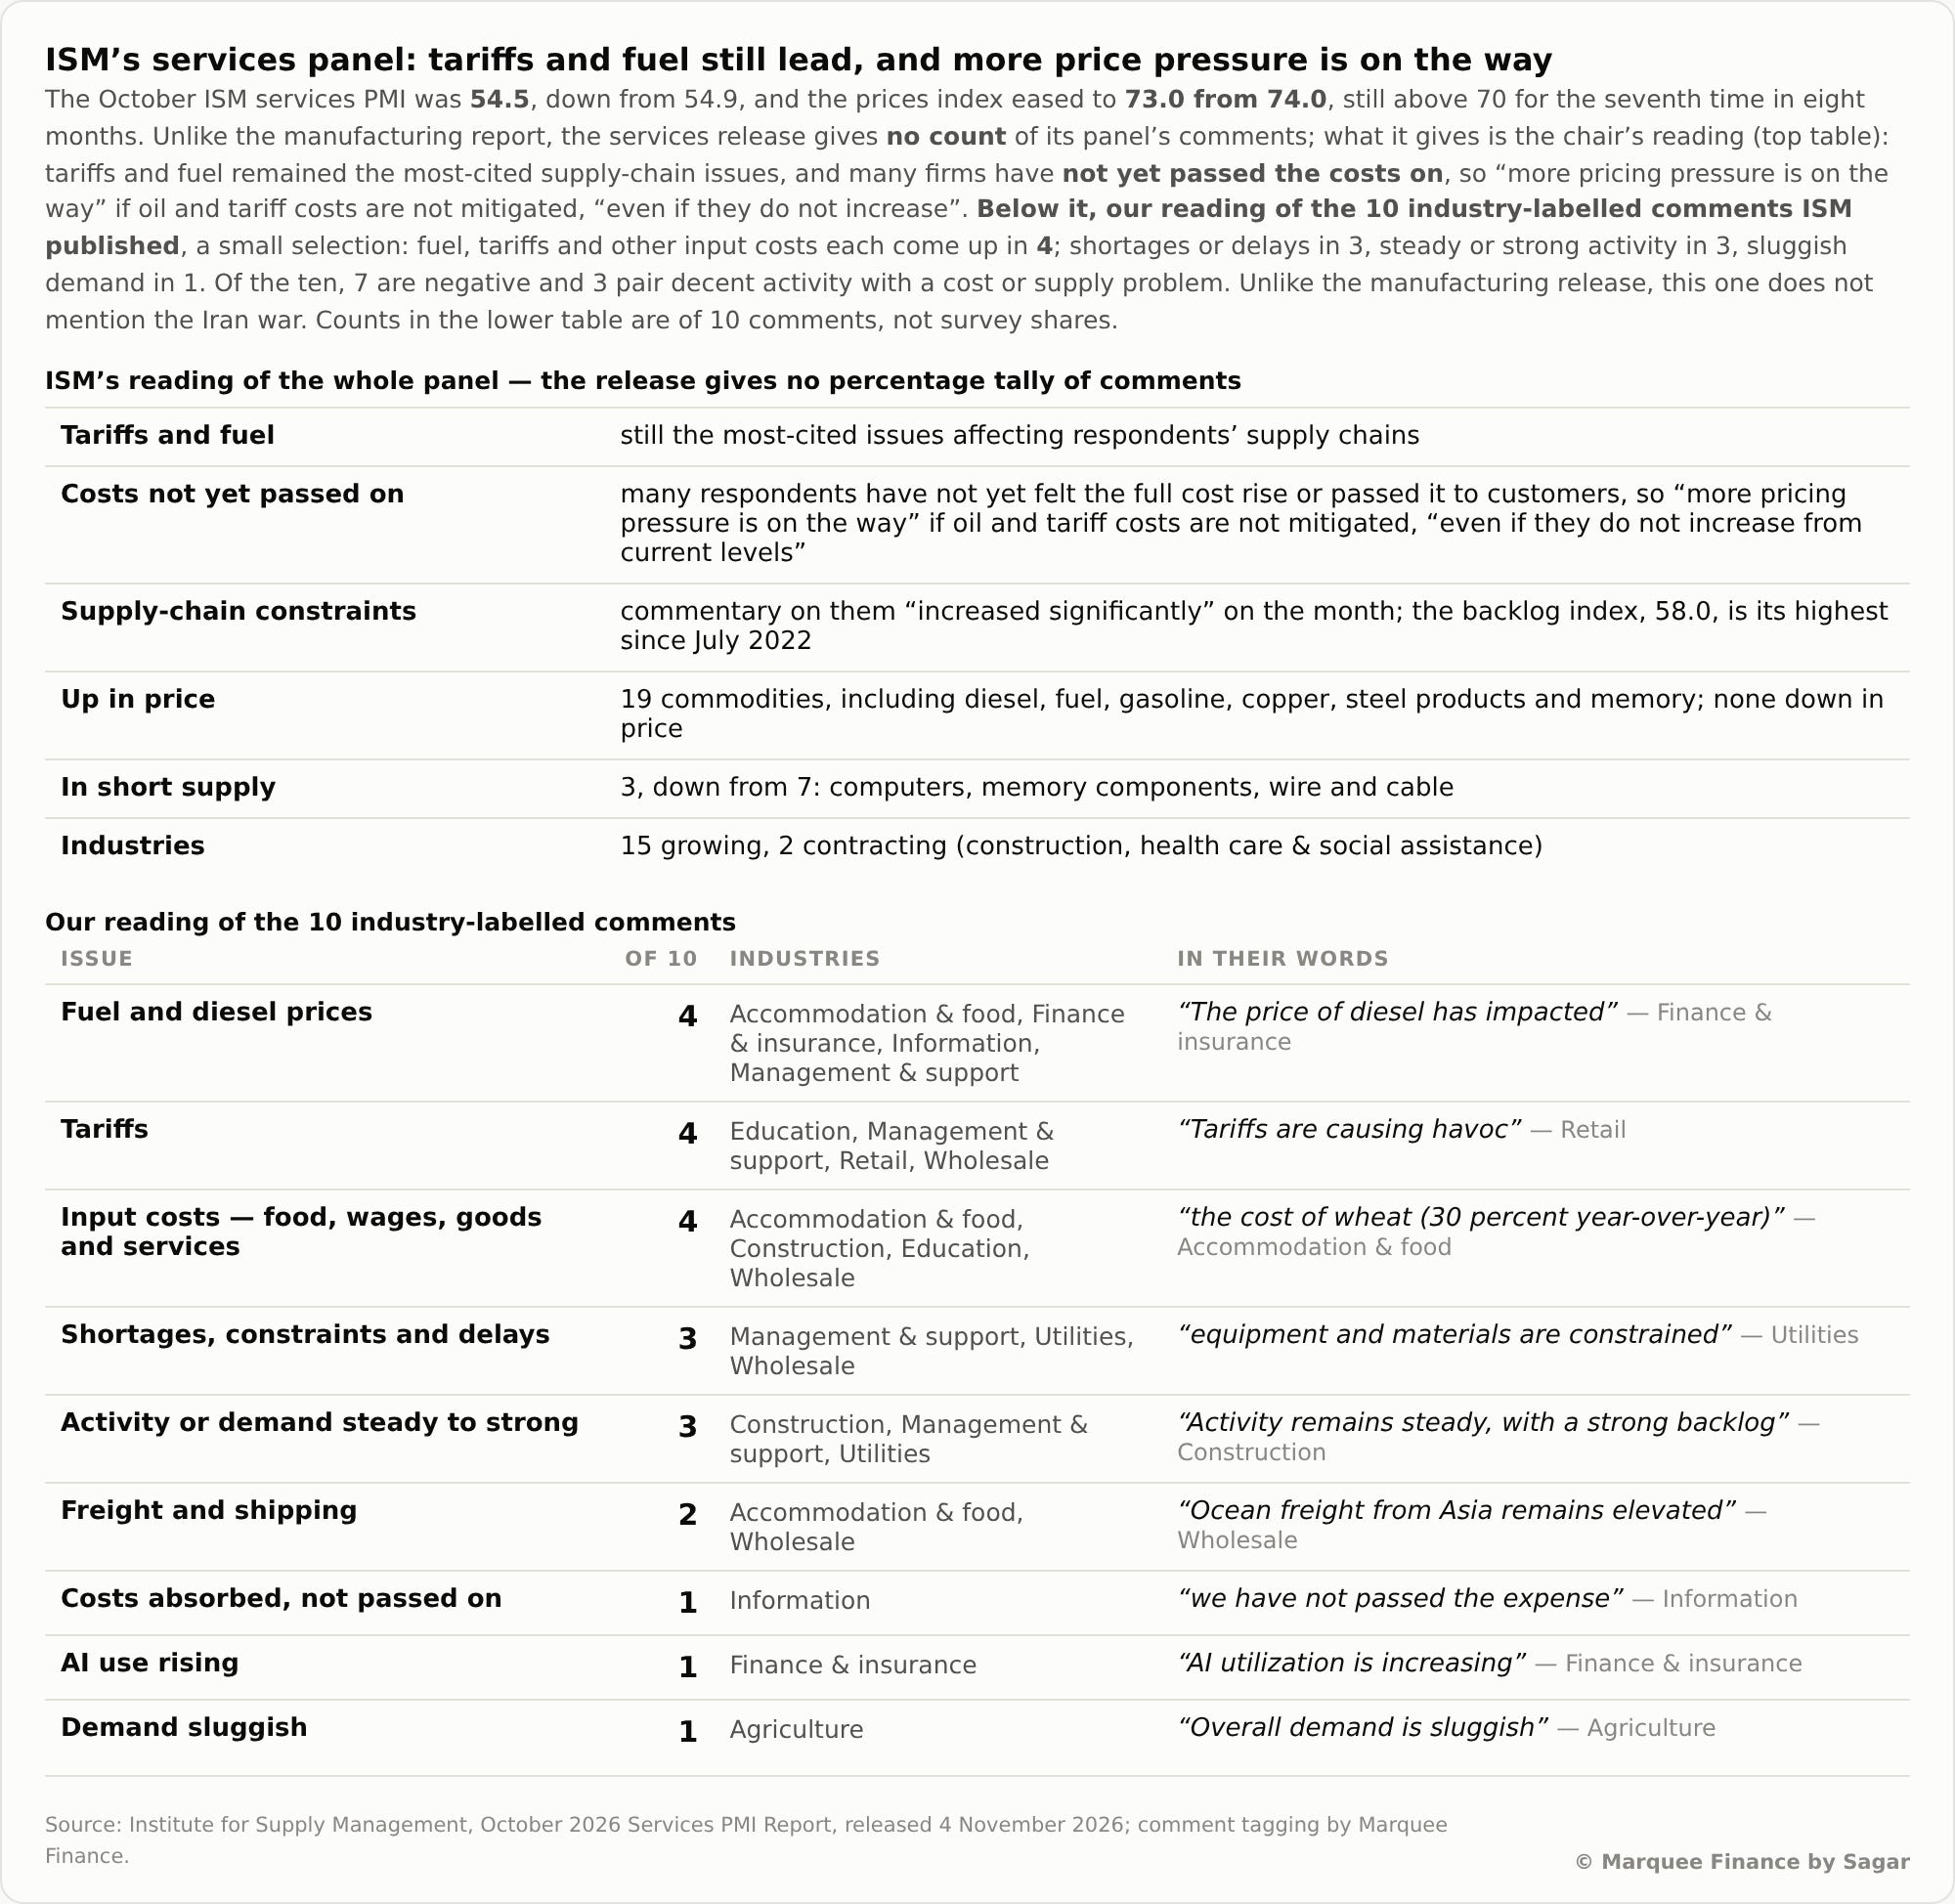
Sticky input price pressures are visible in the ISM Prices Paid across both manufacturing and services.
Interestingly, ISM Services Prices Paid has been above 70 in seven of the last eight months, while ISM Manufacturing Prices Paid has risen for 25 consecutive months.
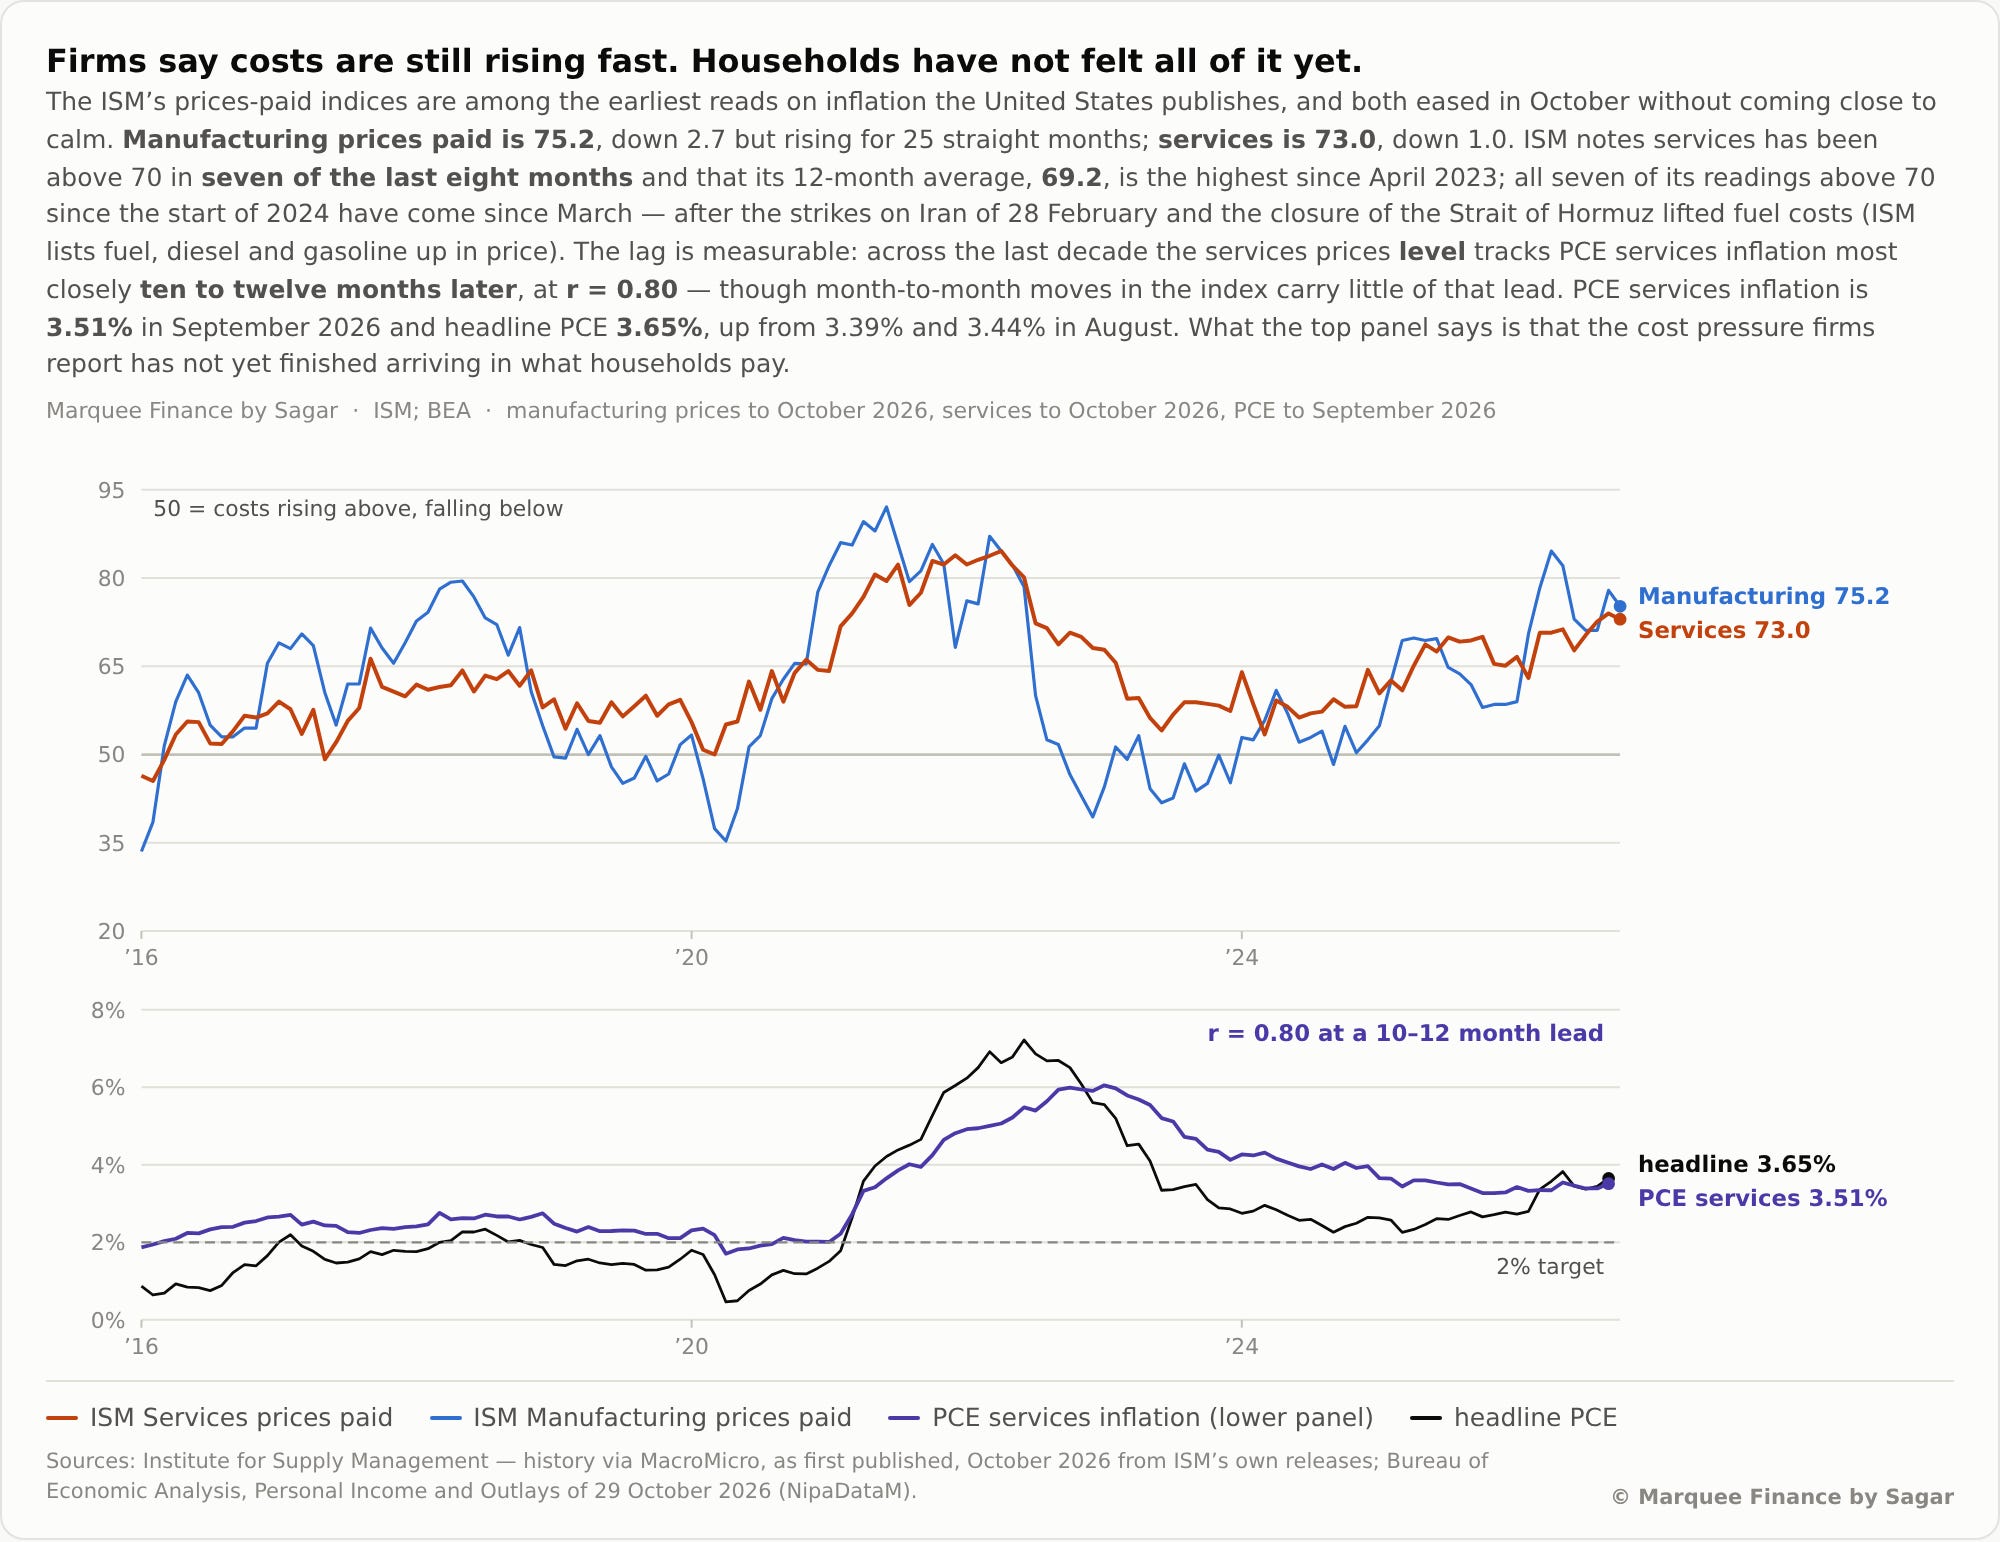
Given the tight correlation between PCE and ISM Services Prices Paid, we expect higher inflation readings in the coming months.
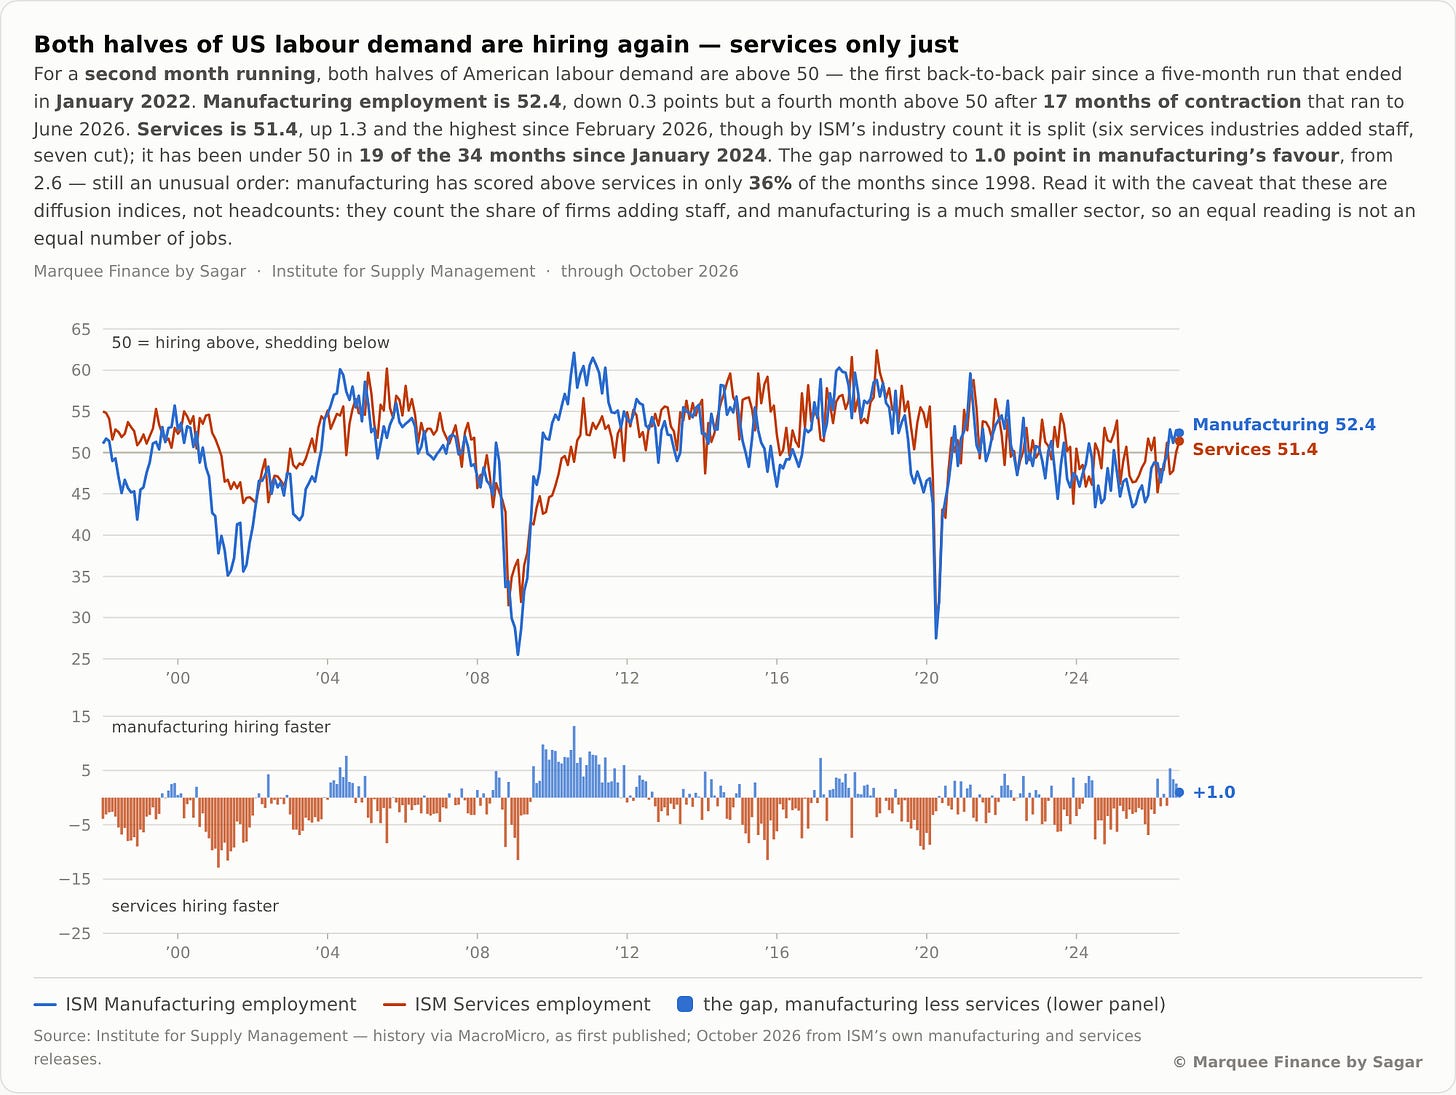
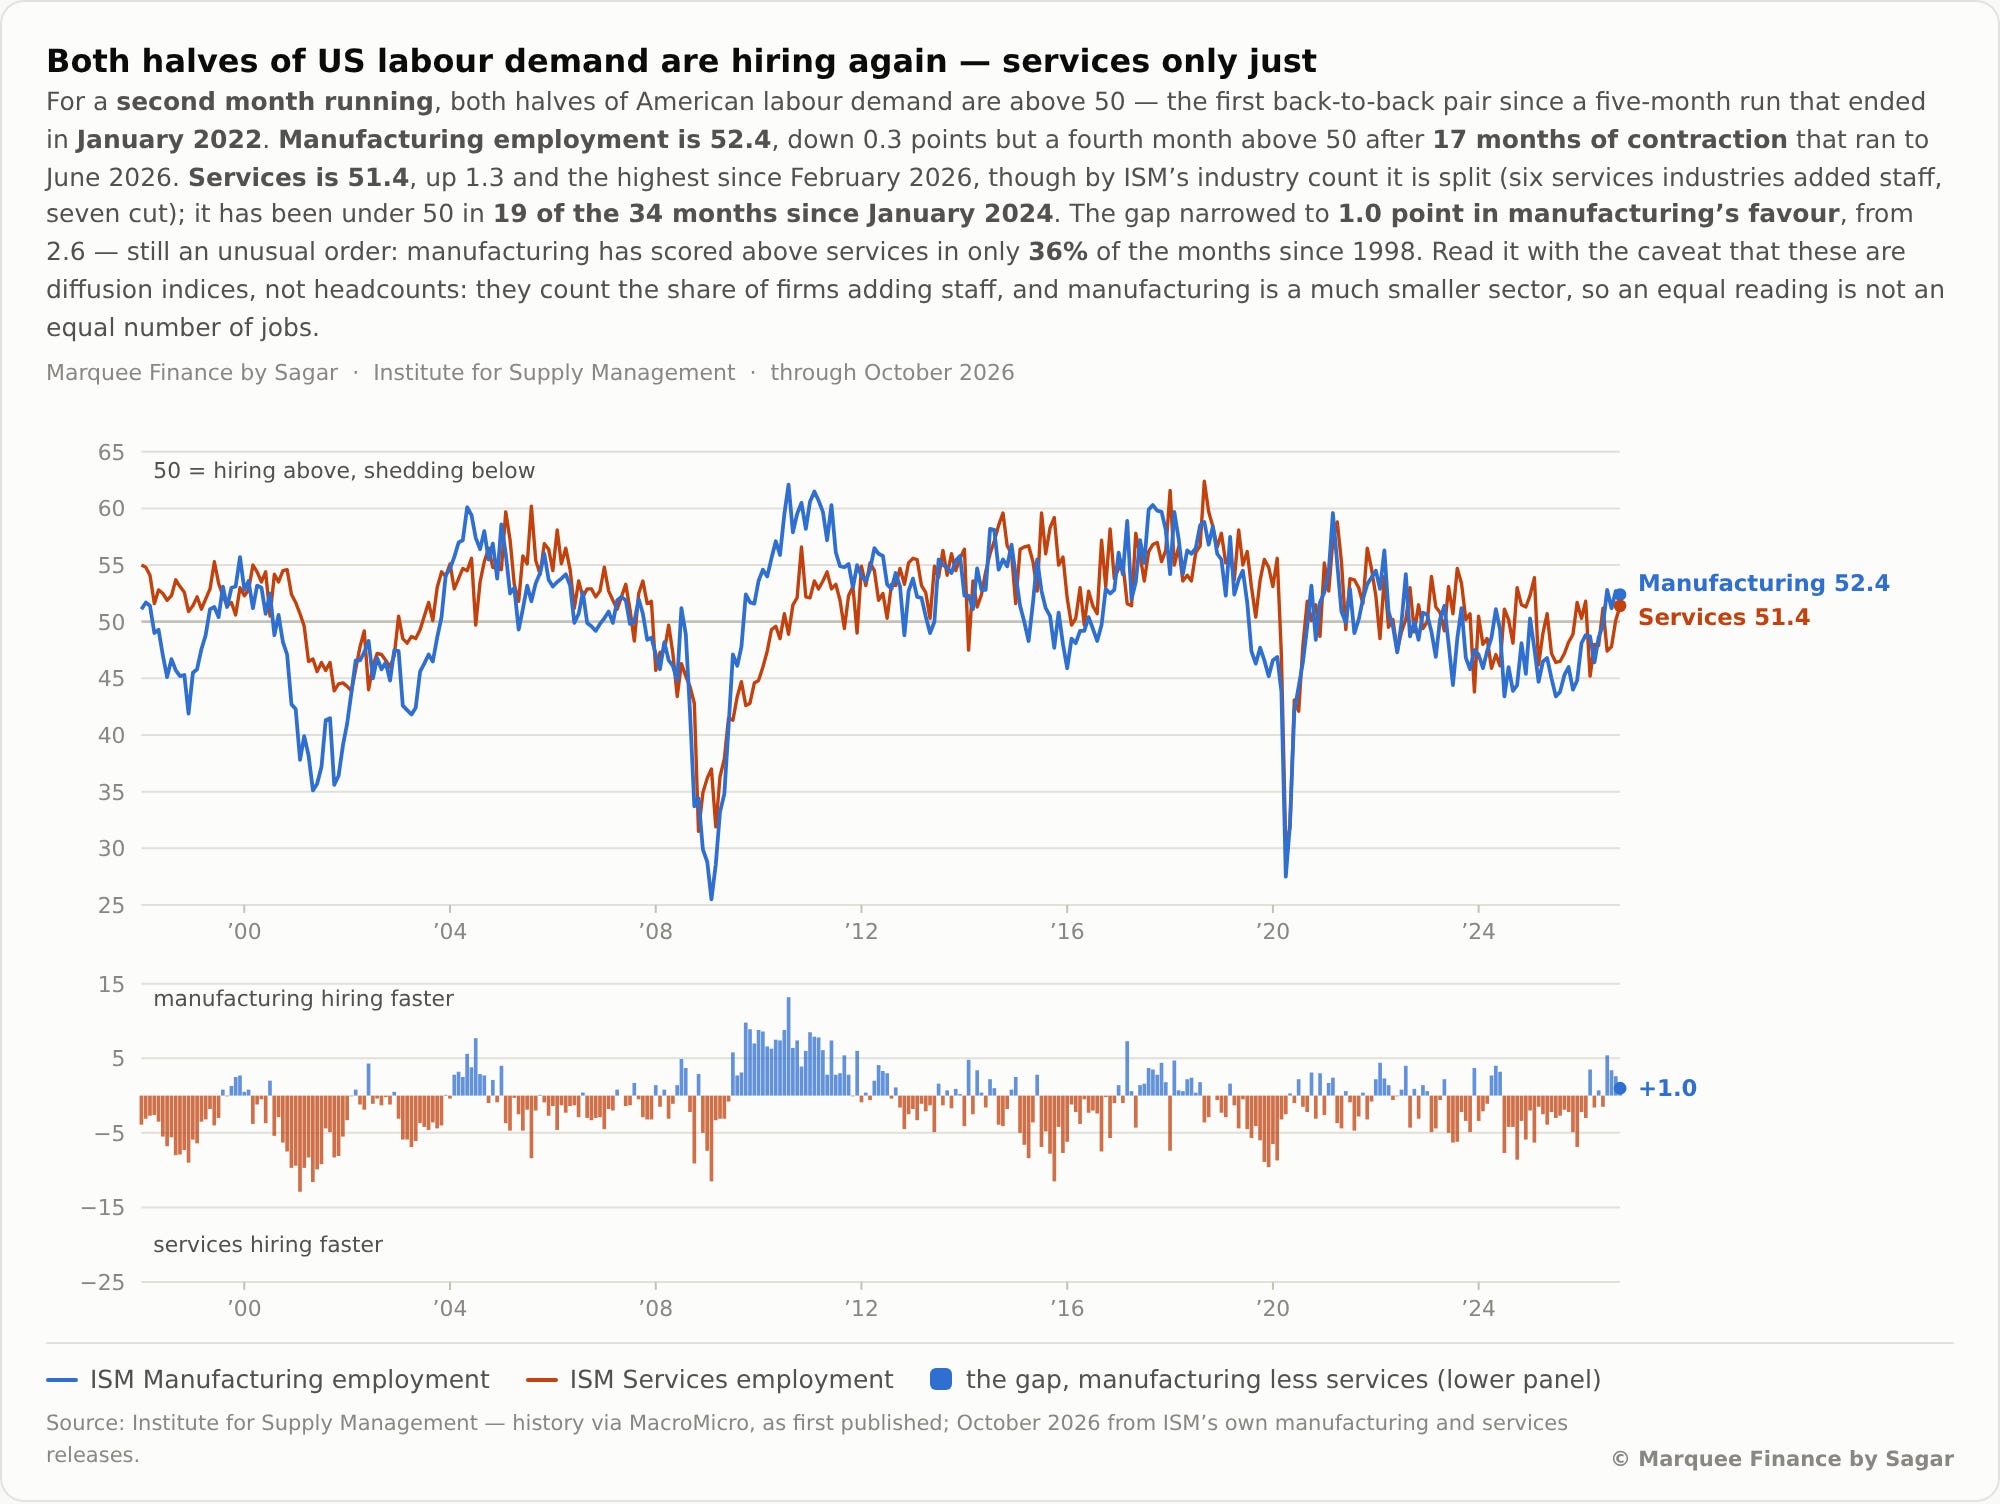
Turning to the labour market, the ISM report showed encouraging signs.
Both Manufacturing and Services Employment PMIs came in above 50 and in the expansion zone.
Manufacturing has been a winner due to the AI rollout.
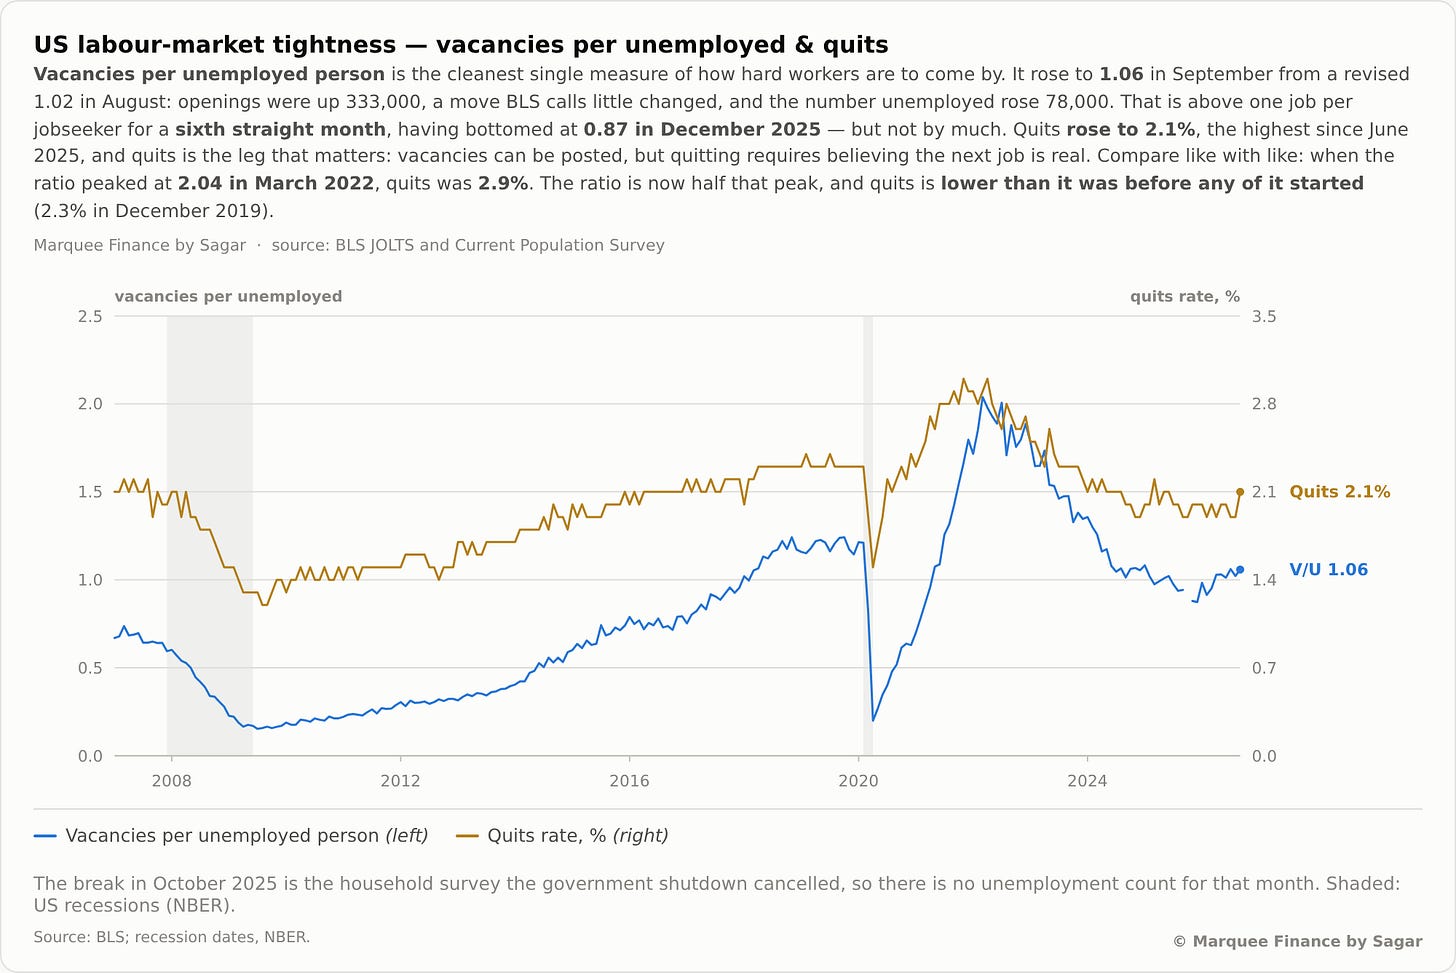
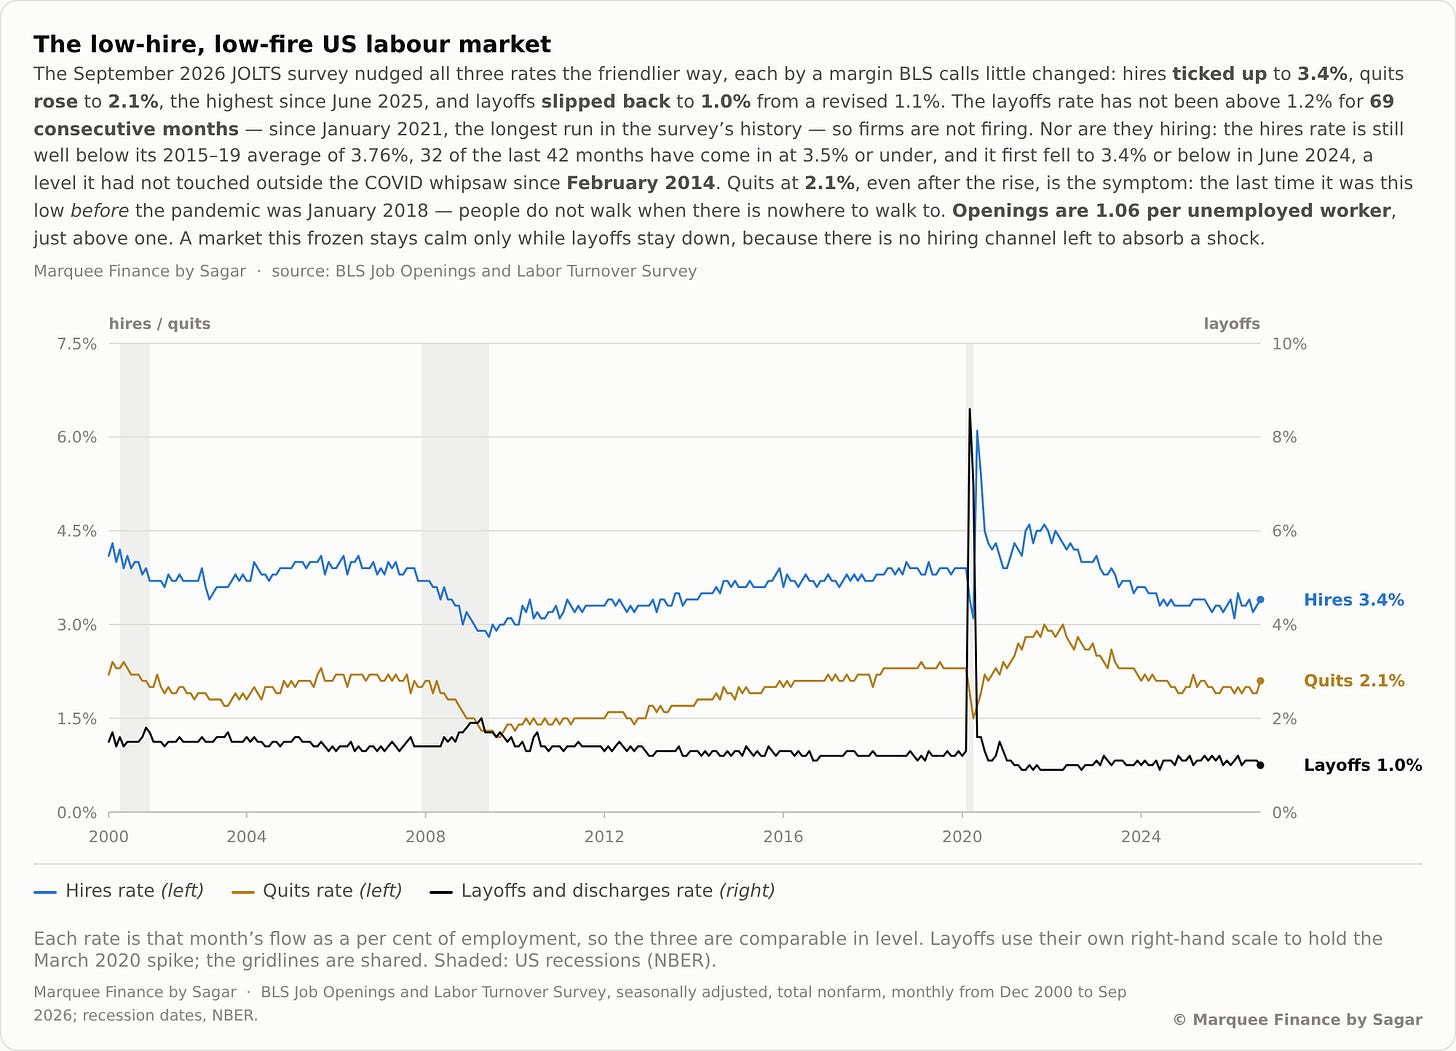
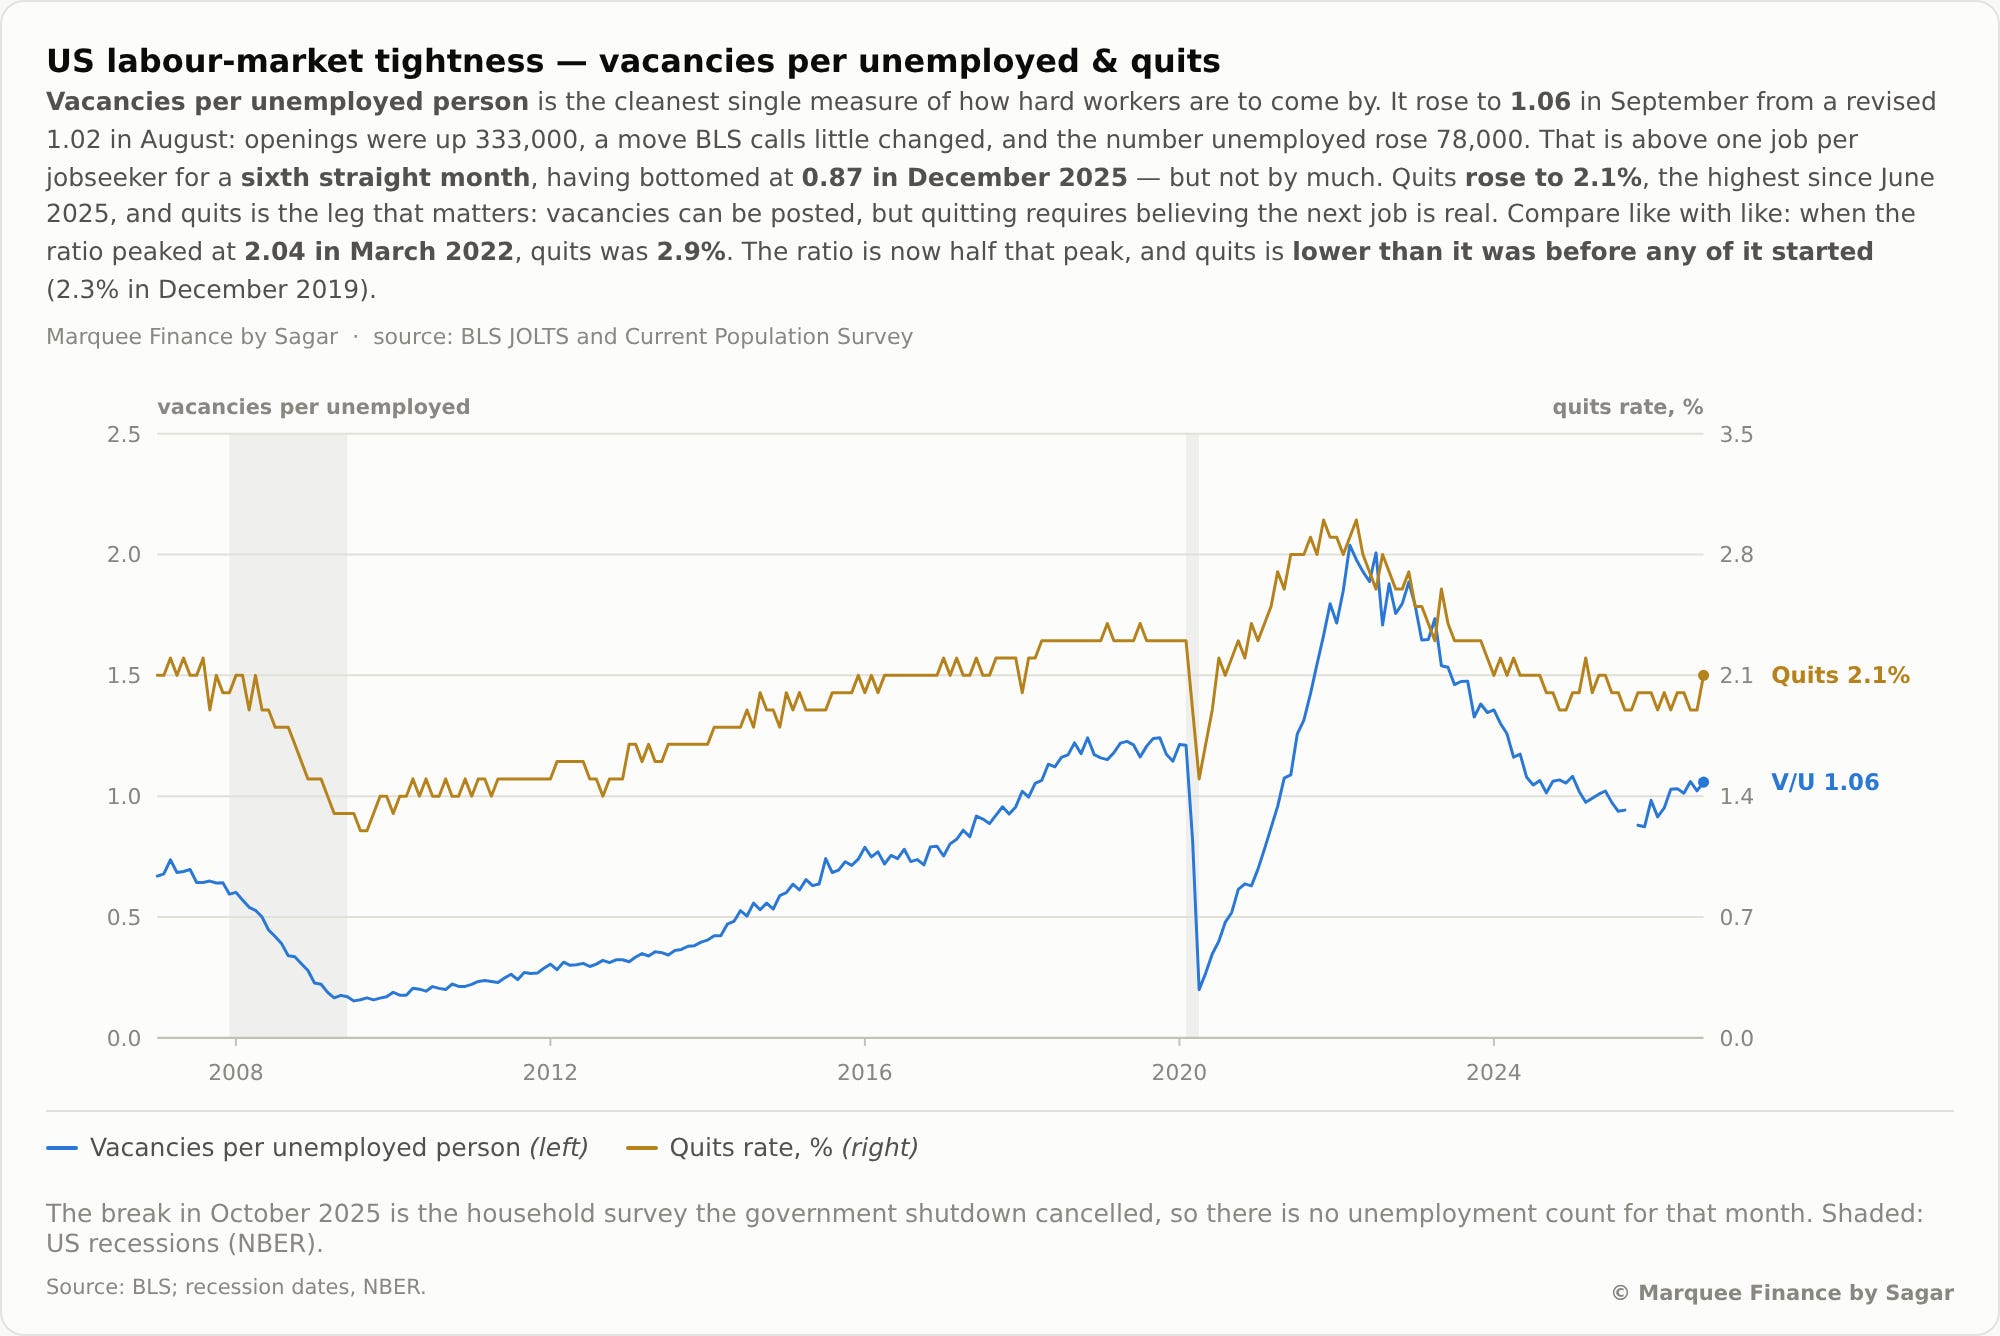
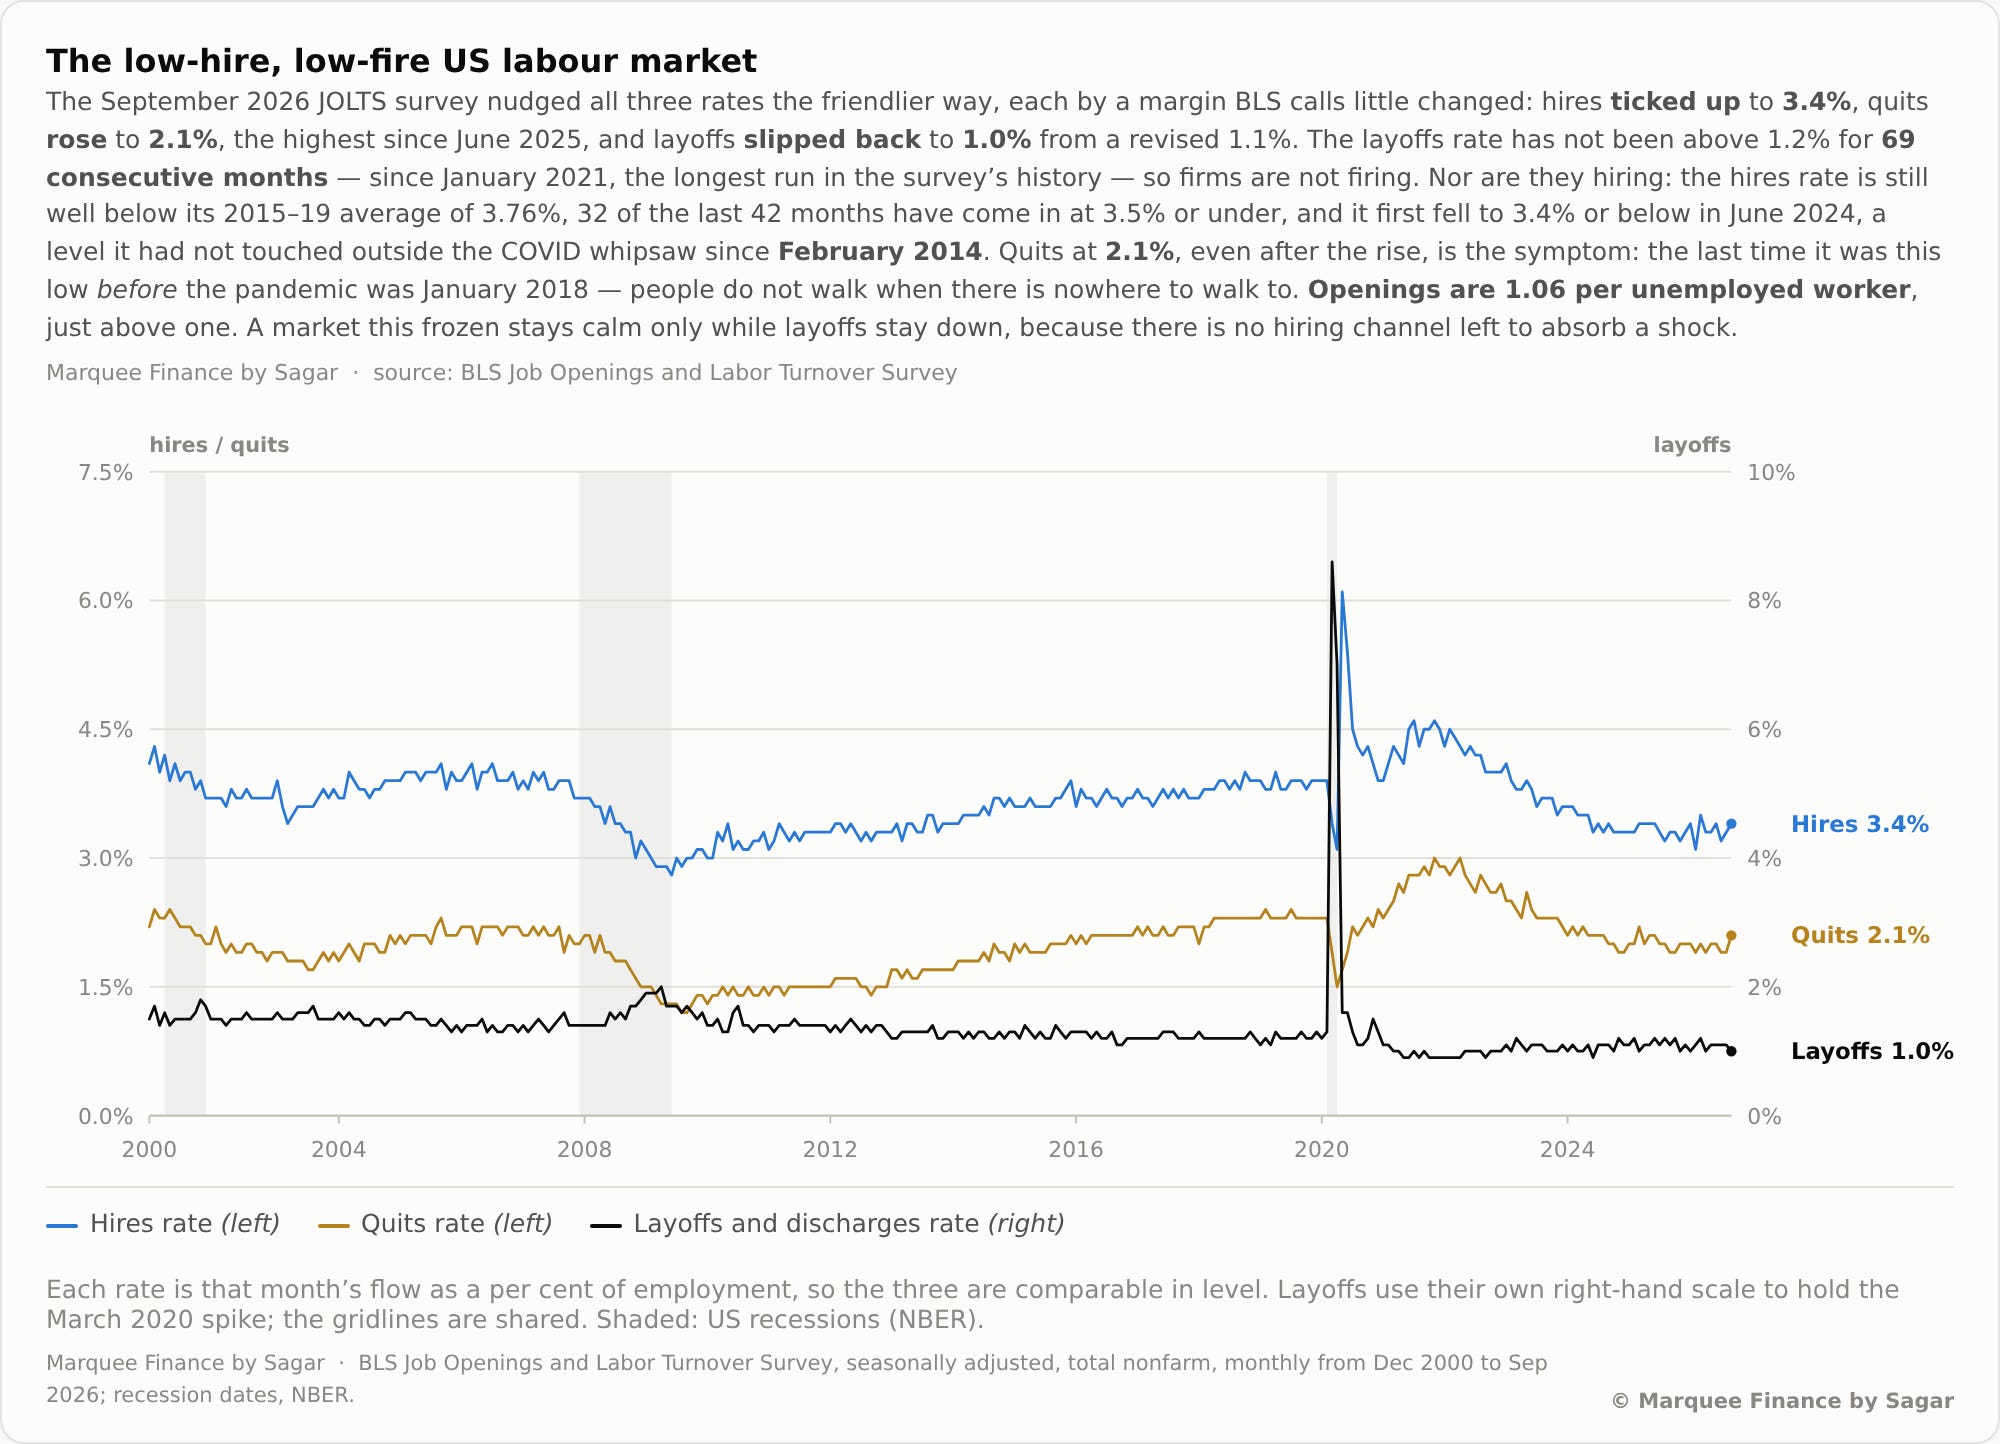
JOLTS-1: The JOLTS report showed more labour market recovery. Fed’s favourite labour market indicator- Vacancies/ Unemployed rose to 1.06, and interestingly, Quit Rates, which were subdued for the last 18 months, rose sharply to 2.1%, the highest since June 2025.
JOLTS-2: The labour market has been characterised as low-hire, low-fire due to low hires rate and negligible layoffs. Nonetheless, we saw a slight uptick in the hires rate to 3.4%, while the layoff rate plunged to 1%. If the “TREND” continues, we can expect further tightening of the labour market.
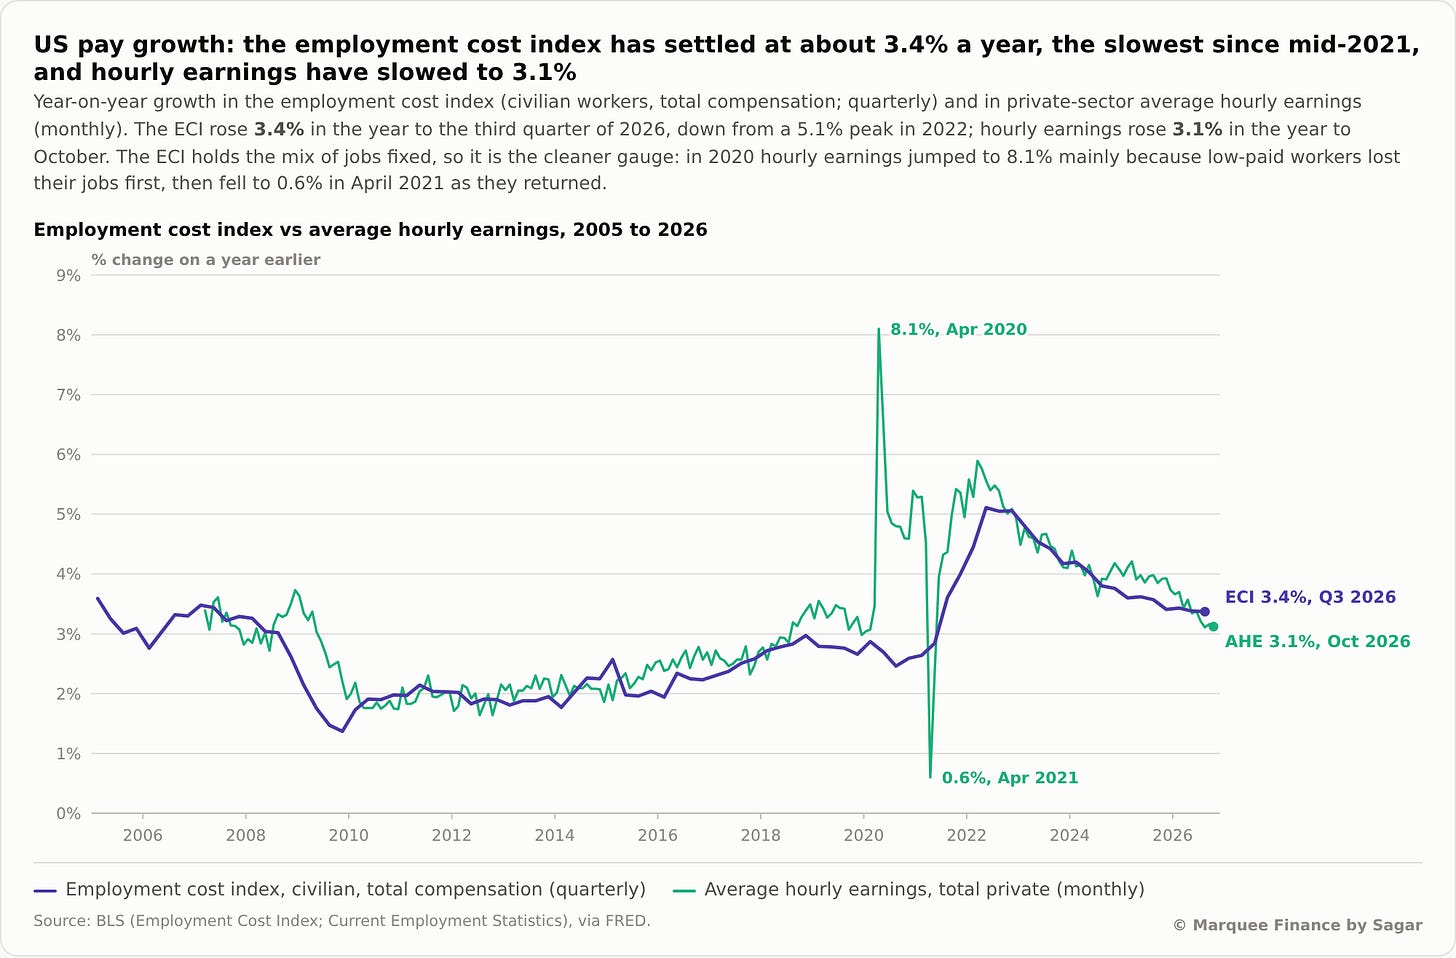
Employment Cost Index (ECI): ECI is one of the favourite labour market indicators among most Wall Street economists. The ECI has settled around 3.4%, while Average Hourly Earnings (AHE) has hit a post-COVID low of 3.1%. With inflation running higher, real wages are on the verge of turning negative, which will further hurt lower-income households.
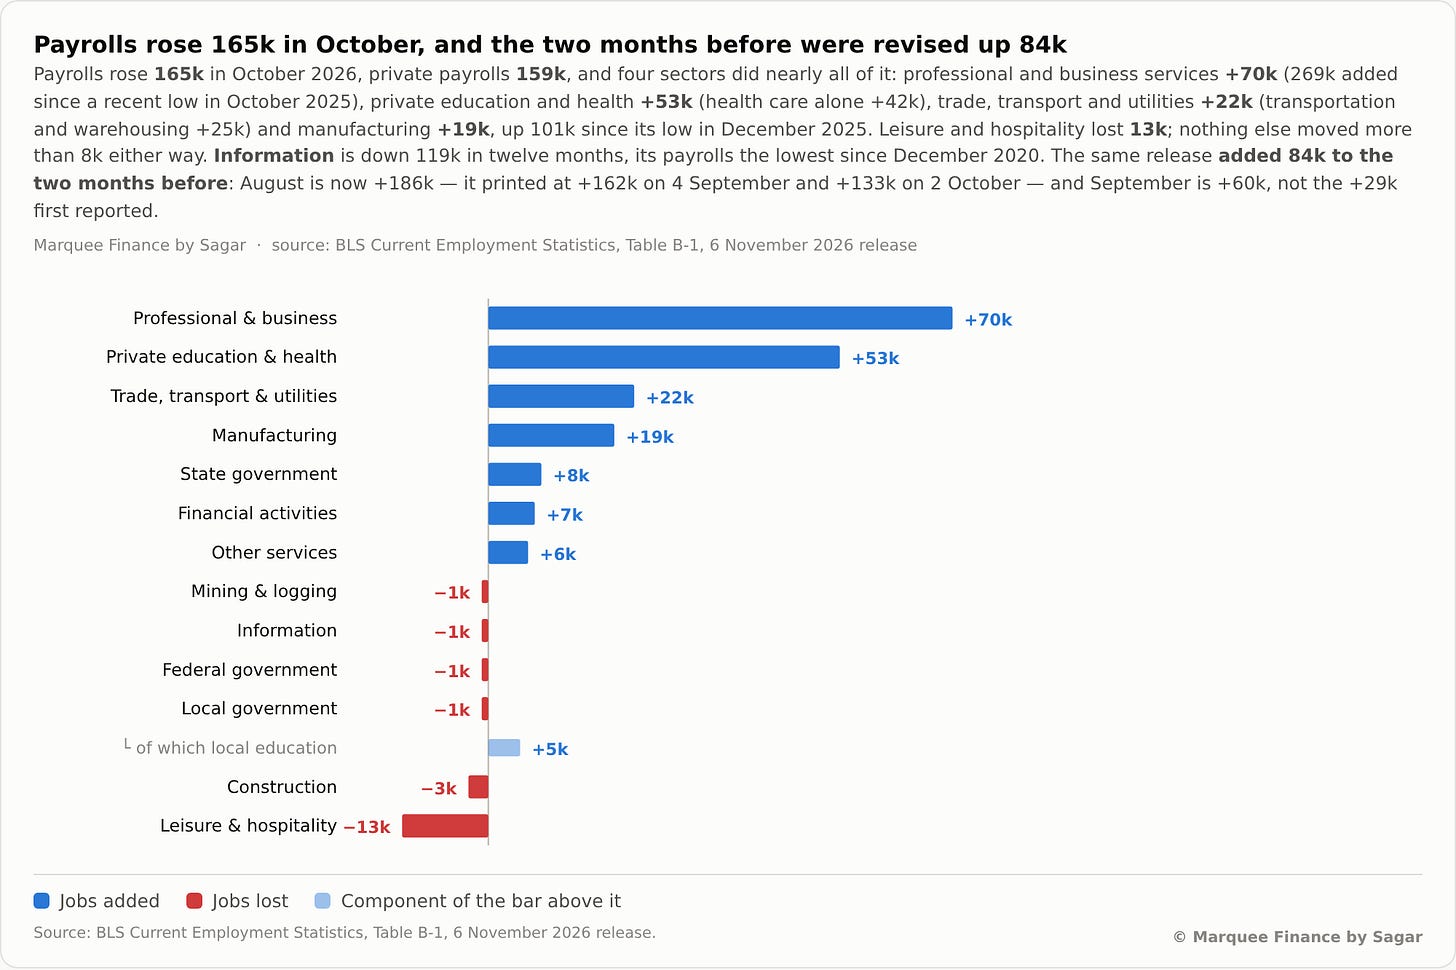
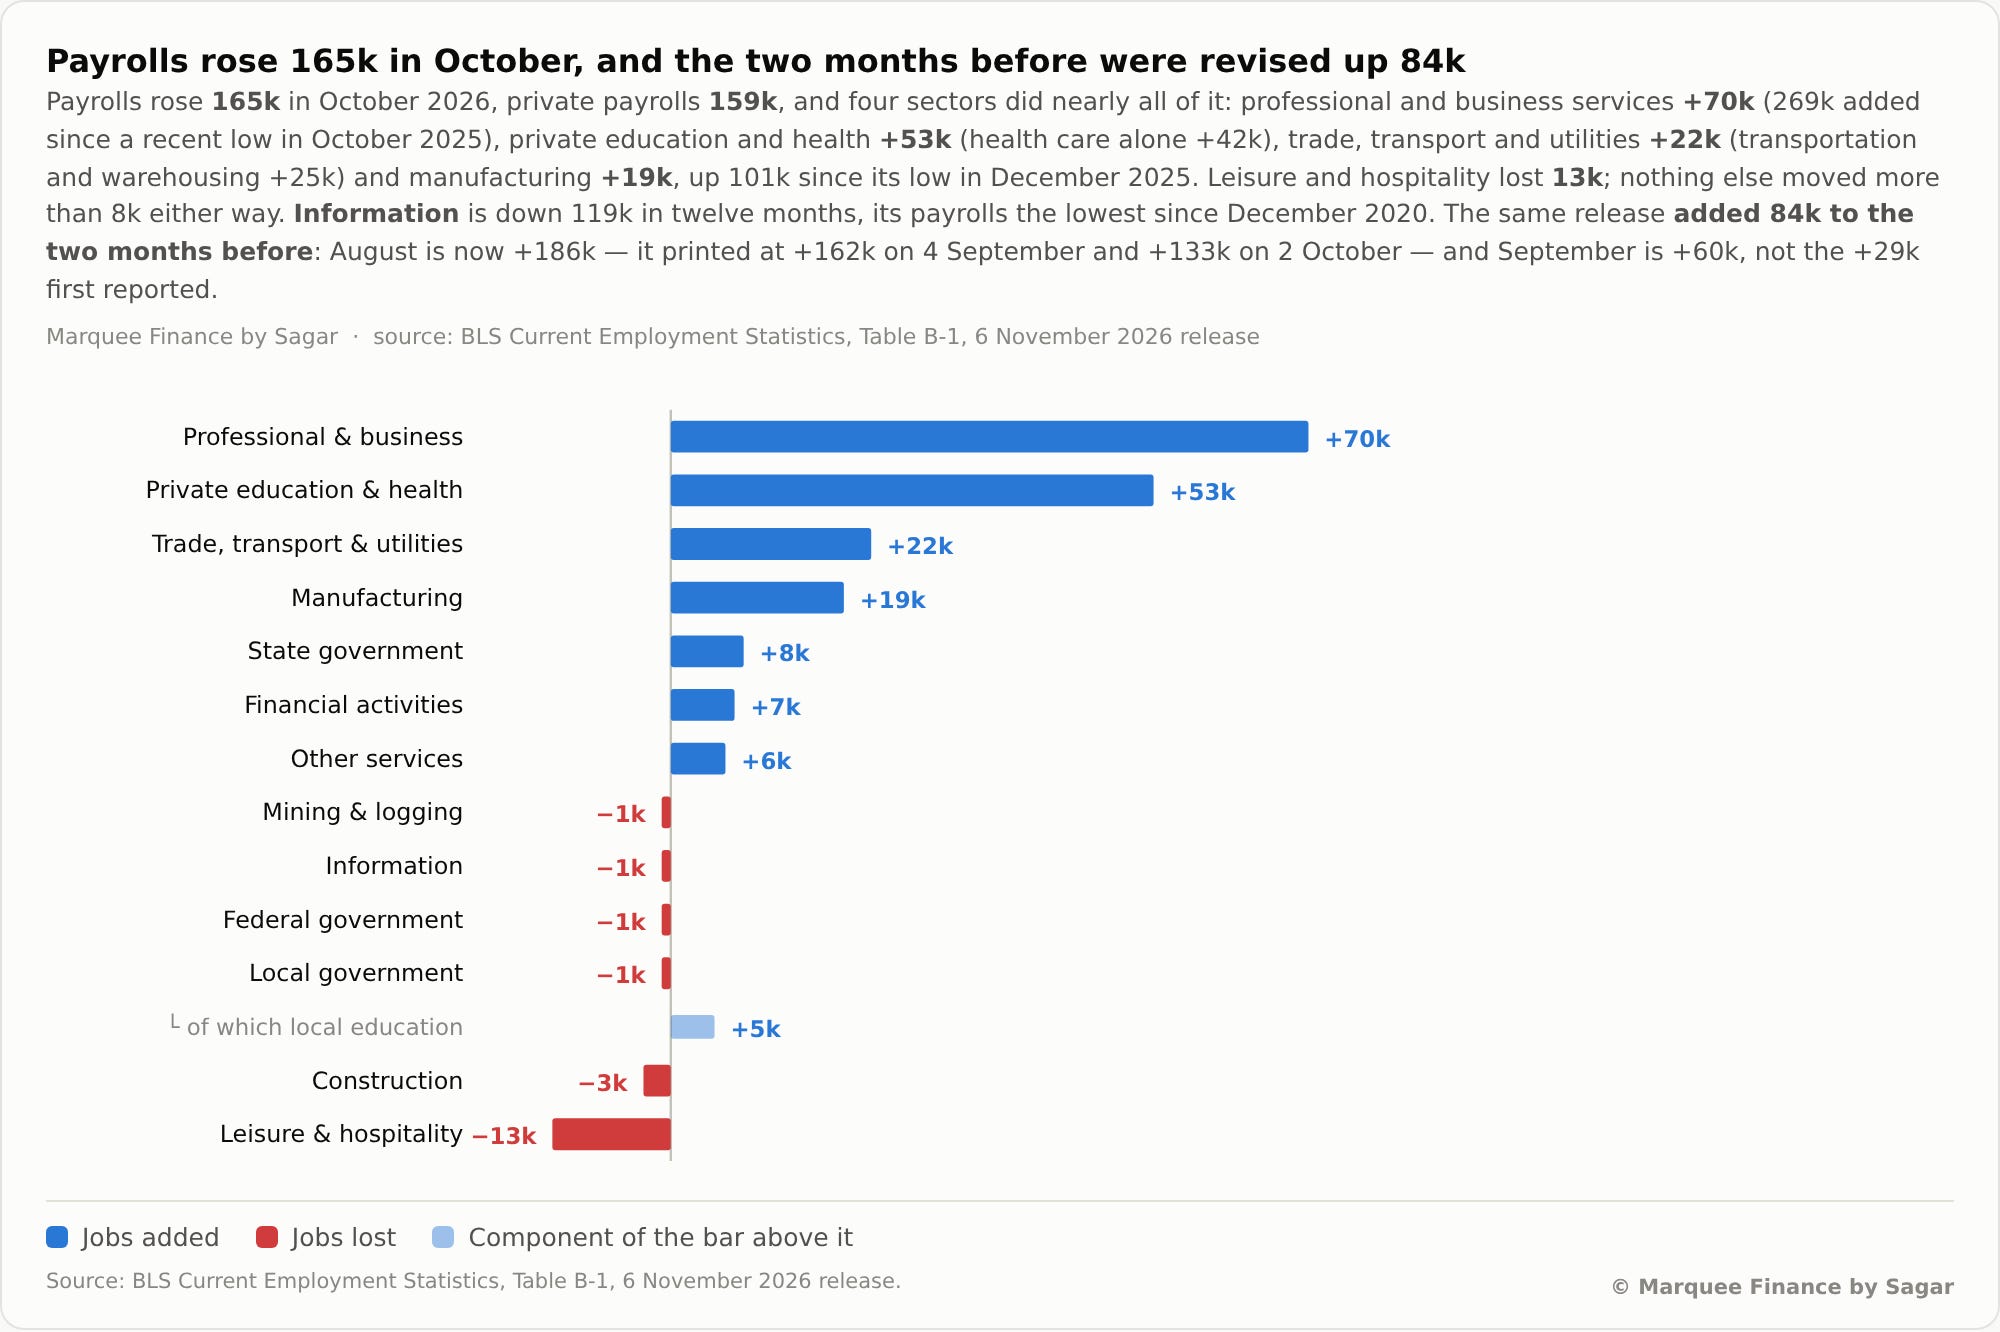
NFP-1: Non-Farm Payrolls delivered a huge beat as the US economy added 165k jobs in October. Professional and business services added an enormous 70k jobs, while education and health continues to be the biggest job generator in the US for more than 3 years now. Thanks to the AI rollout, manufacturing jobs have witnessed a V-shaped recovery.
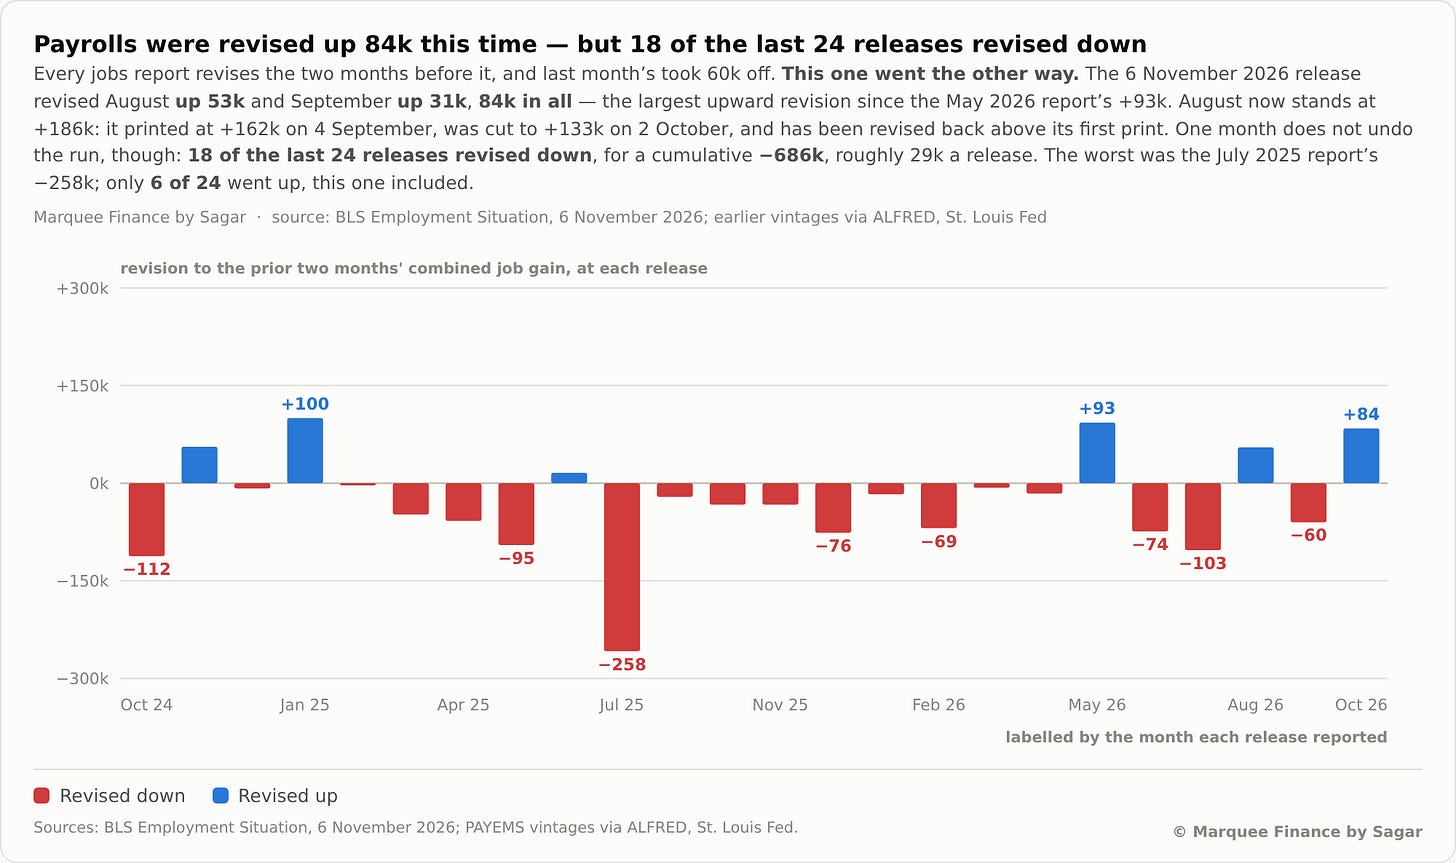
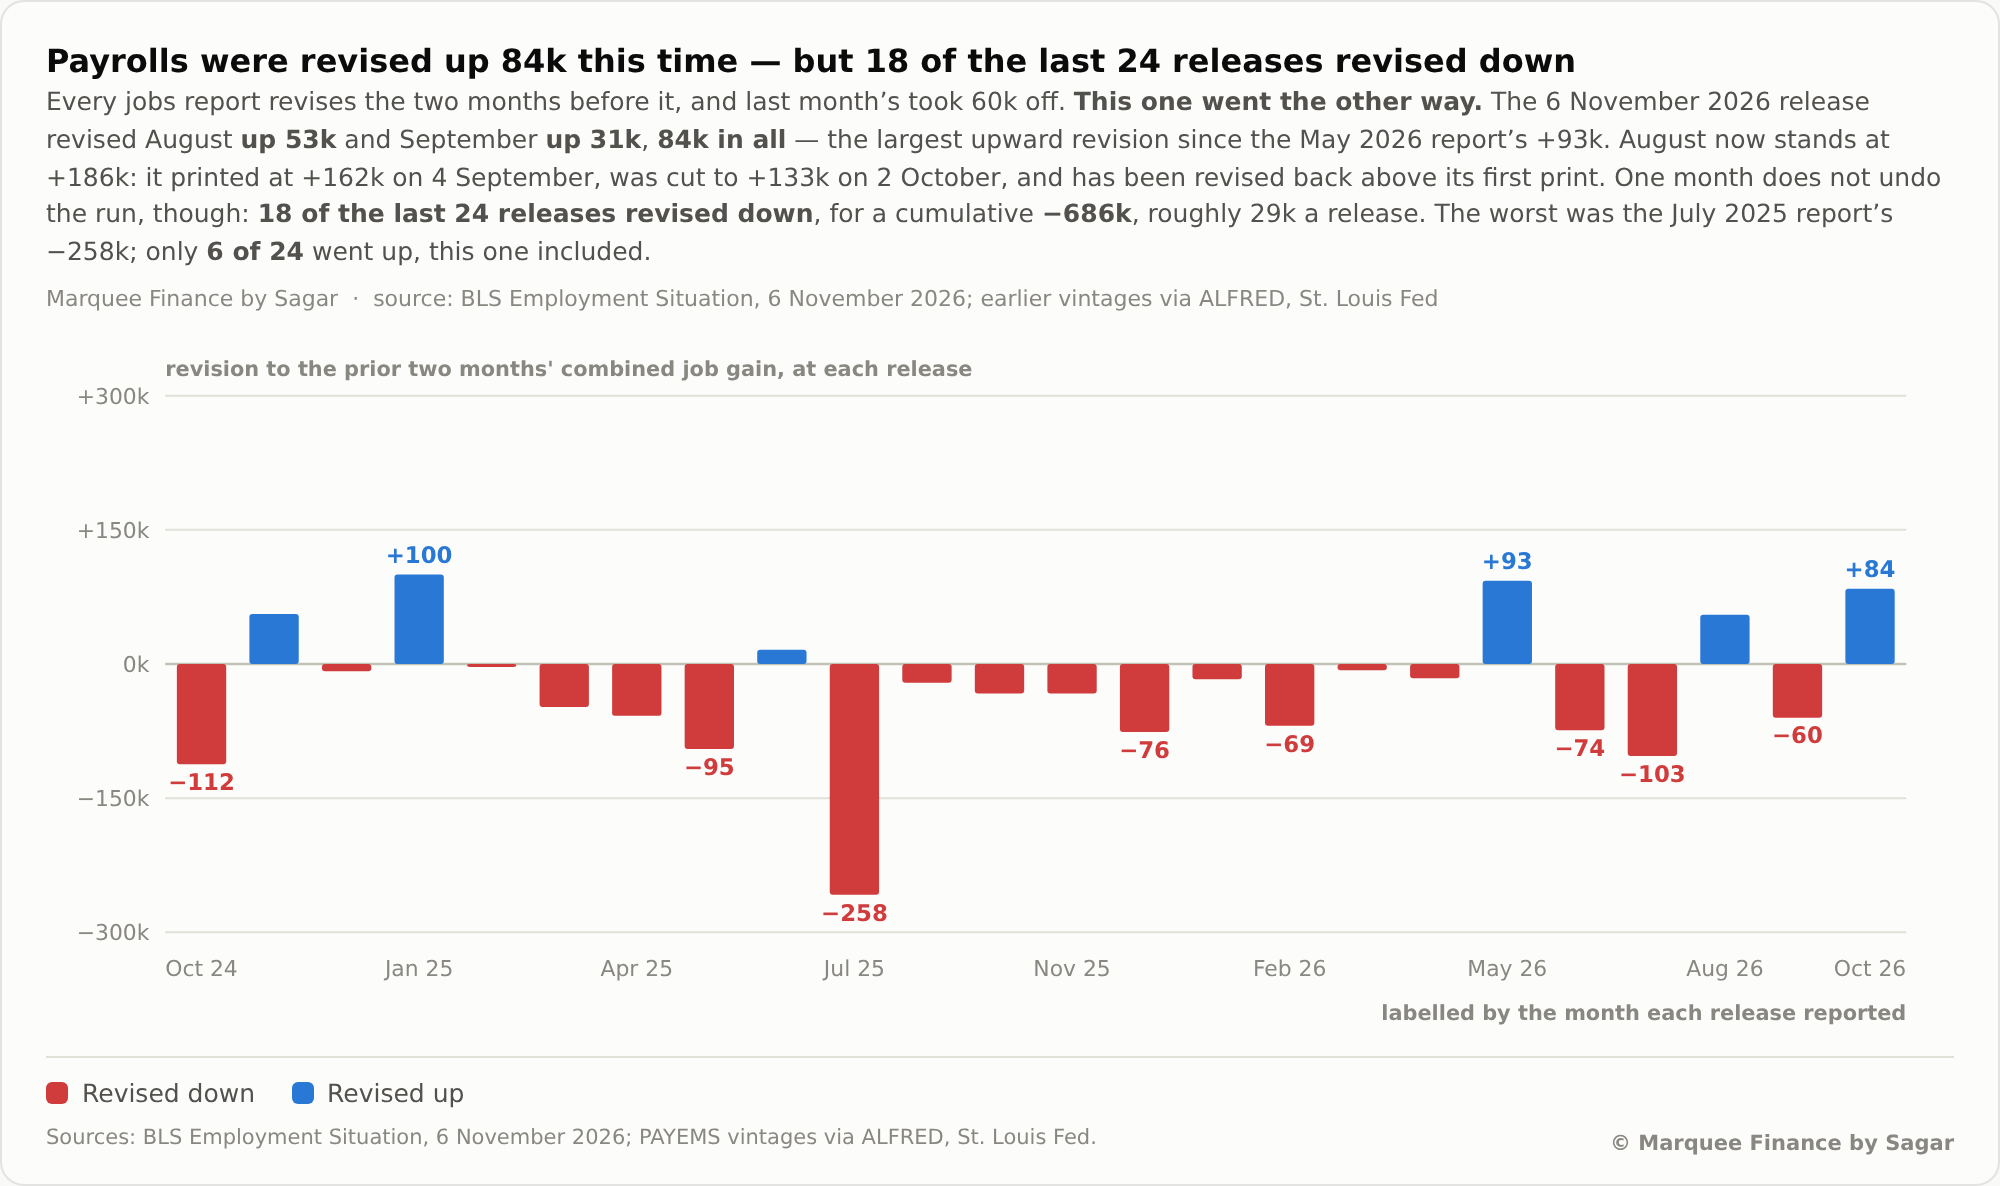
NFP-2: One positive surprise from yesterday’s job report was the upward revision of 84k jobs for August and September. Notably, this is the largest upward revision since May 2026. We will have to watch closely whether this is a one-off or a trend change (the trend has been lower revisions).
Equities!
The SPX closed at the 200 DEMA. However, the charts are horrific.
SPX has now closed below the key