

We have, in the past 15 months, written:
Explosive Setup Confirmed: 25th January 2025.
Explosive Setup Part 2: 7th June 2025.
Explosive Setup Part 3: 15th November 2025.
Explosive Setup Part 4: 14th March 2026.
When we wrote Part 1, SPX fell by more than 20% in the next month.
In Part 2, we were extremely bullish on equities (especially small caps), and the bull market began.
In Part 3, we expected elevated cross-asset moves (Gold and Silver massive run began)
In Part 4, SPX fell another 6-7% as the market rout deepened.
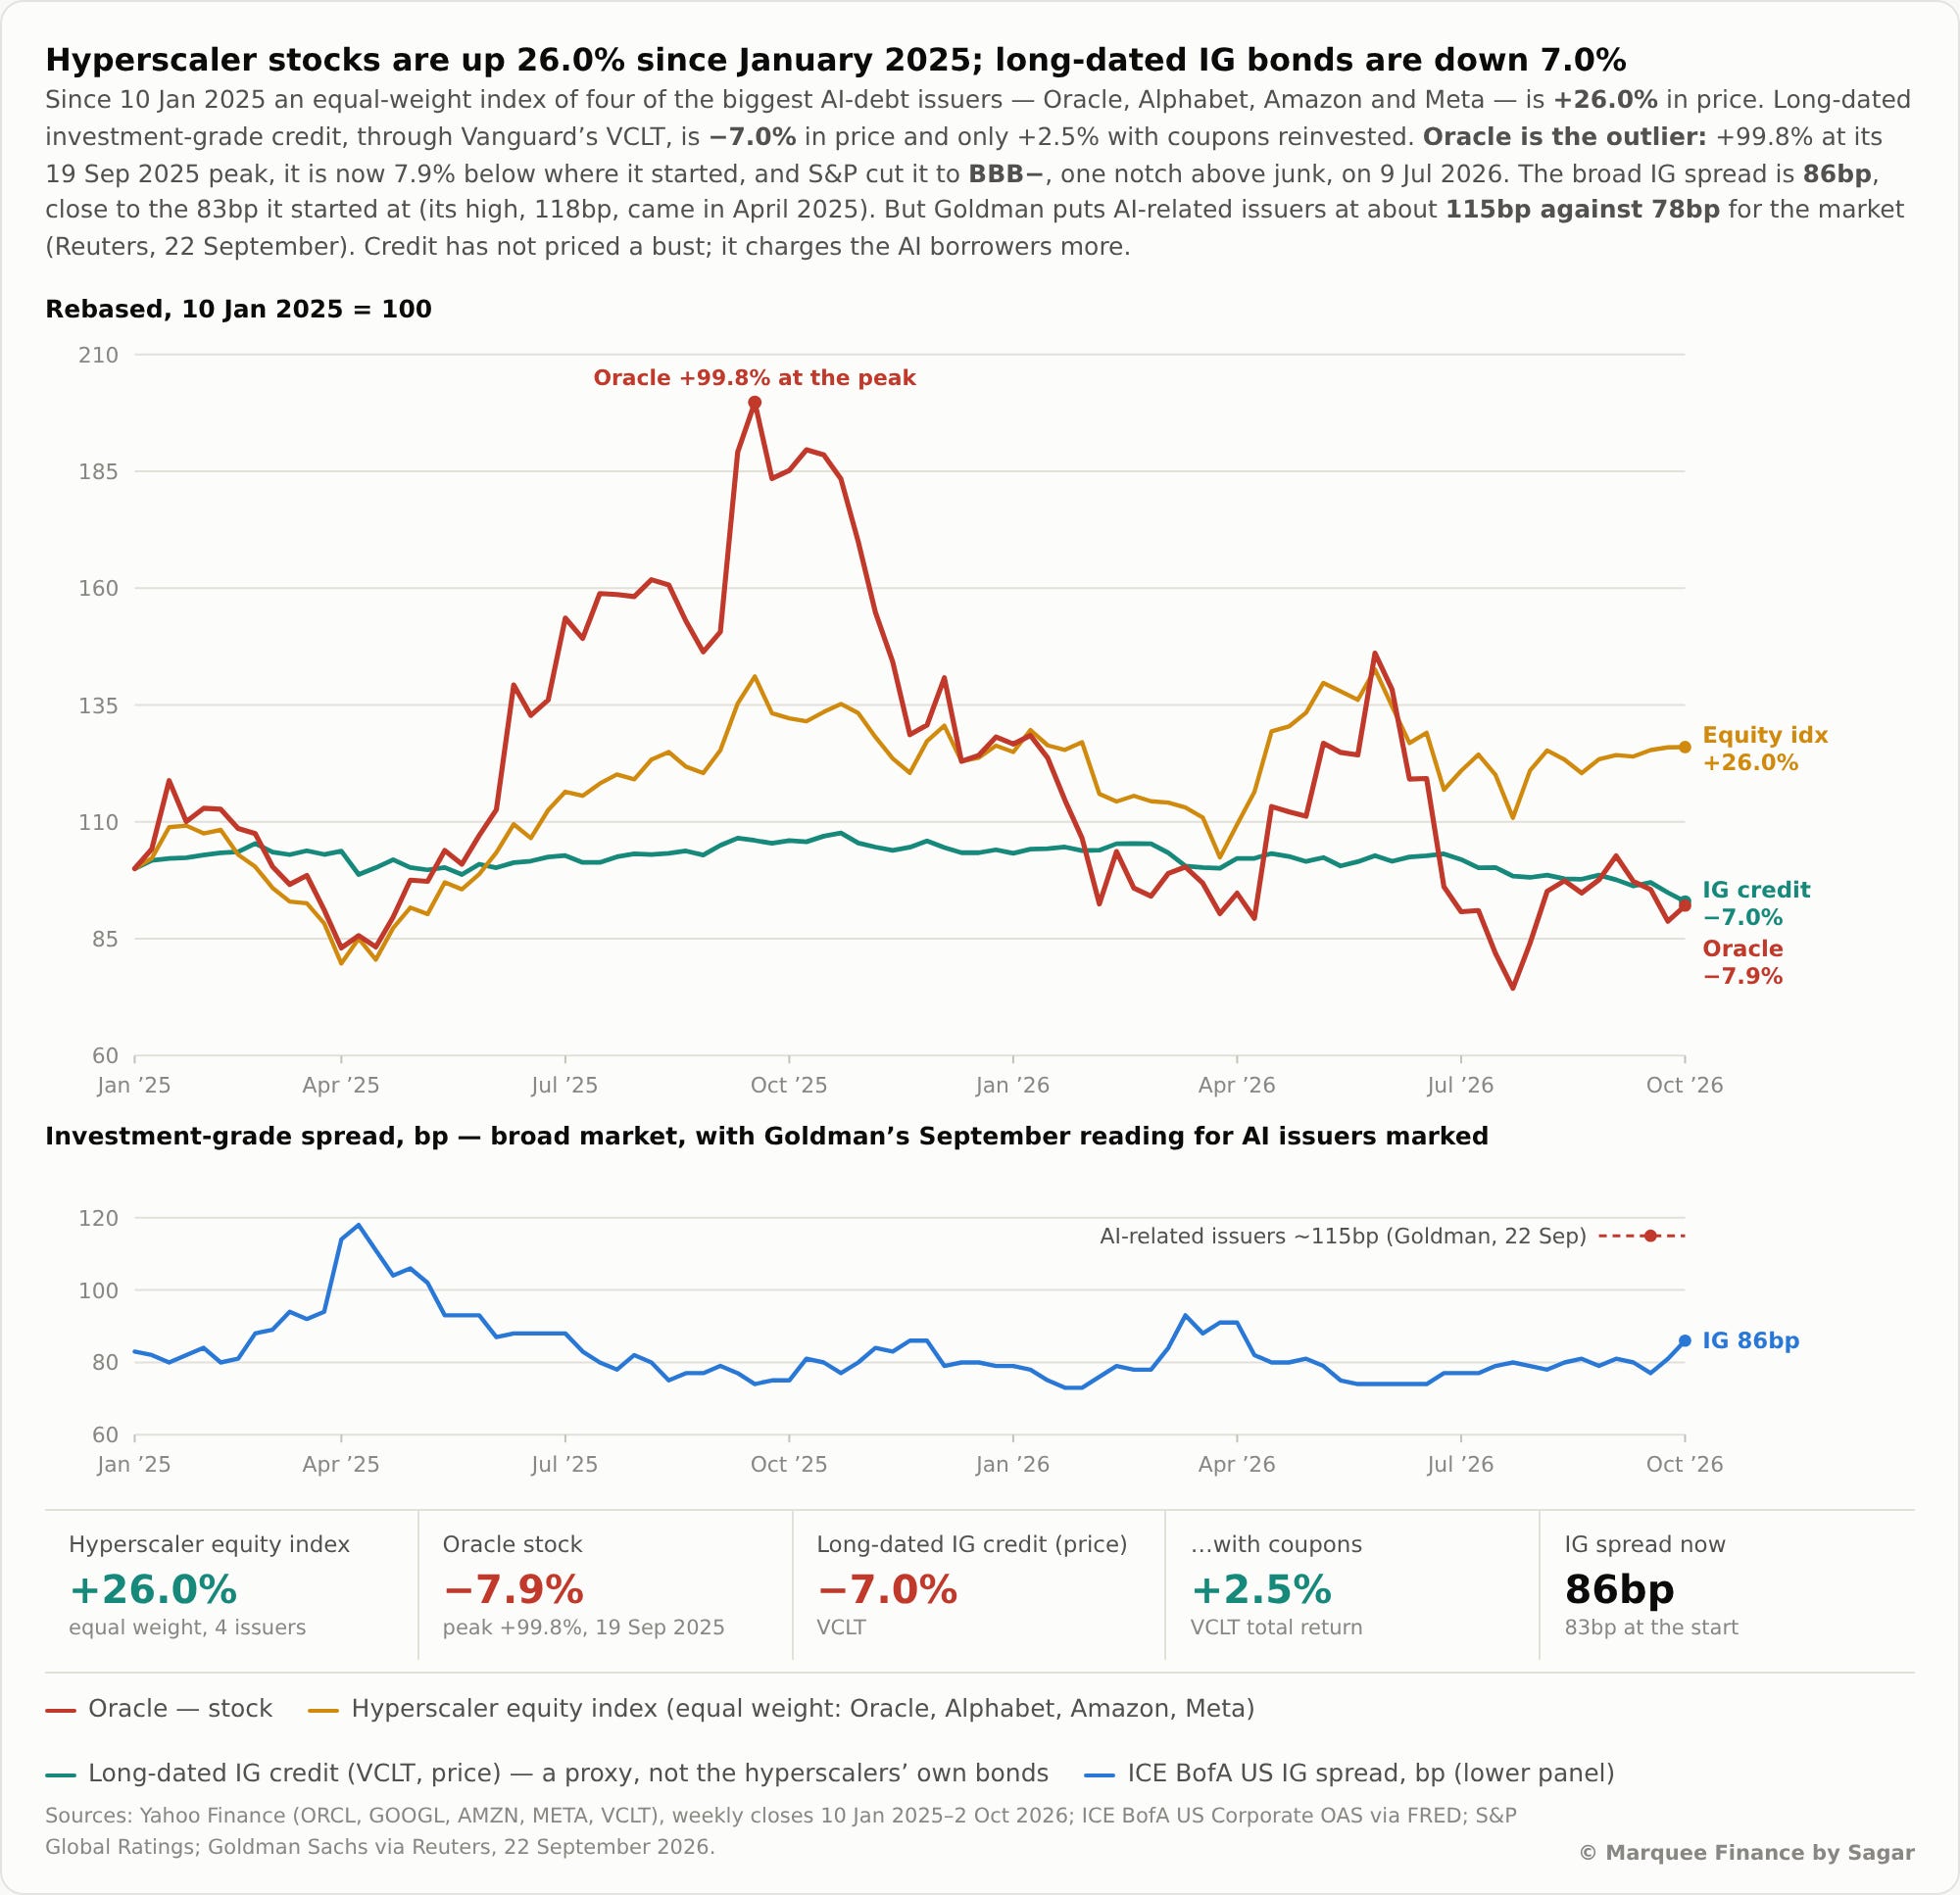
While the equity markets (AI) remain euphoric, credit markets continue to flash warning signals.
In fact, we have been indicating this for the past few weeks now, and the right word to use here is that hyperscalers' and chip companies' credit is sulking.
While the IG spread has reached 86 bps, the AI-related issuers' spread has blown to 115 bps+.
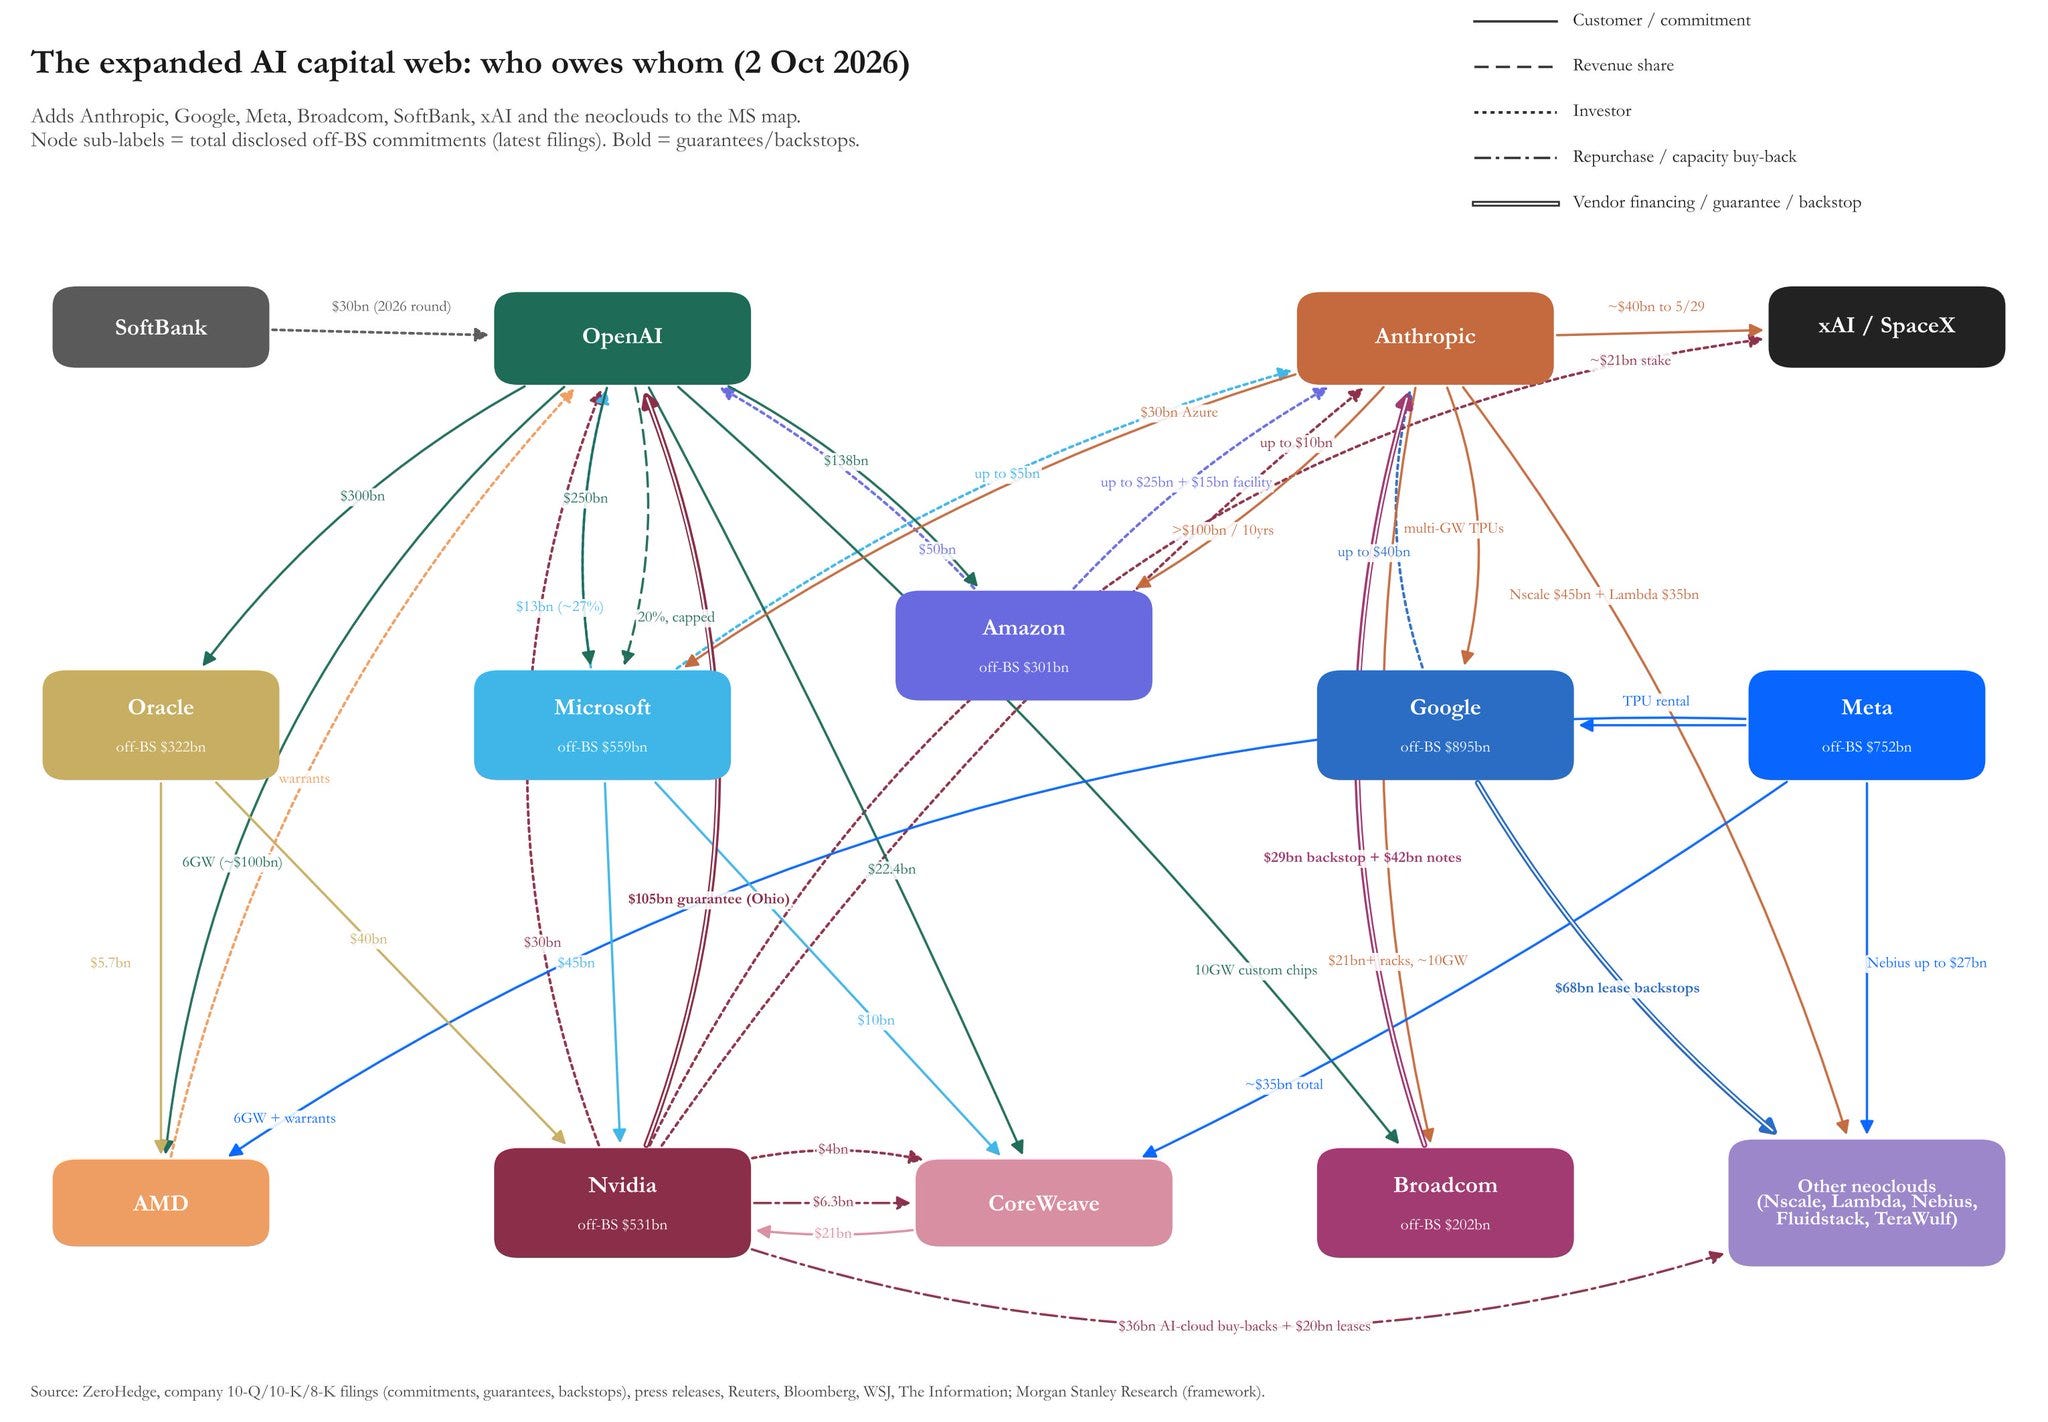
The rout is now spreading to chip makers as well, as Broadcom (AVGO) CDS reached fresh 52 Week highs on news of Broadcom’s $60 billion chip SPV for Anthropic.
Circular financing has grown much bigger and reached unprecedented levels.
We have received a lot of queries from paid subscribers in our chat and DMs about the dashboard/Macro Musings.
We want everyone to know it’s shaping up very well, and it will take 30-45 days before we go live with the full terminal.
Sharing a snapshot of the live terminal (work in progress):
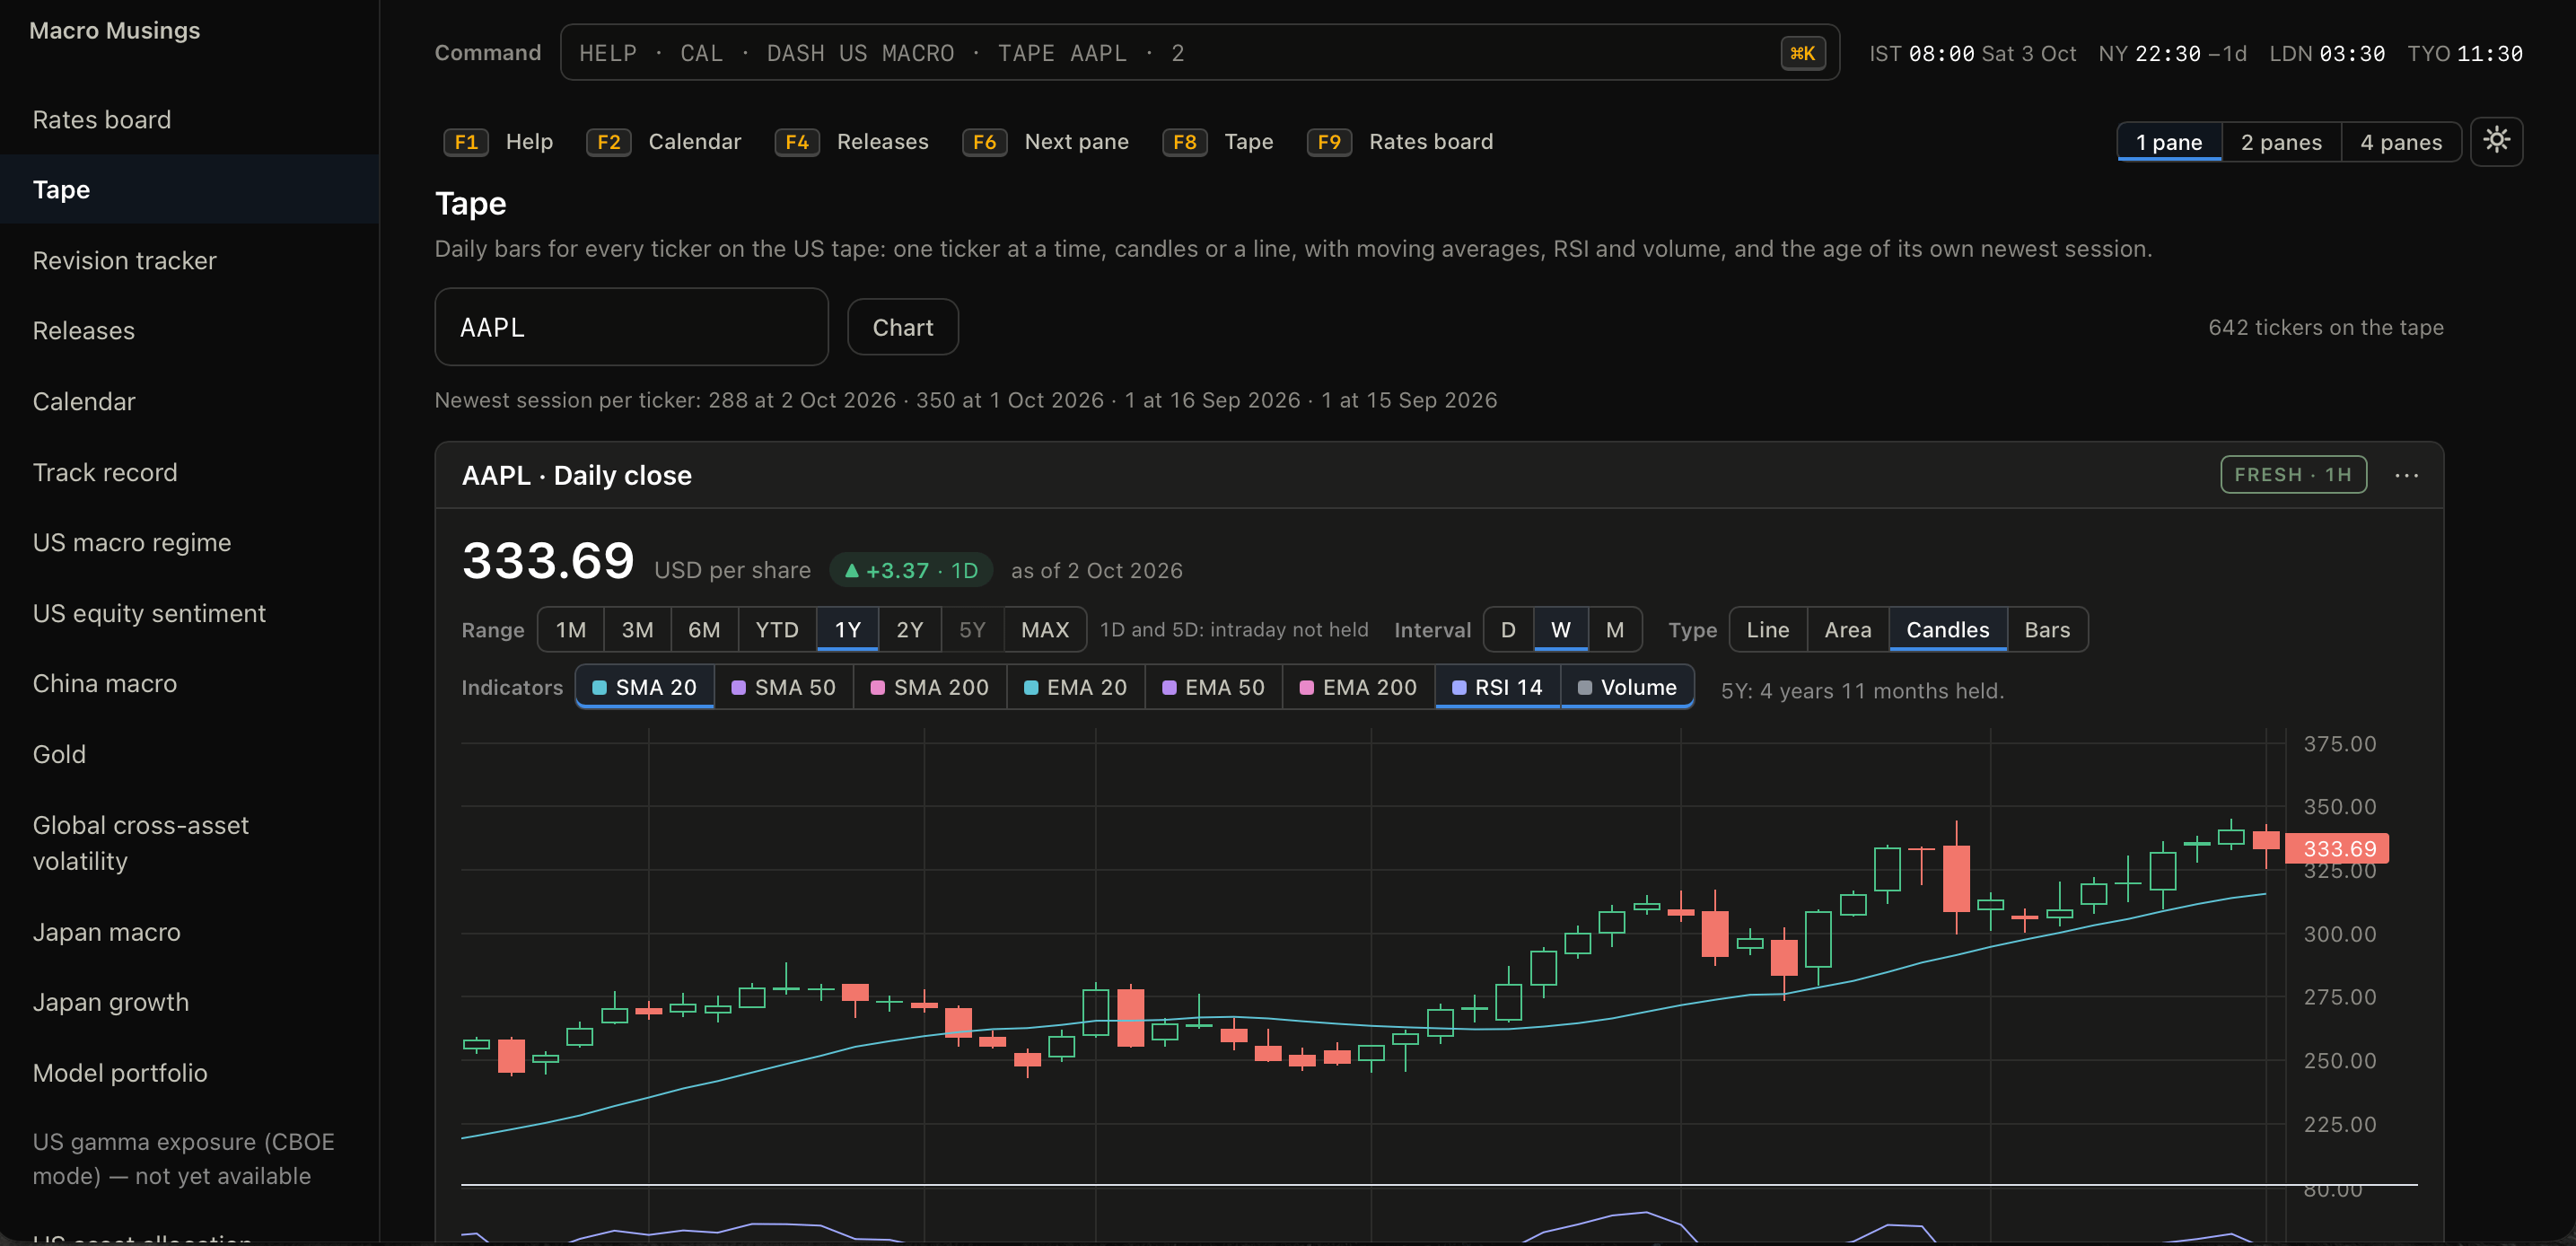
PS: Paid subscribers will get access to the beta version before the end of the month.
Due to the market carnage beneath the surface, we have had a bad run recently, but we expect to recoup the losses in the coming weeks and months as we follow risk management prudently.
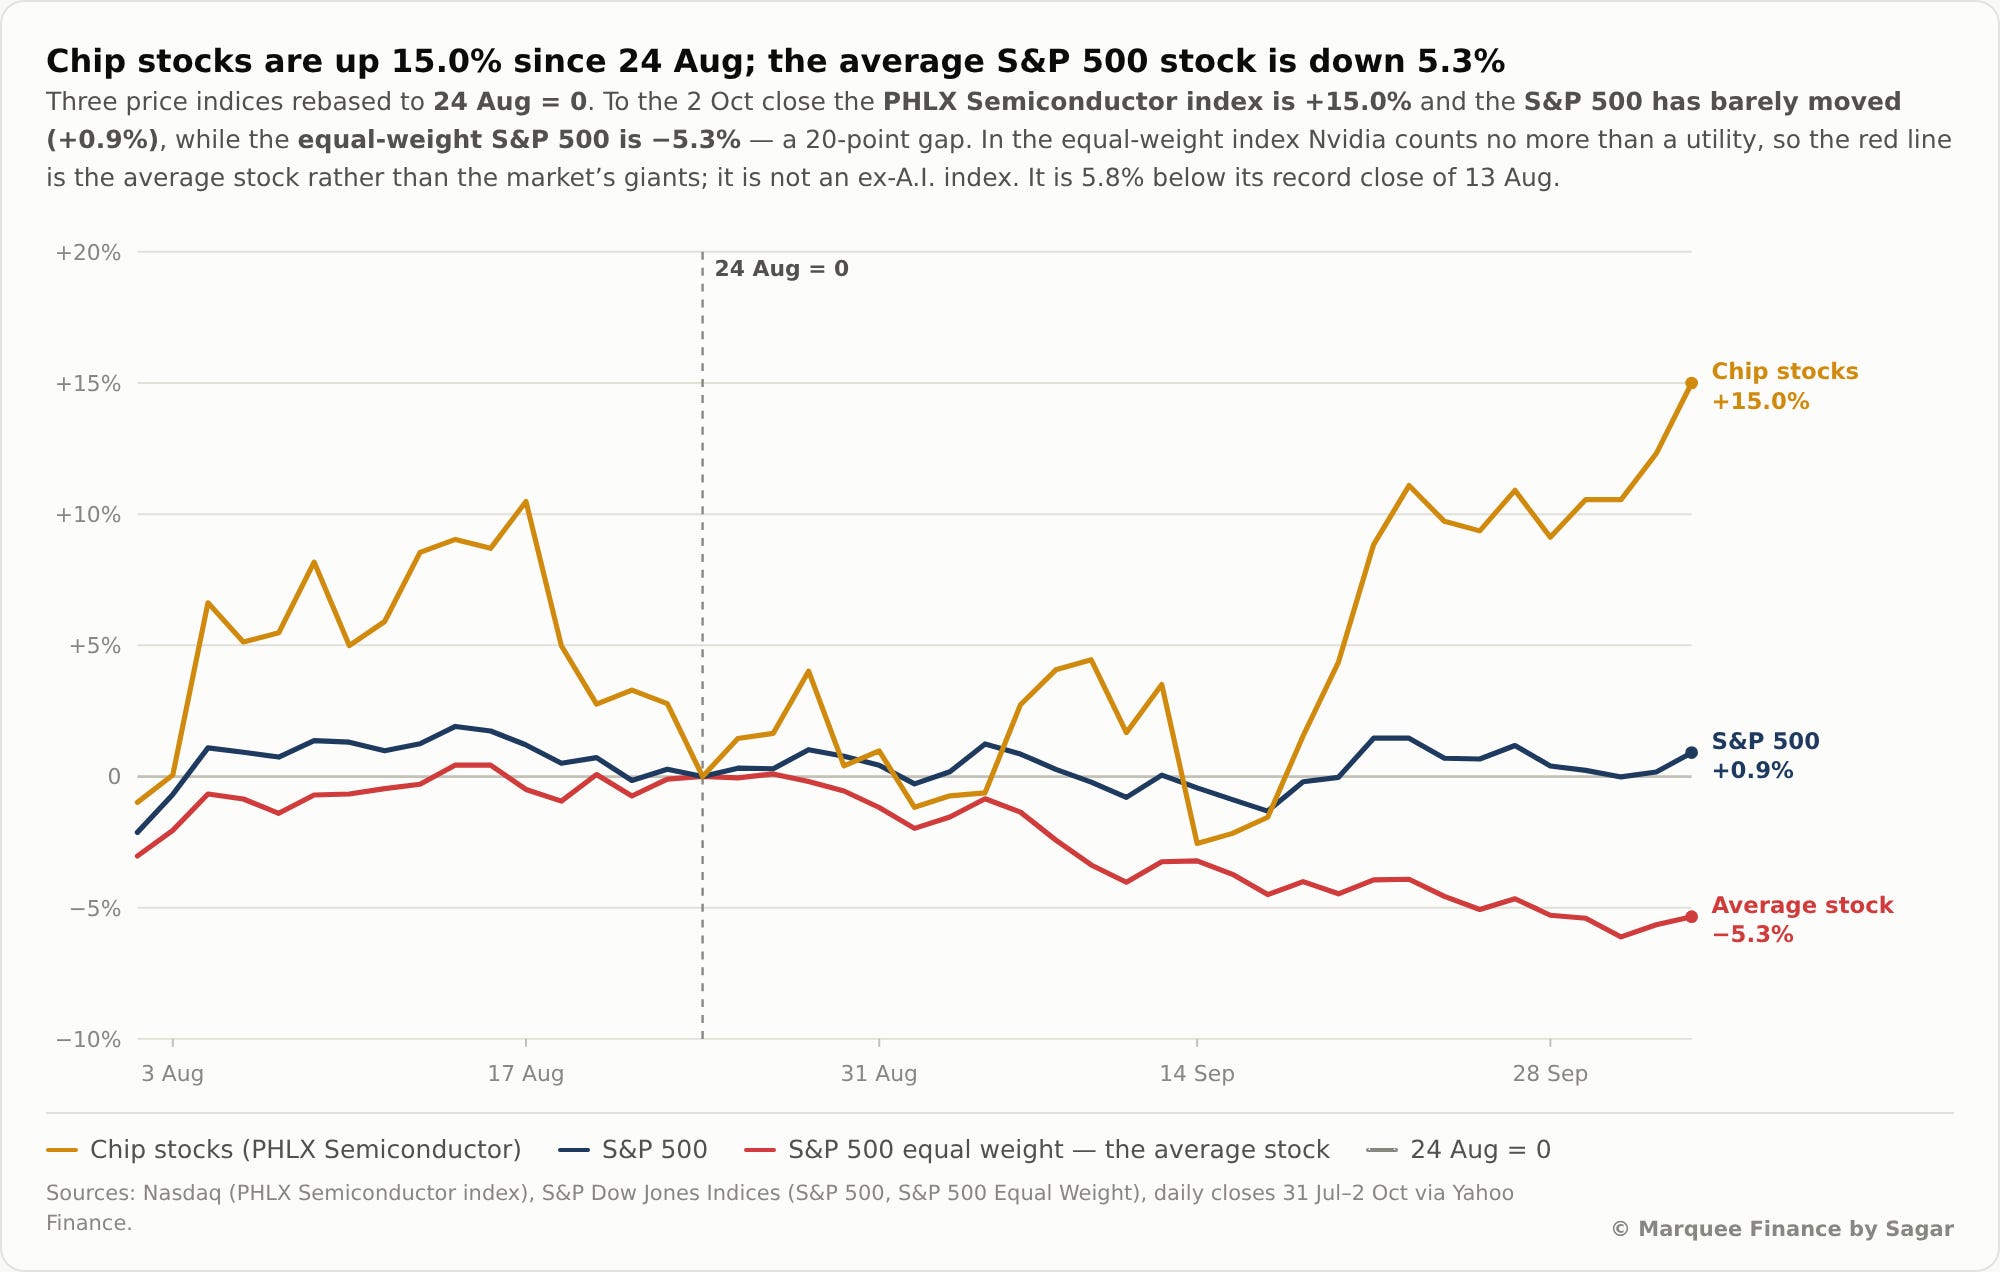
When we say carnage, you may be shocked to learn that RSP (equal-weight index) is down 5.3% (at 200 DEMA), while SPX is up 1%, led again by chip stocks (as we saw after the ceasefire in April).
Note that our PF hit YTD highs around mid-August, and September was one of our worst months (comparable to the March drawdown).

Let us take a deep dive into the macro universe and comprehend the cross-asset moves.
US/Equities/Bonds/Dollar/Gold/Oil!
This week was extremely critical for macro as we got GDP, PCE, ISM, JOLTS and NFP.
Our favourite metric for tracking the cyclical economy has been ISM Manufacturing.
ISM Manufacturing came in at 54.5, 50 bps below market expectations.
Nonetheless, the cyclical continues to fire thanks to the enormous AI capex.
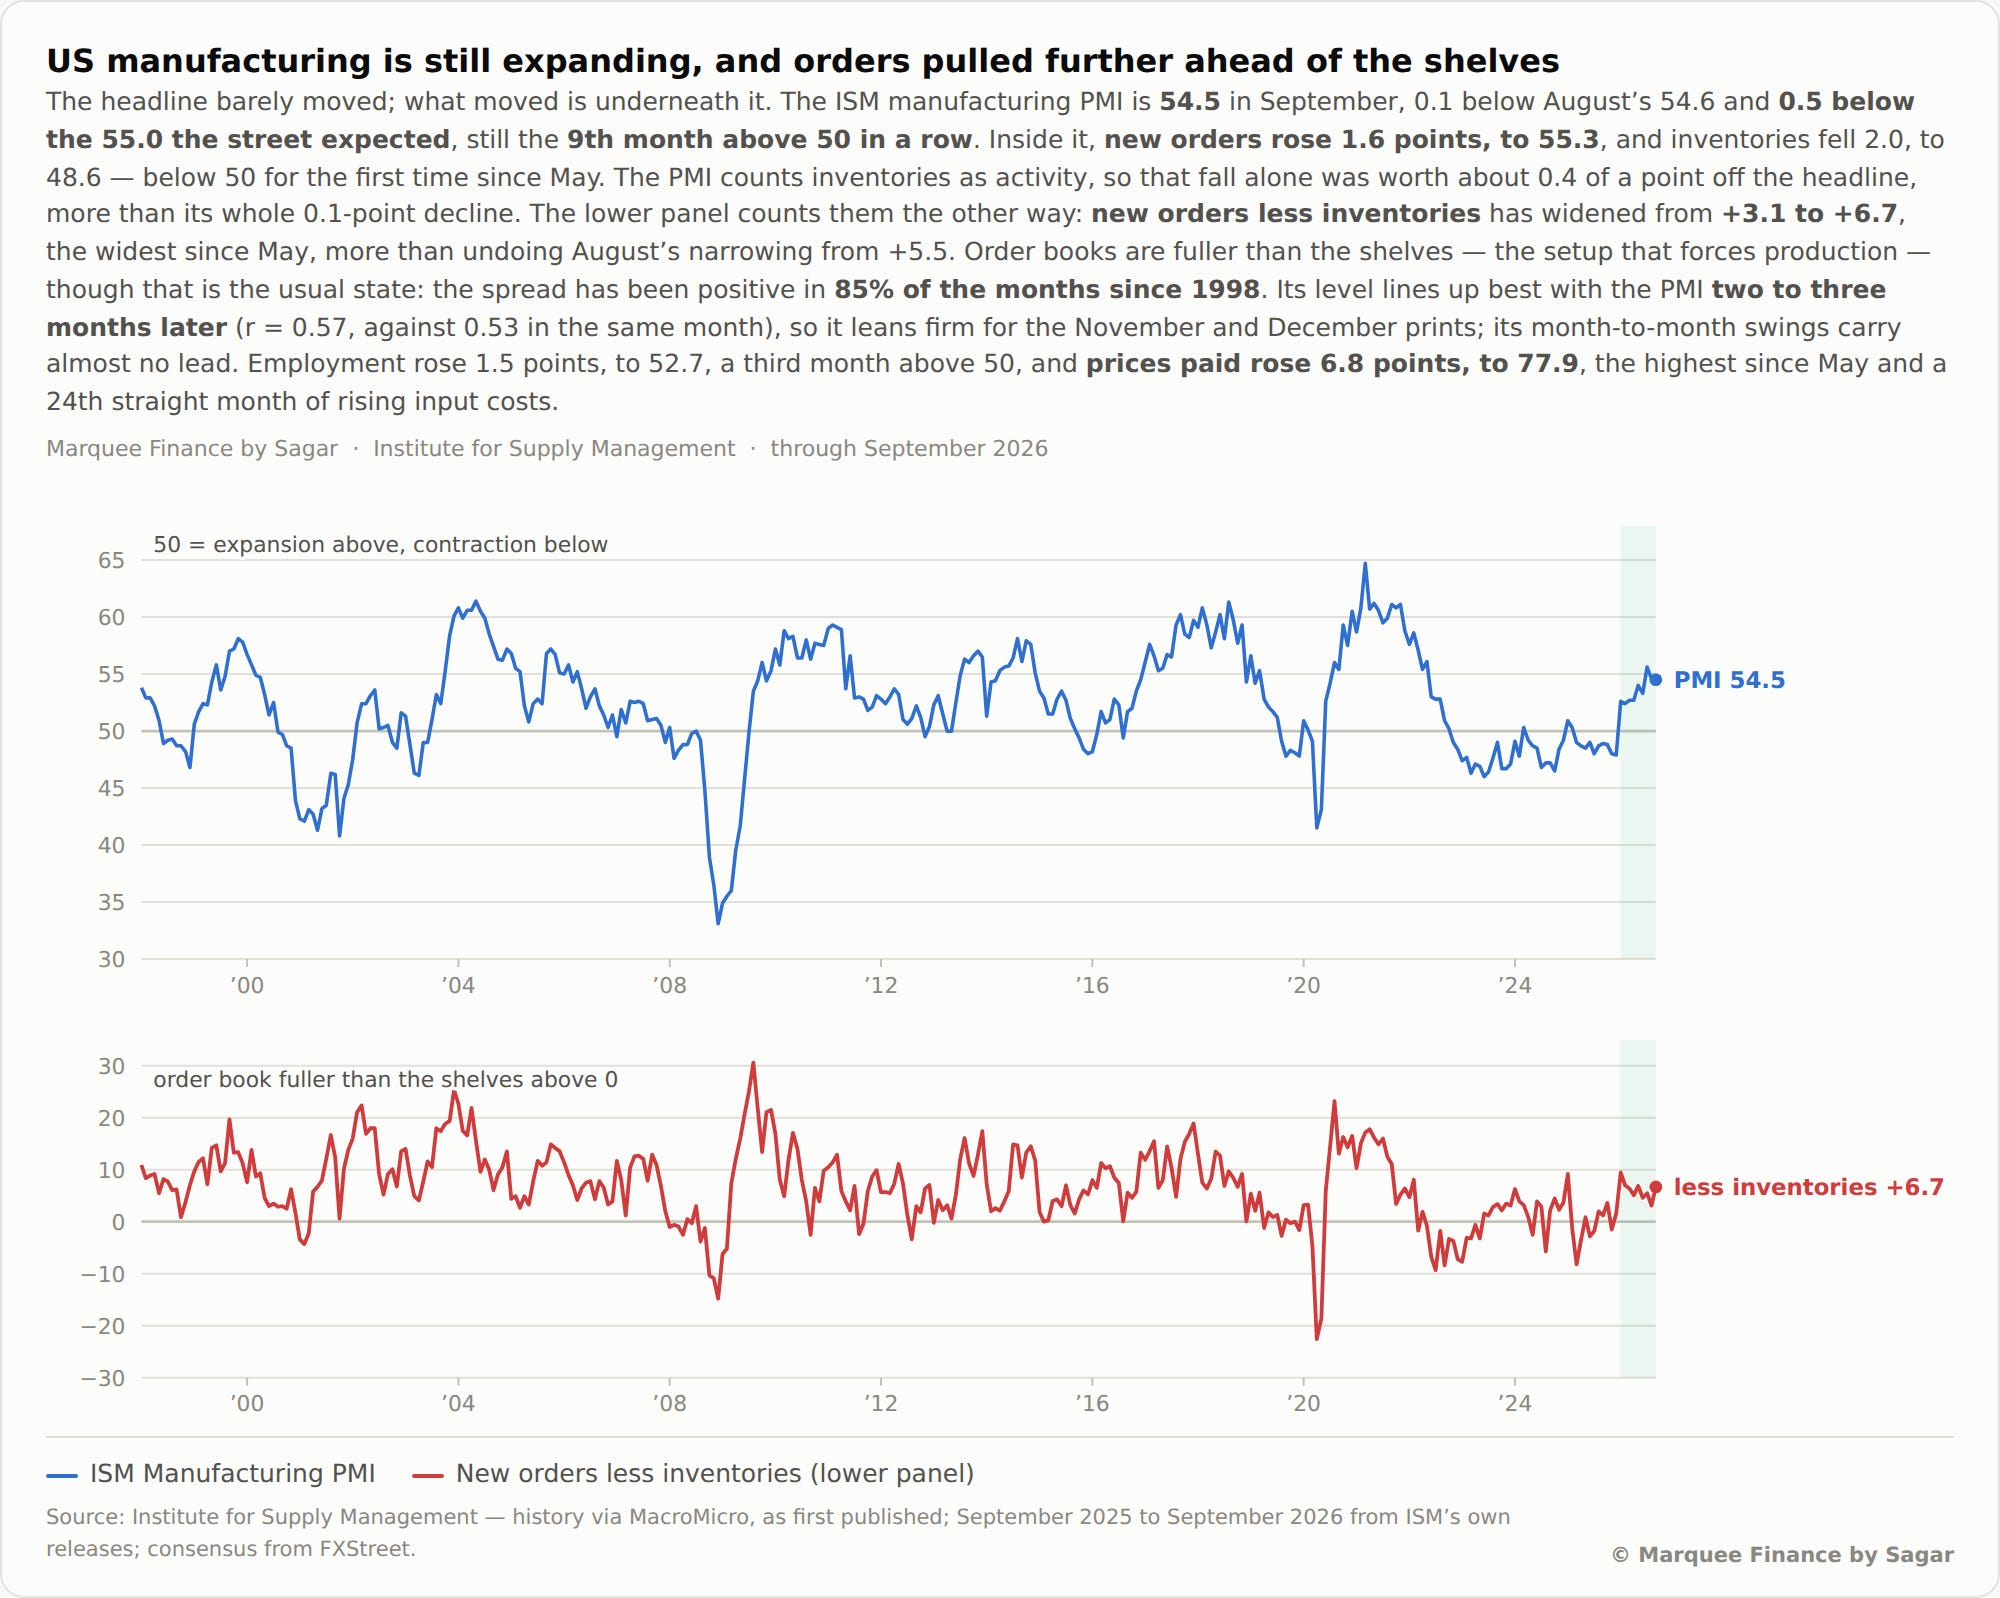
Furthermore, Orders Less Inventories rose again to 6.7, suggesting the headline PMI could move higher in the coming months ahead of the festive season.
The silver lining was higher backorder backlogs, attributed first to producers being unable to meet high demand (longer lead times largely related to AI rollout) and second to supply chain disruptions.
Respondents' comments confirm this. Interestingly, the tariffs still remain one of the biggest problems.
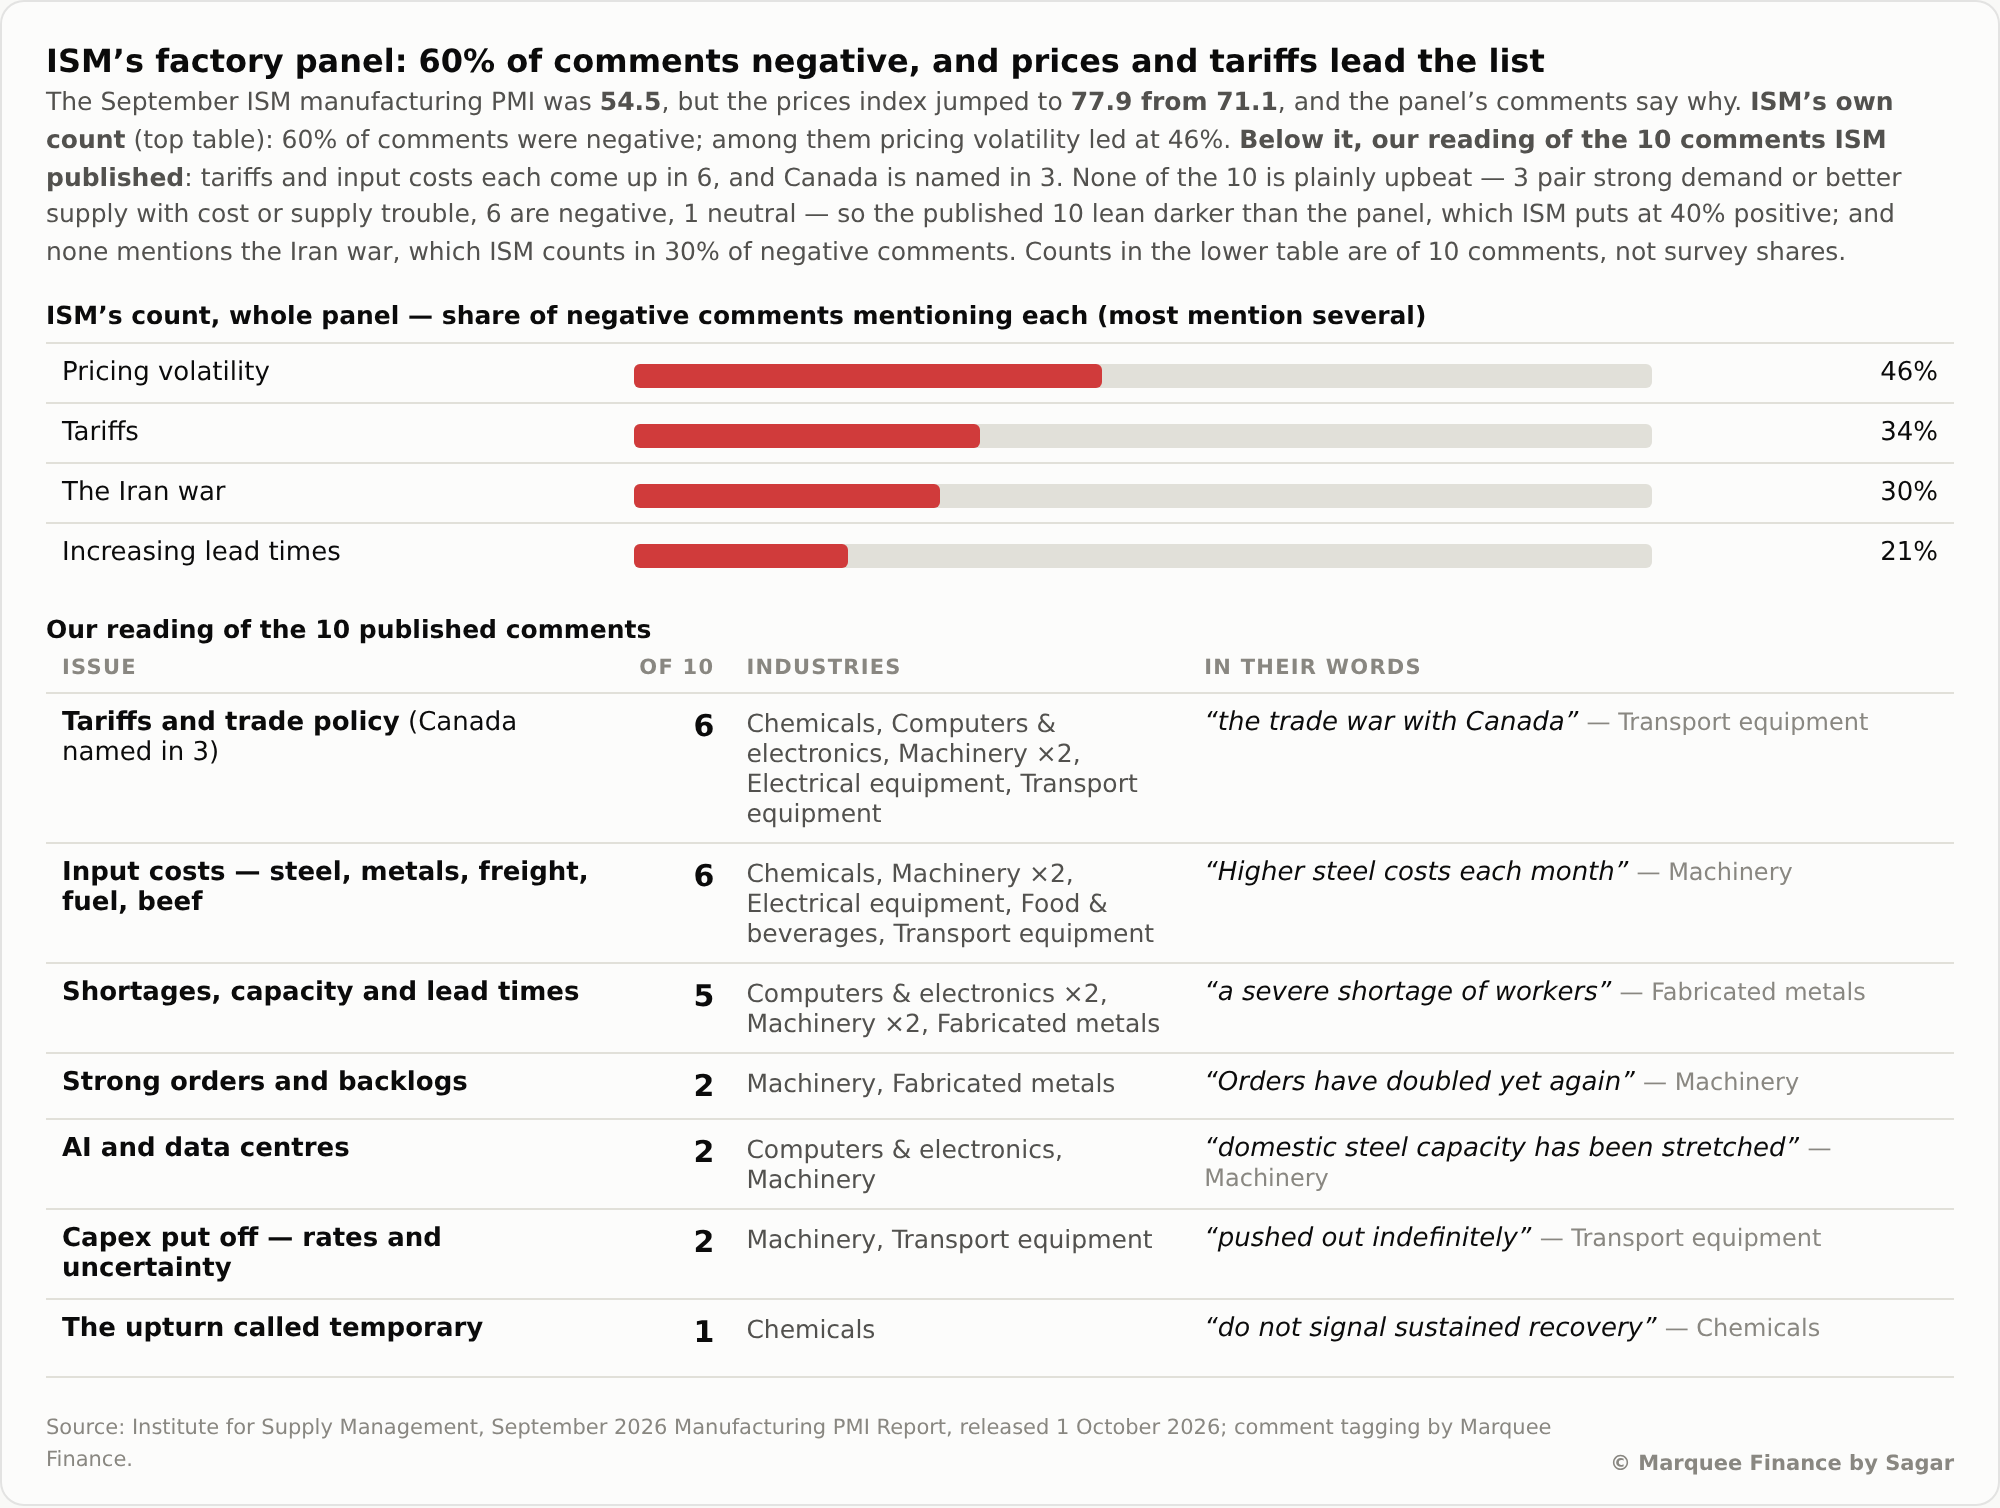
Thus, due to persistent policy U-turns and higher pump prices, ISM prices are going bananas, with the print coming in at 77.9 v/s 77.1.
We all know inflation is a lagging indicator, and the recent rise in diesel prices and higher ISM prices will show up in the data over the next few months, with a lag.
Headline PCE came in at 0.3% MoM, and Core PCE came in at 0.2% MoM.
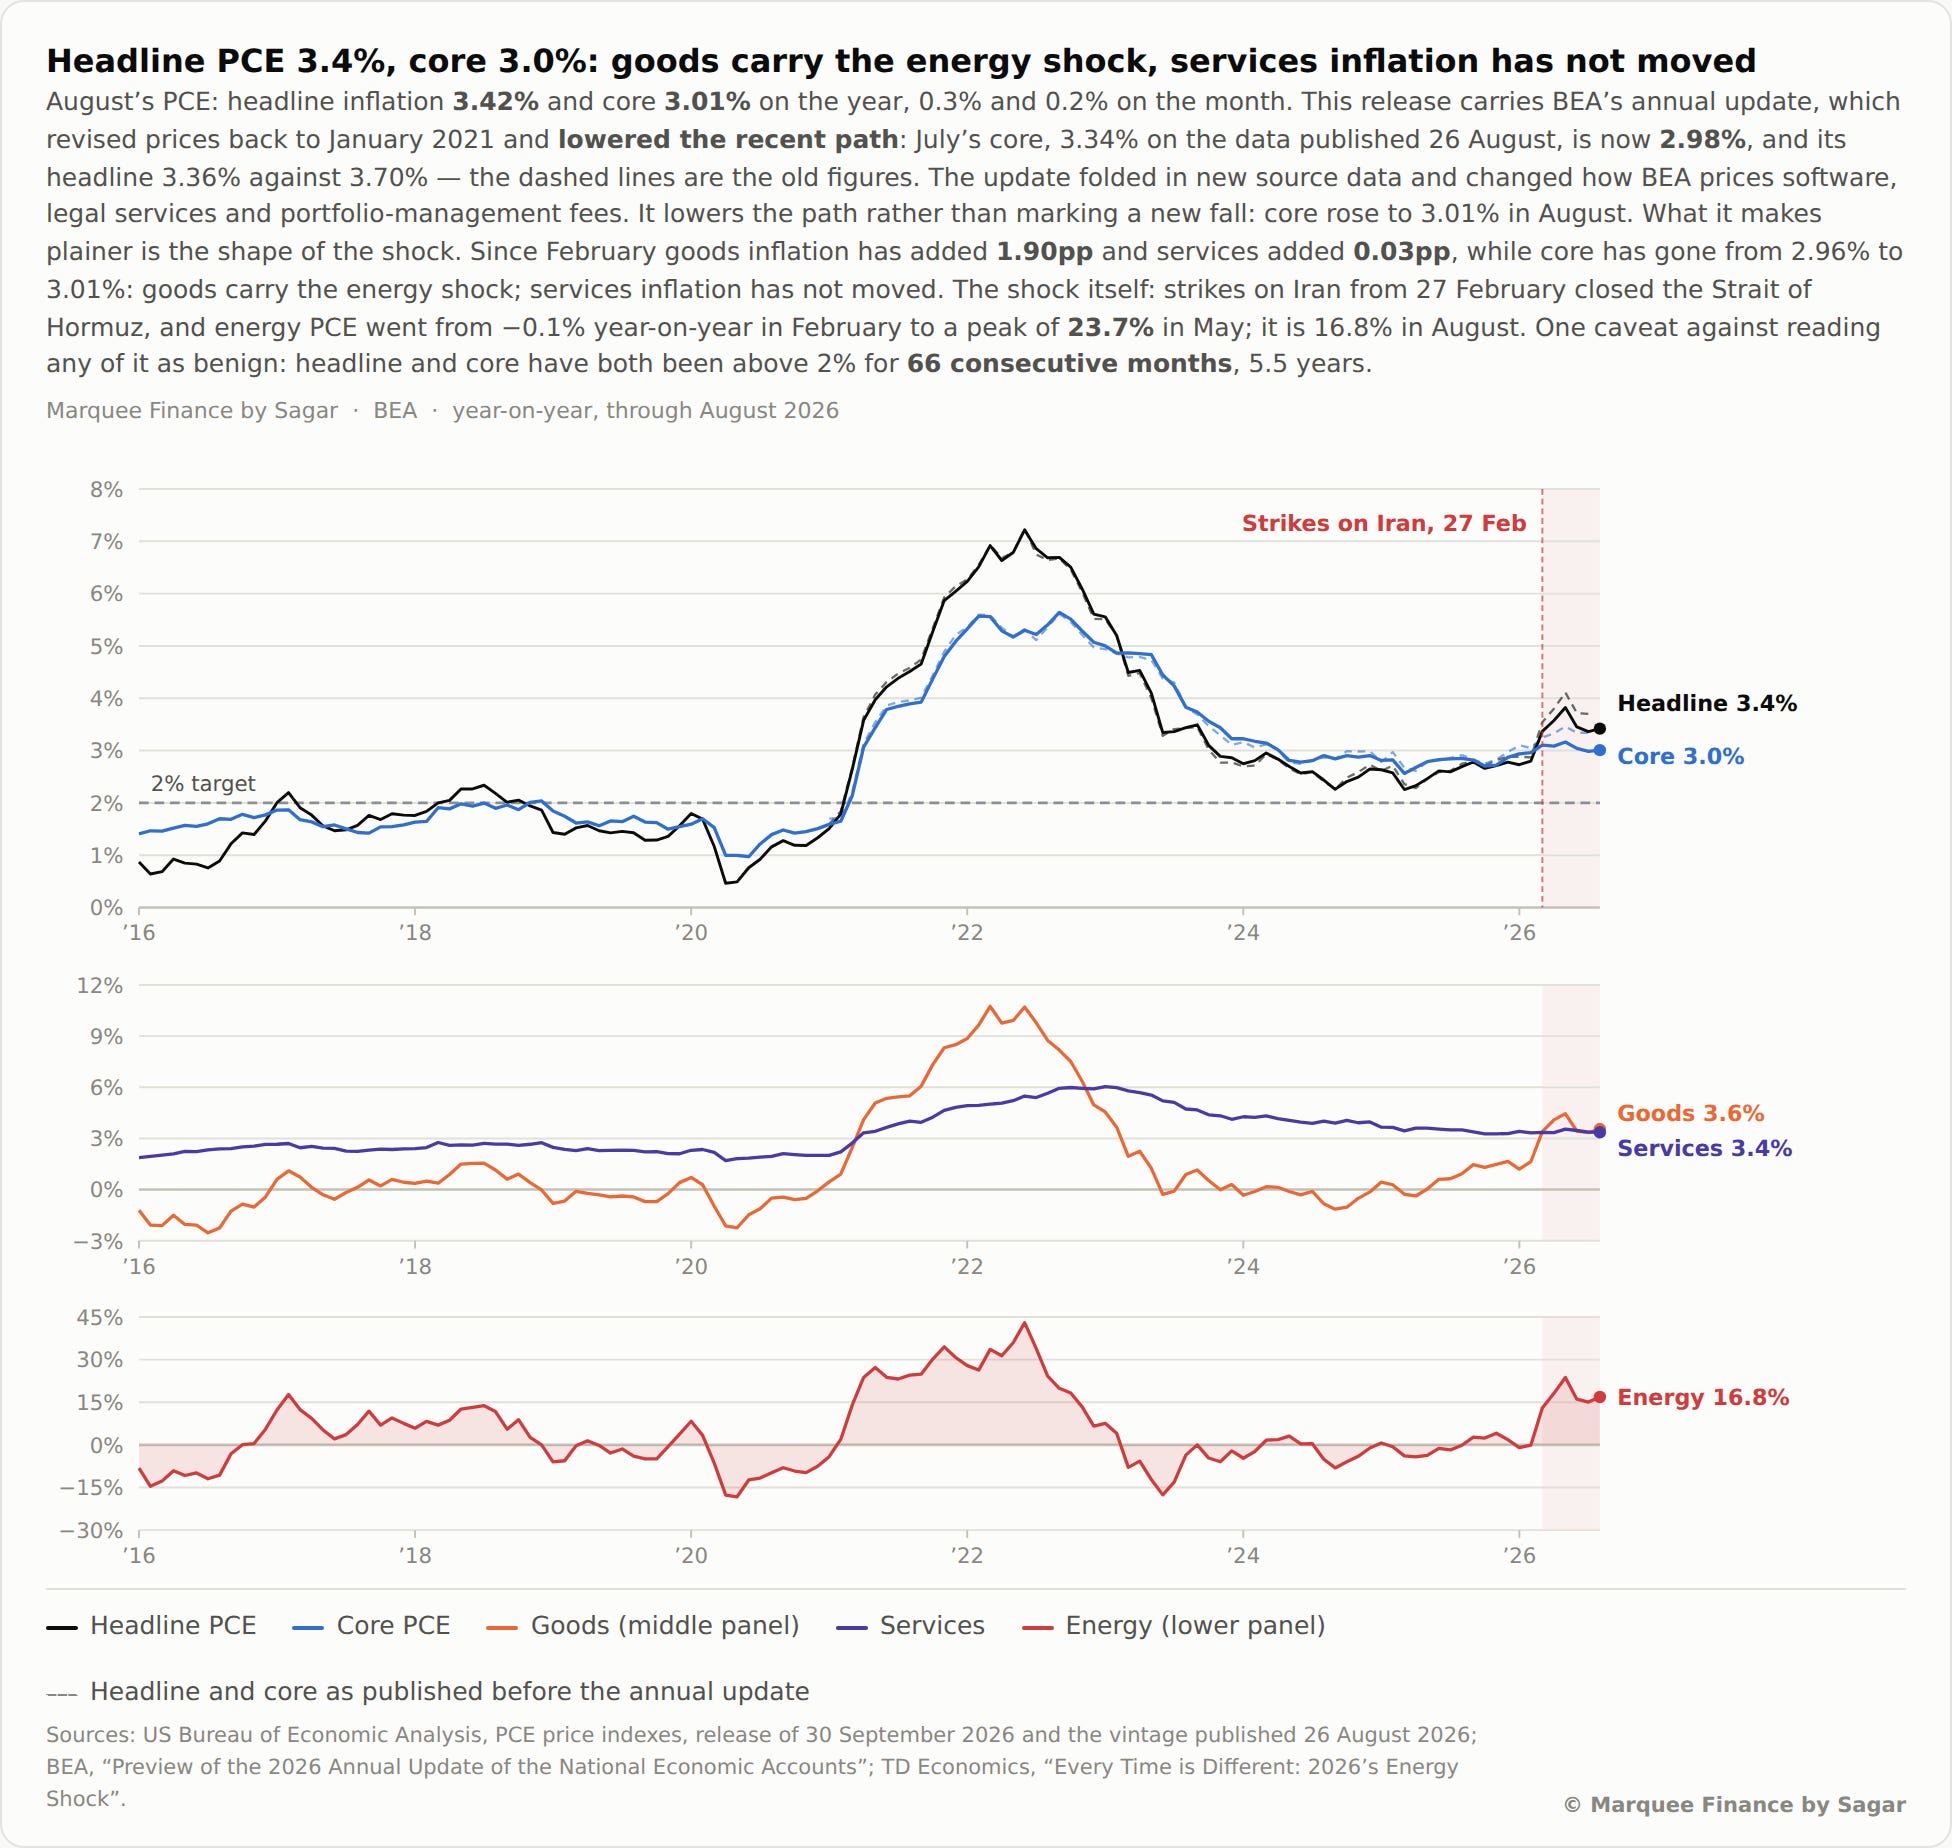
Interestingly, the BEA implemented a methodology change (software, legal, and PM fees); as a result, it revised the PCE readings lower (July core was lowered from 3.34% to 2.98%).
Long-time subscribers know we are not a big fan of GDP because it’s a lagging indicator and is constantly revised.
Q2 GDP was revised higher by 70 bps and, unsurprisingly, much of the contribution now comes from equipment and IP related to the AI rollout.
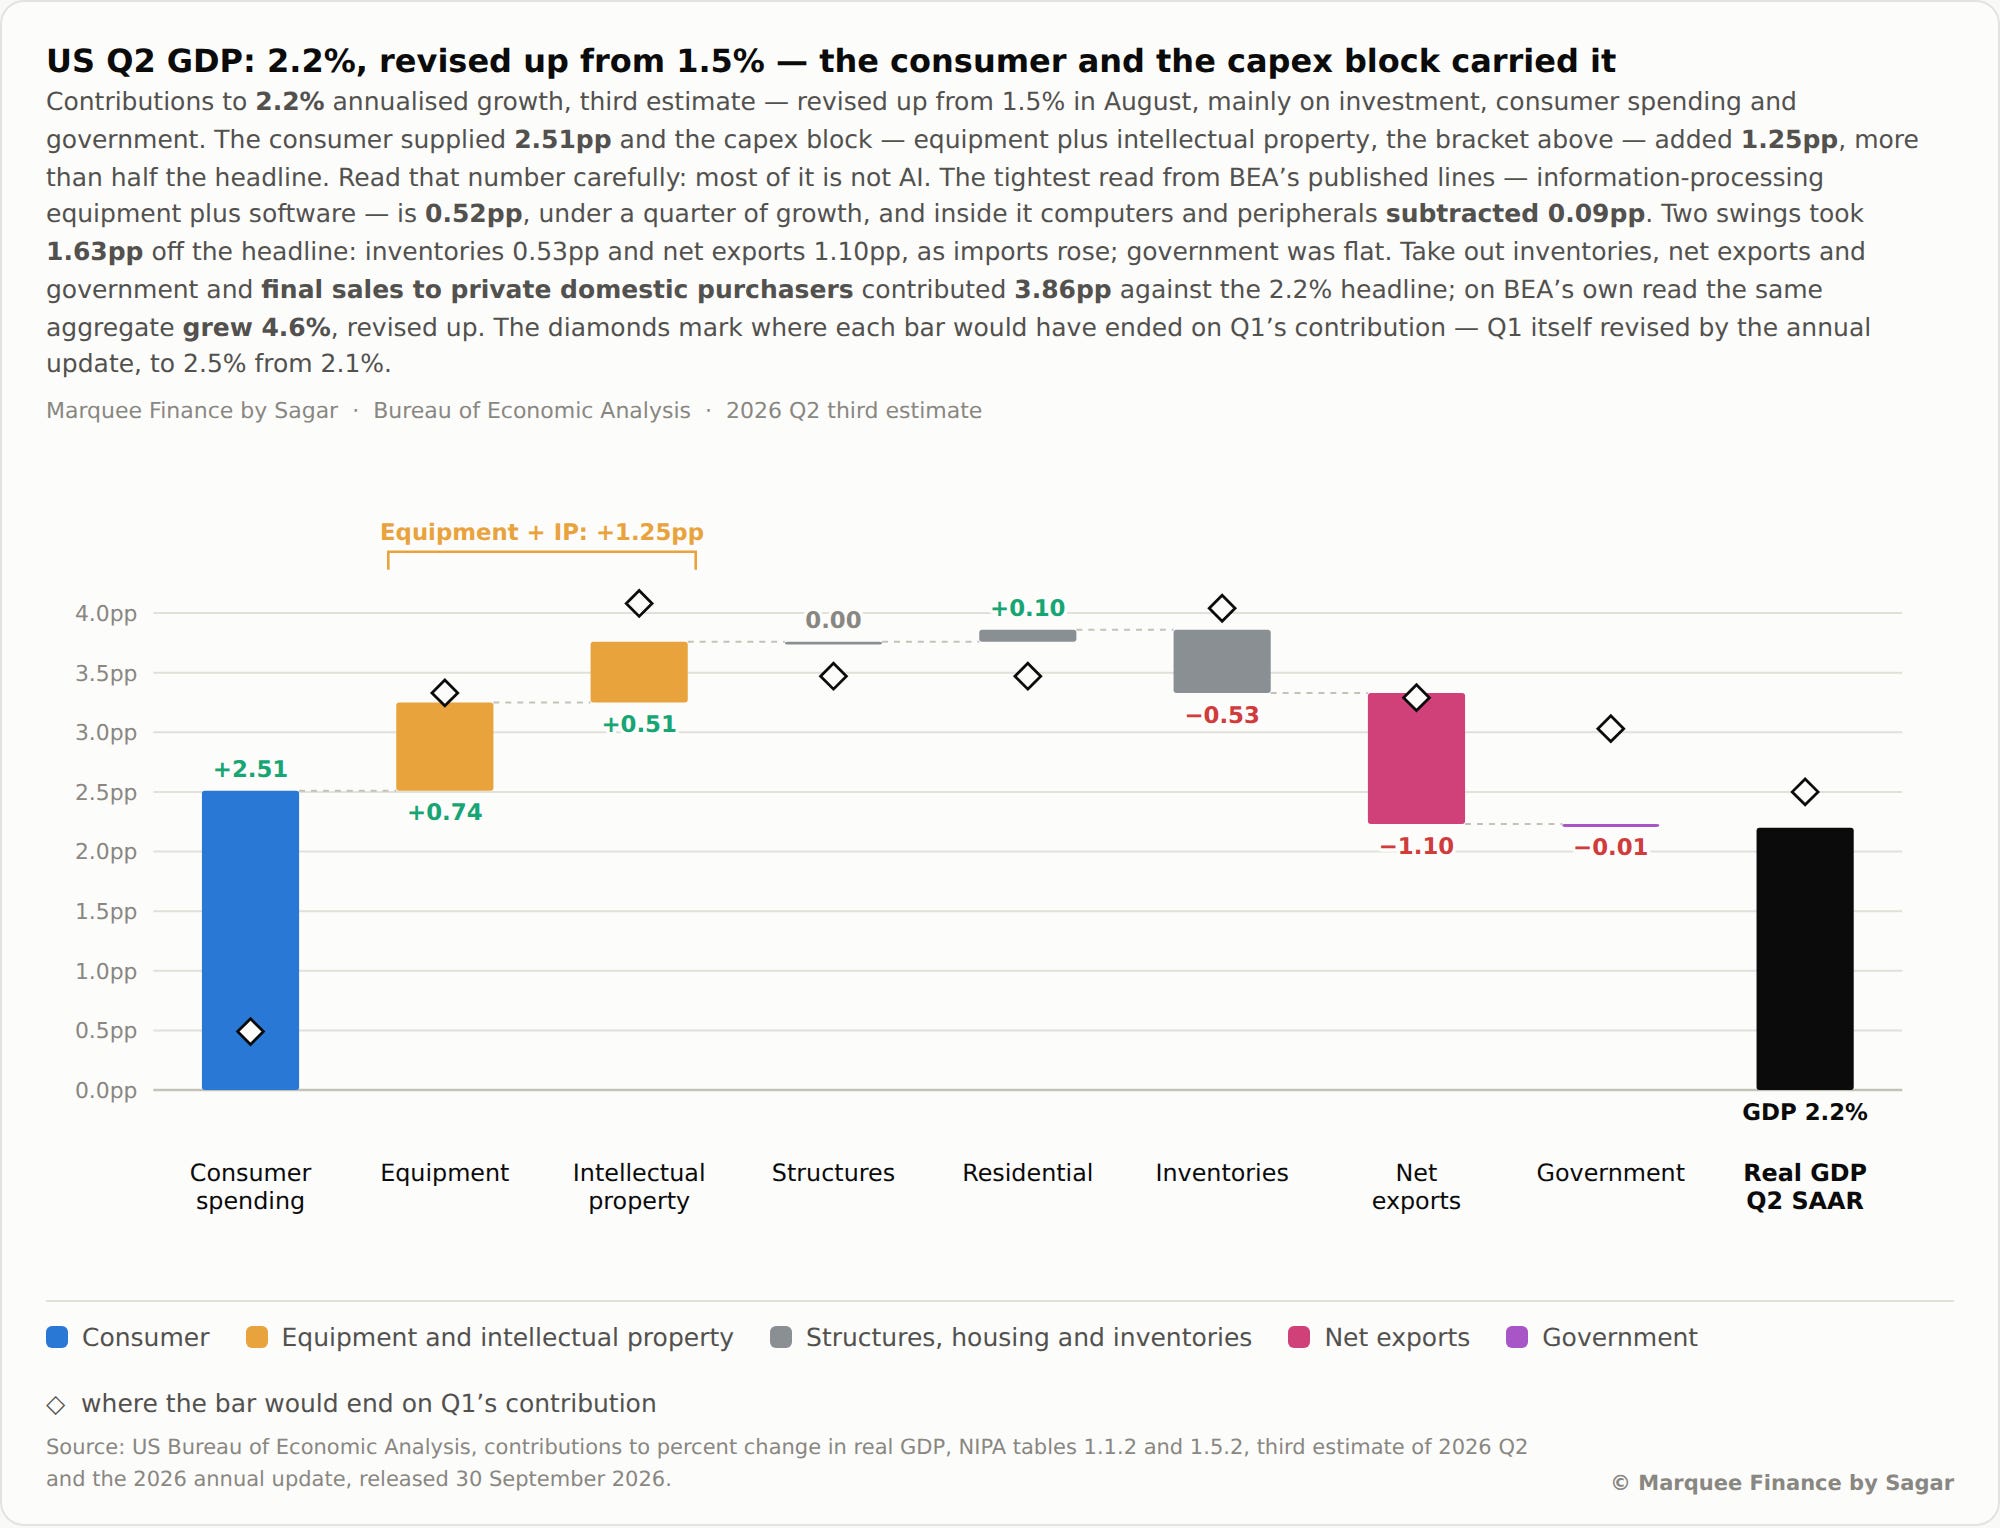
Fed’s preferred GDP metric: final sales to private domestic purchasers, which exclude trade, inventories and government spending, increased at a 4.6% pace in the second quarter and was revised up from 4.2%.
Now let us decode the labour markets:
We have got 6 labour market charts today (some will be visible only to paid subscribers):
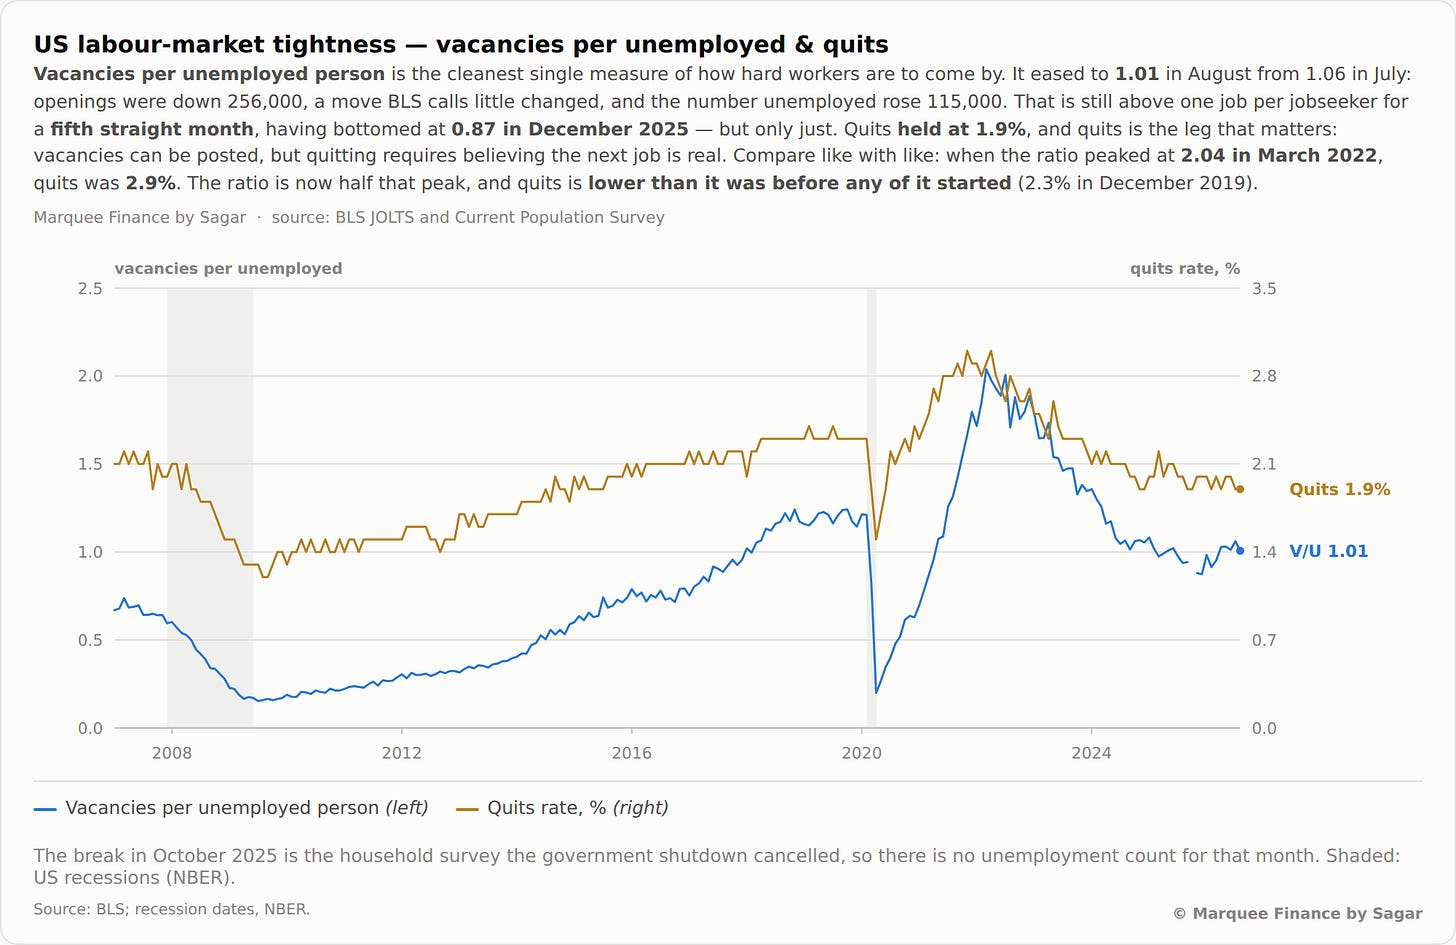
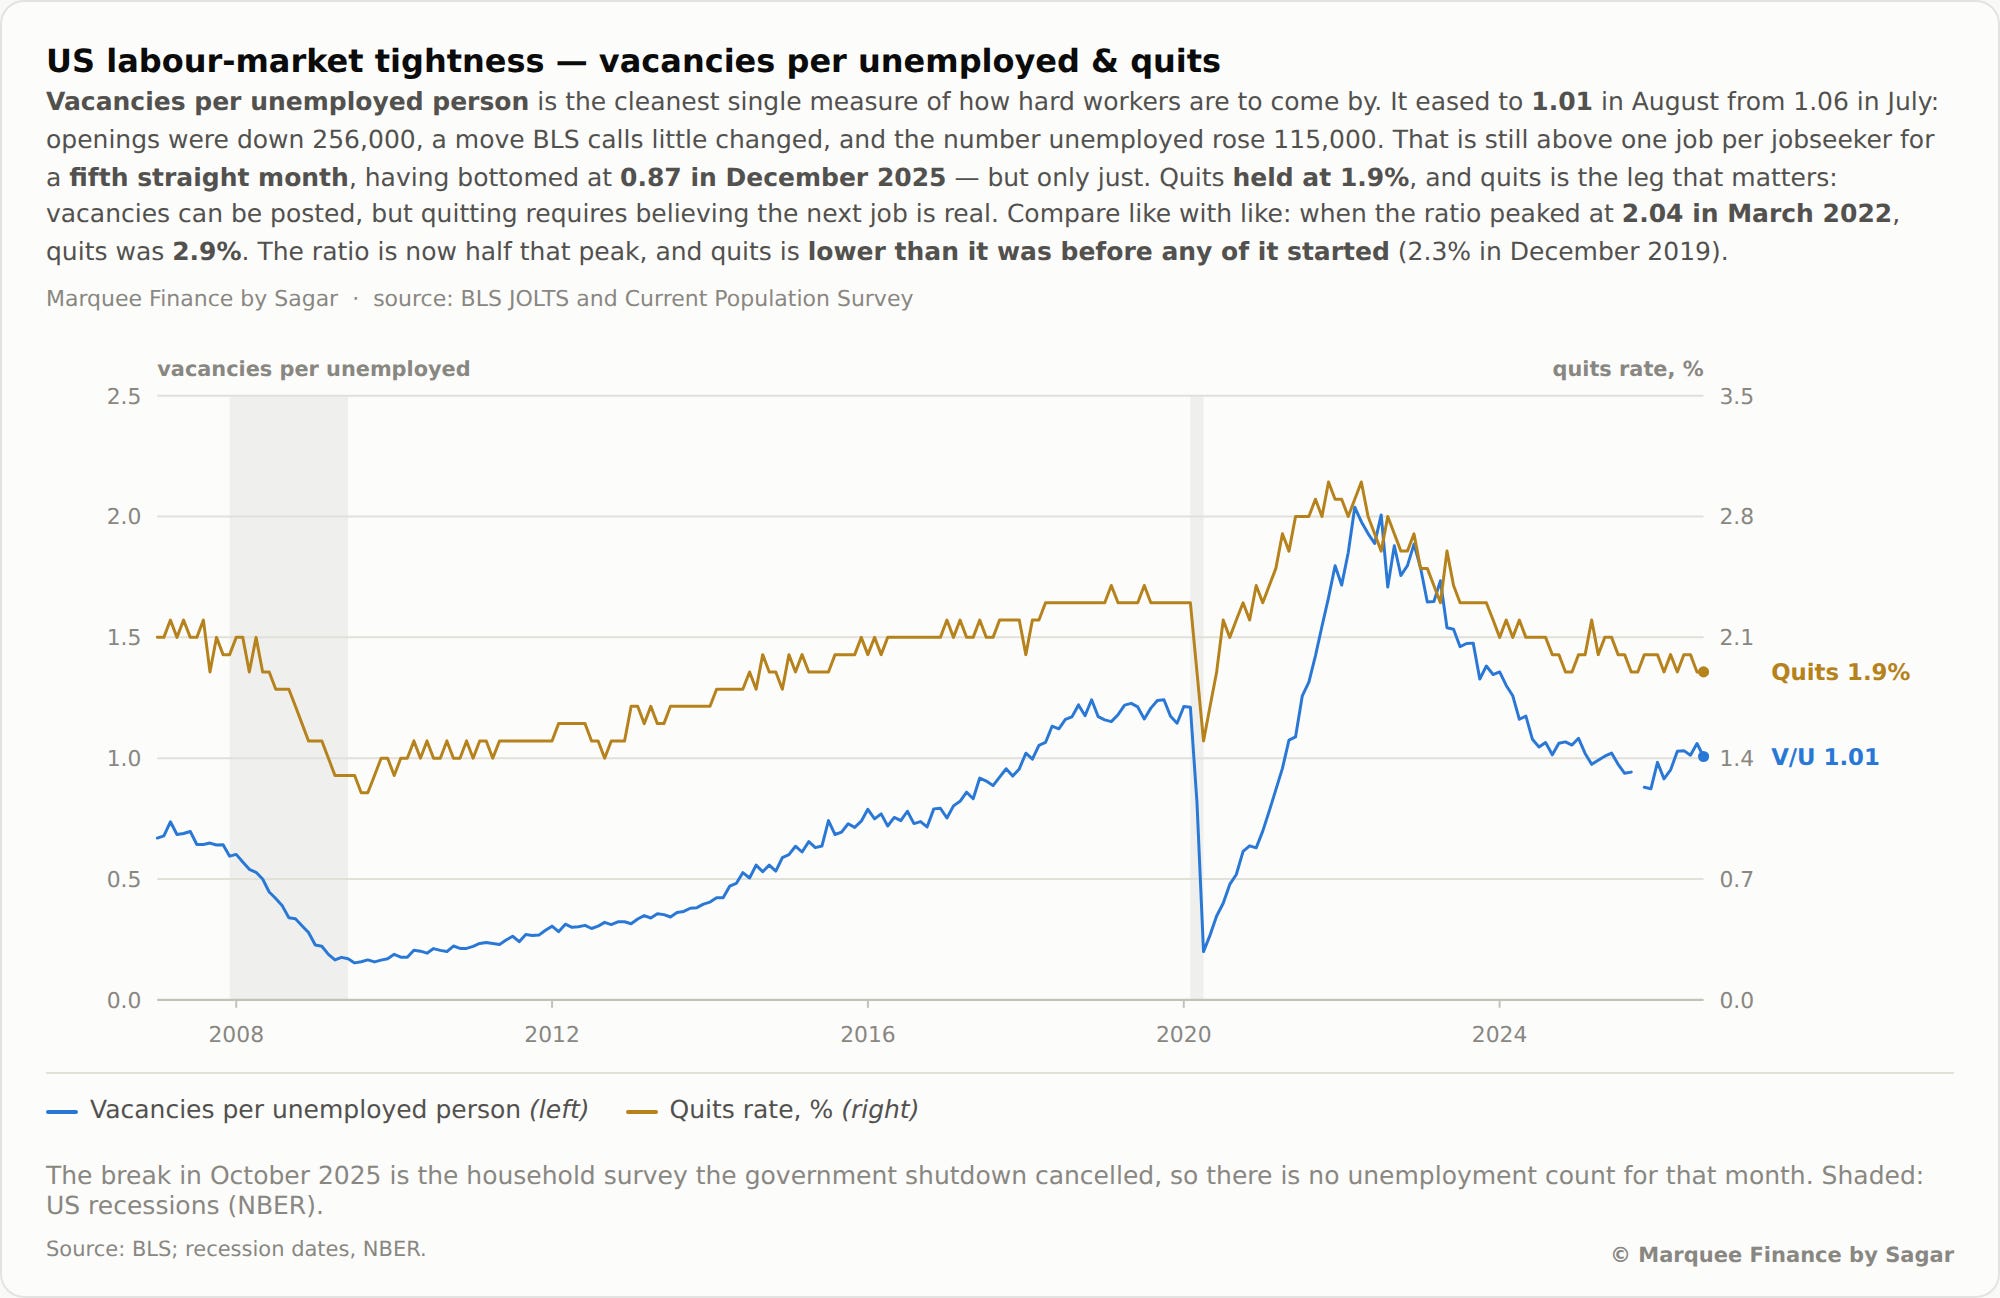
JOLTS-1: The Fed’s preferred labour market indicator is Vacancies/Unemployed. The indicator bottomed out in late 2025 and moved up significantly this year. However, it fell again to 1.01. Watch it carefully; if we move to lows again, expect the bond market to take off the hikes rapidly.
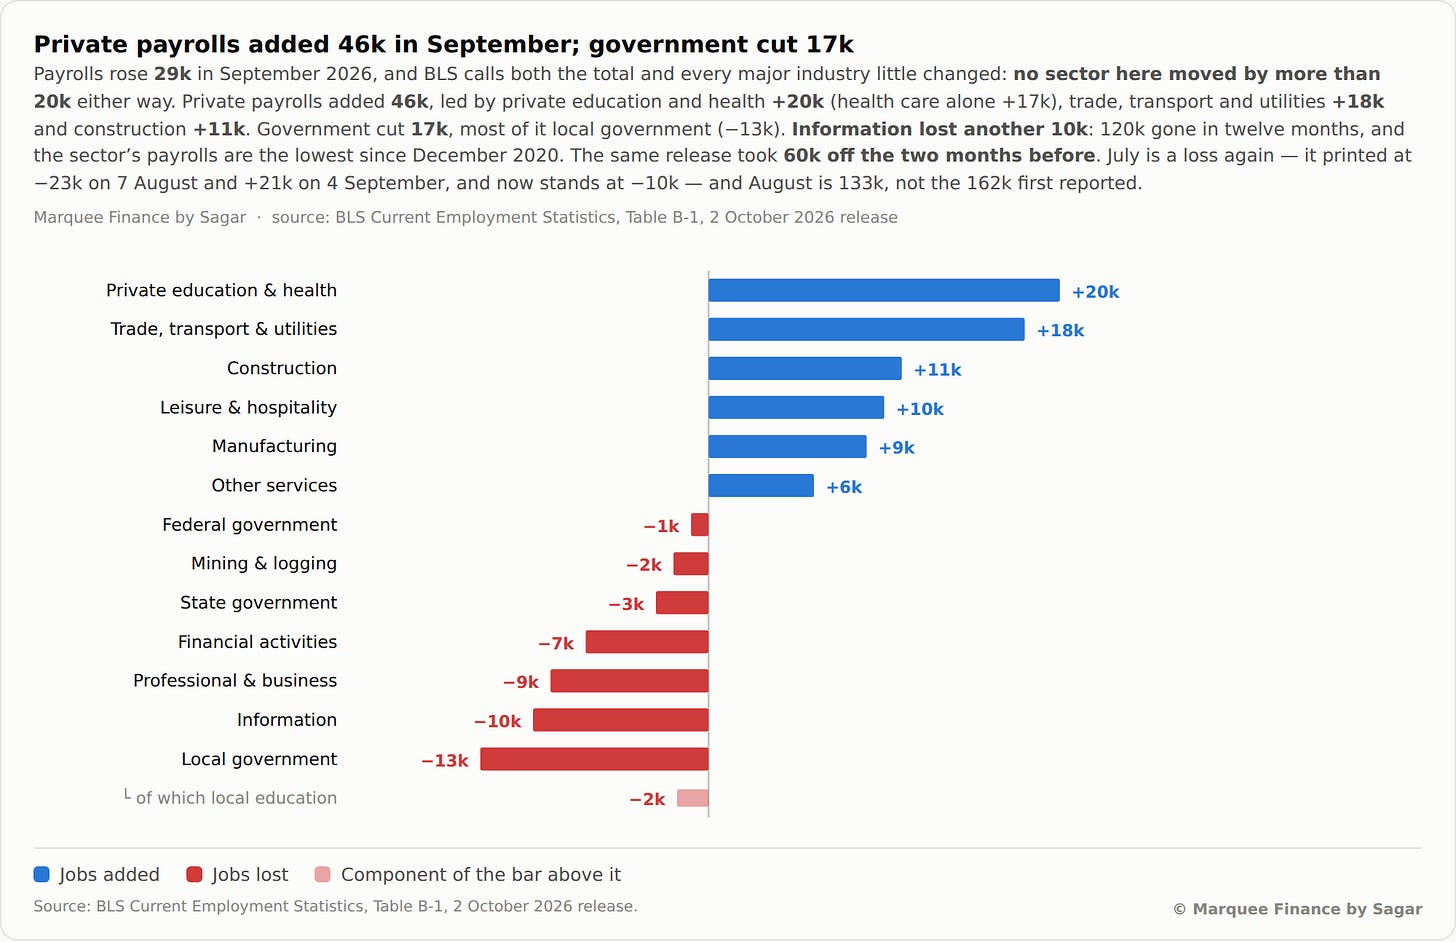
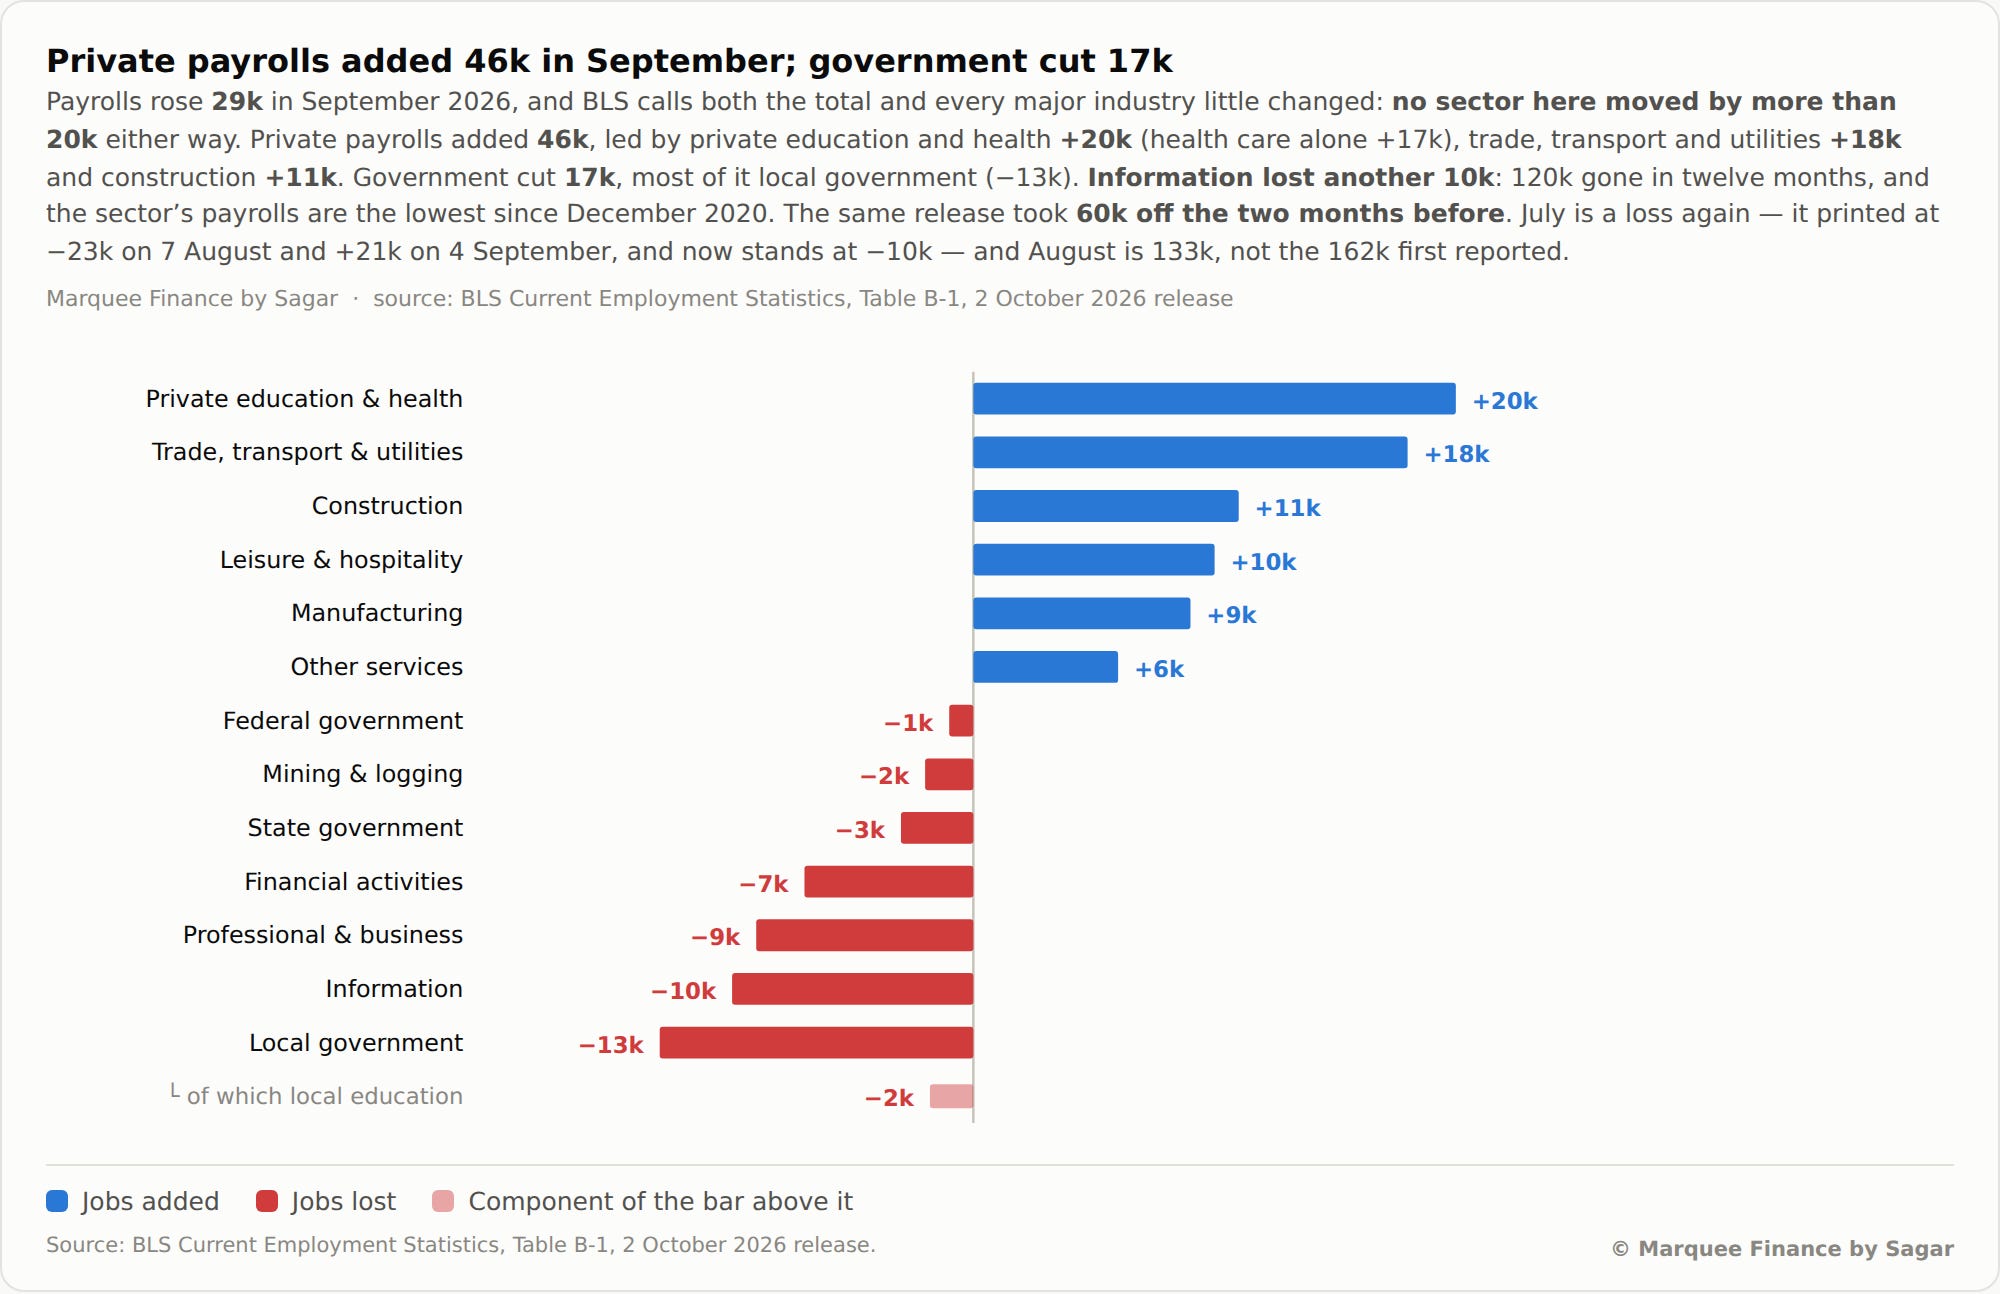
NFP-1: The US economy added 29k jobs in September, significantly below market expectations. Education and health continue to remain the top contributors. The cyclical economy also added jobs and remains robust (construction/ manufacturing). Government, IT, and financial activities continue to shed jobs, a trend visible since the beginning of the year.
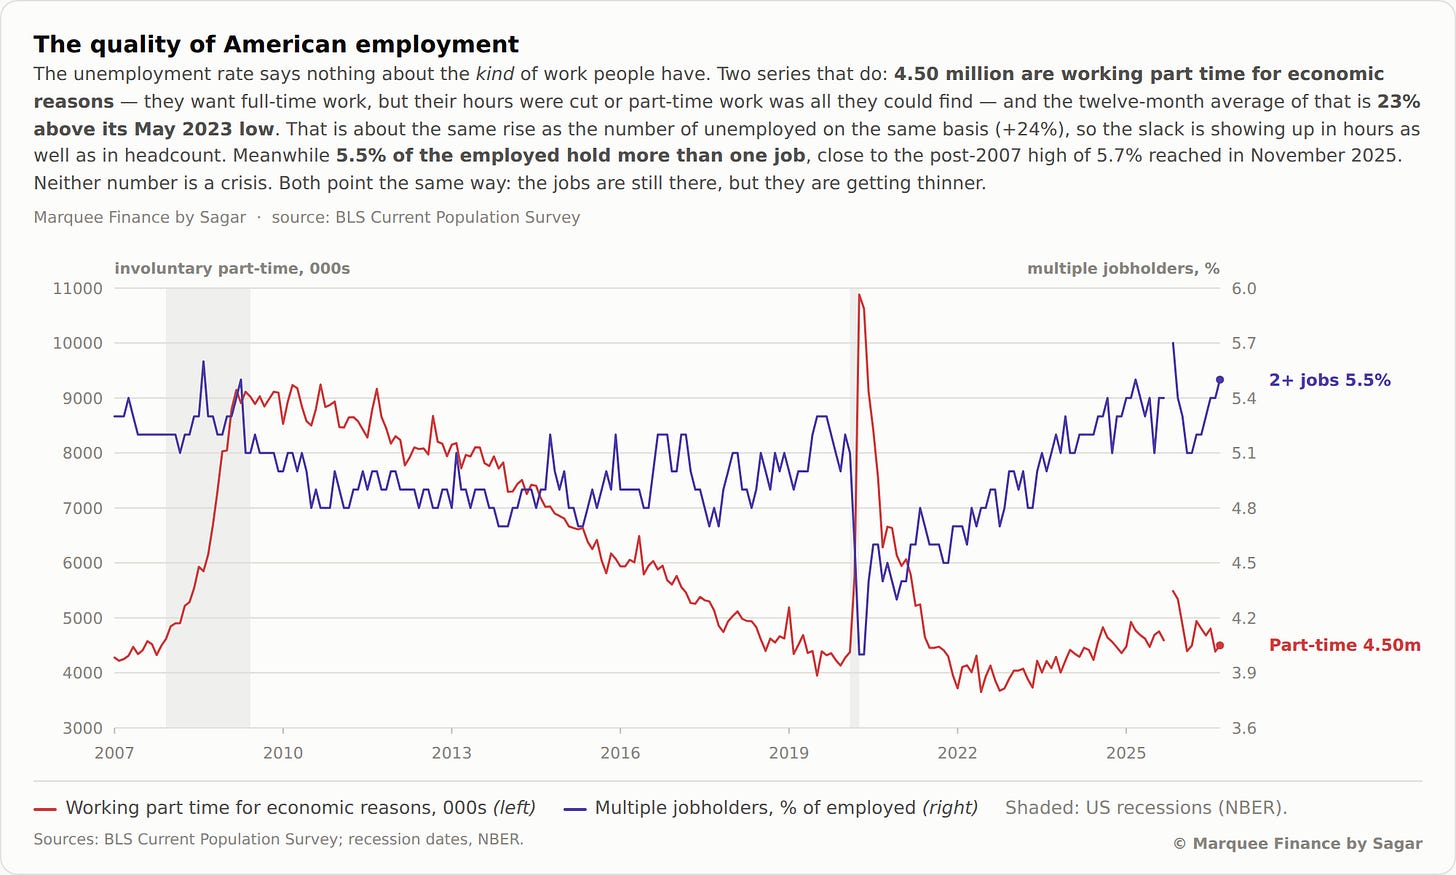
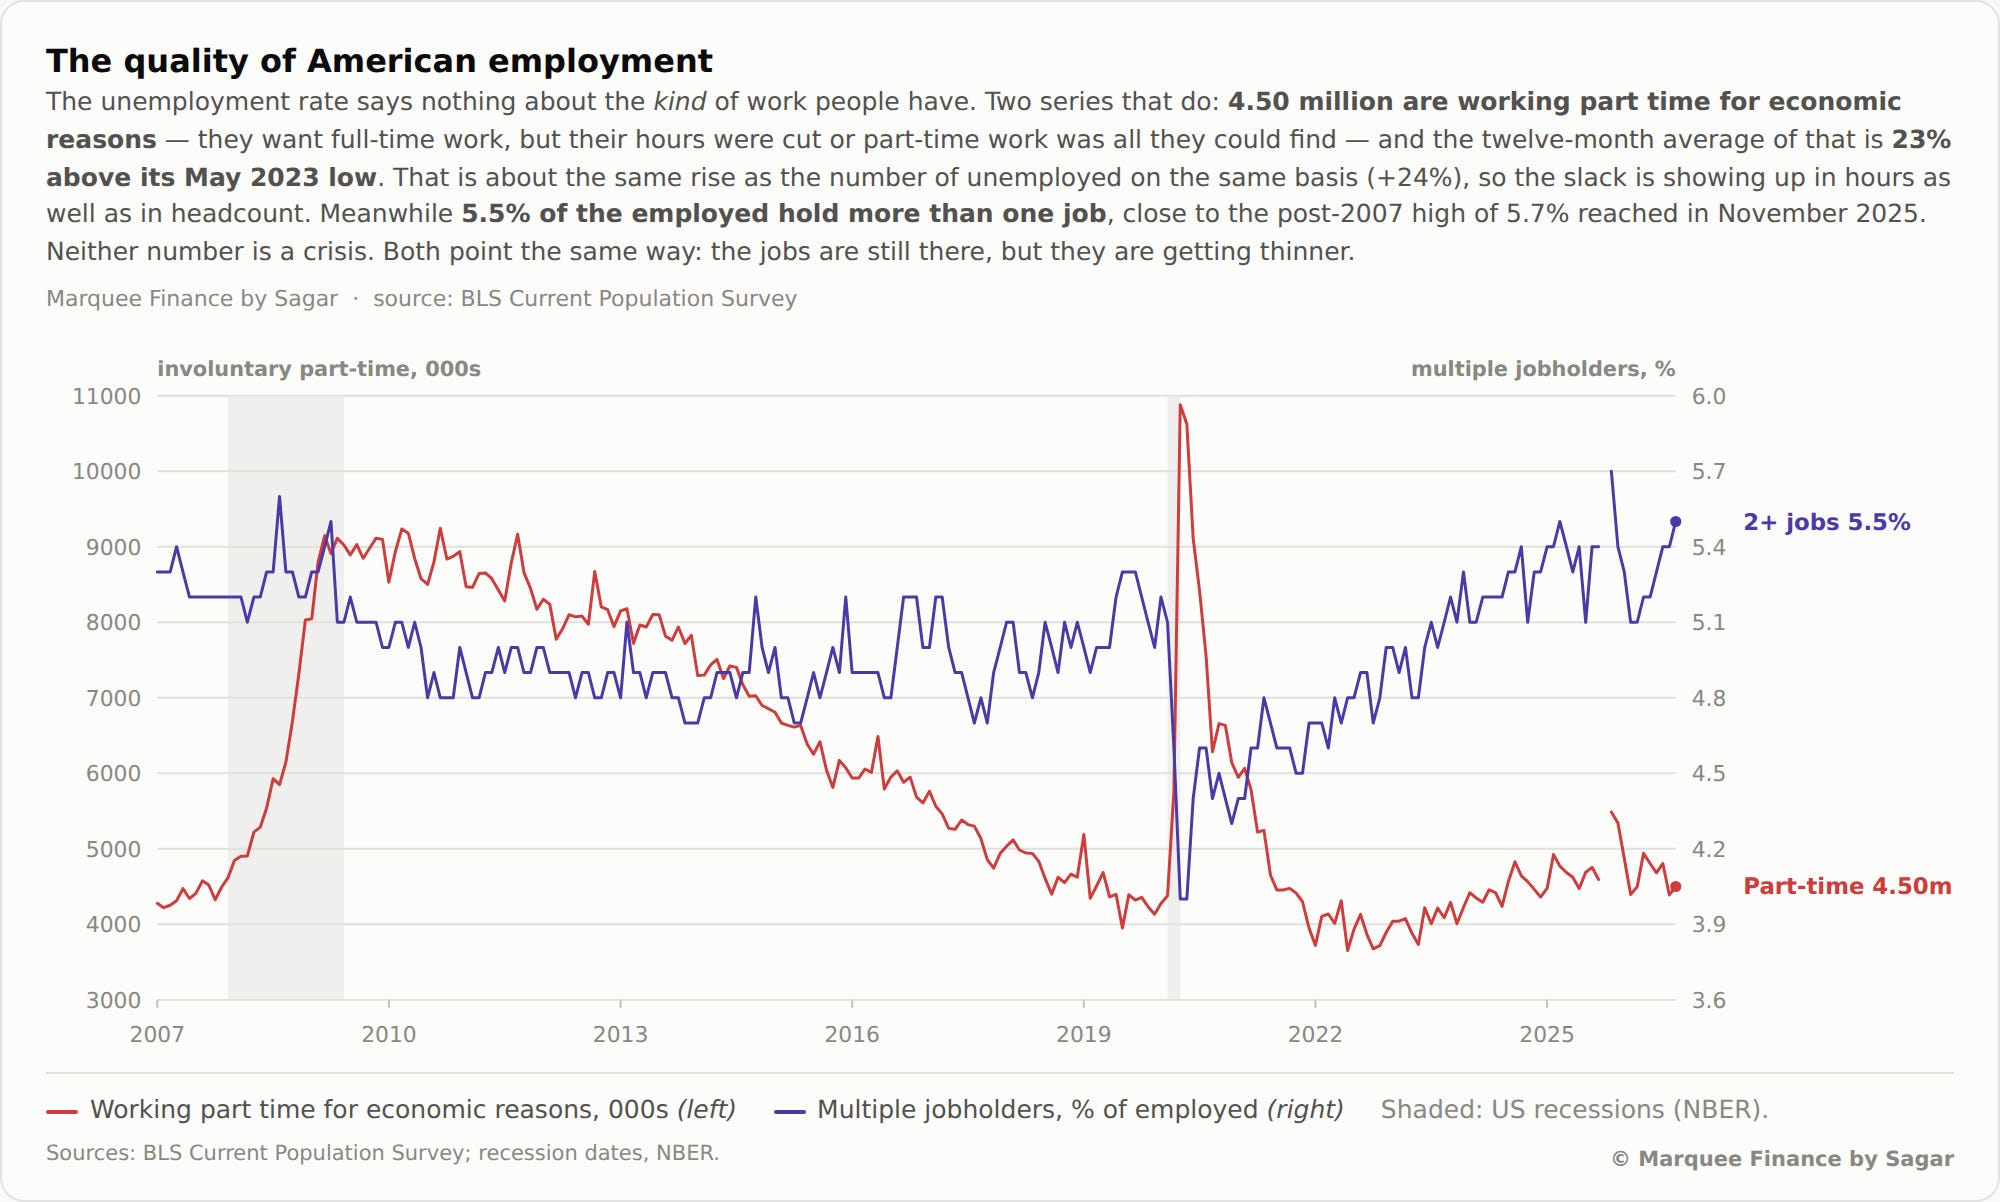
NFP-2: When the labour market deteriorates, part-time jobs rise, and people holding multiple jobs also witness an increase. Nonetheless, the post-COVID inflationary wave has led people in the bottom income decile to take on multiple jobs to sustain their standard of living. Furthermore, the “side hustle” culture and multiple work avenues in the AI era have led people to take on multiple jobs. Nevertheless, if the trend continues and we reach 6% (multiple jobholders), it will be cause for concern.
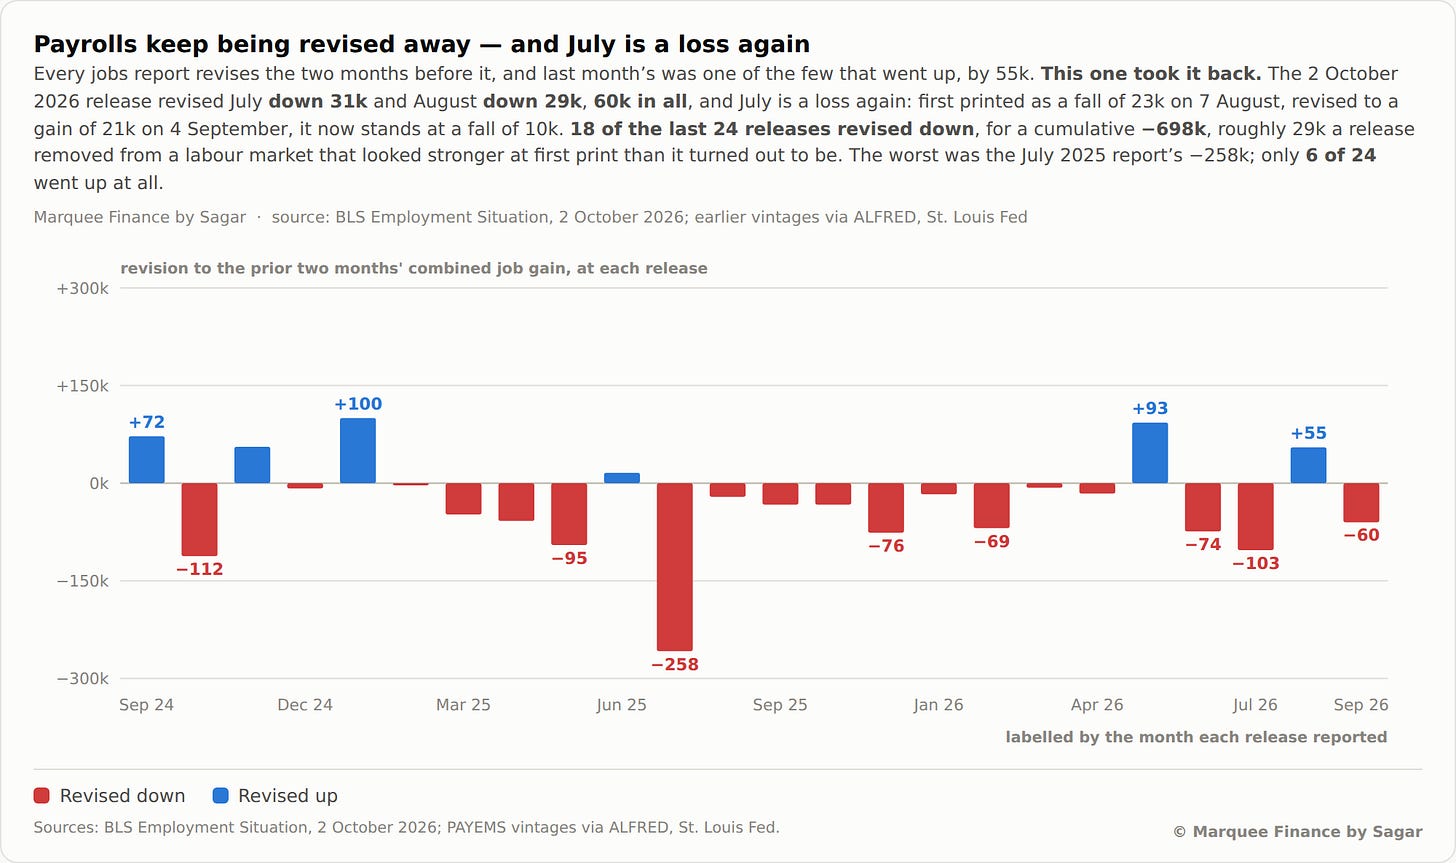
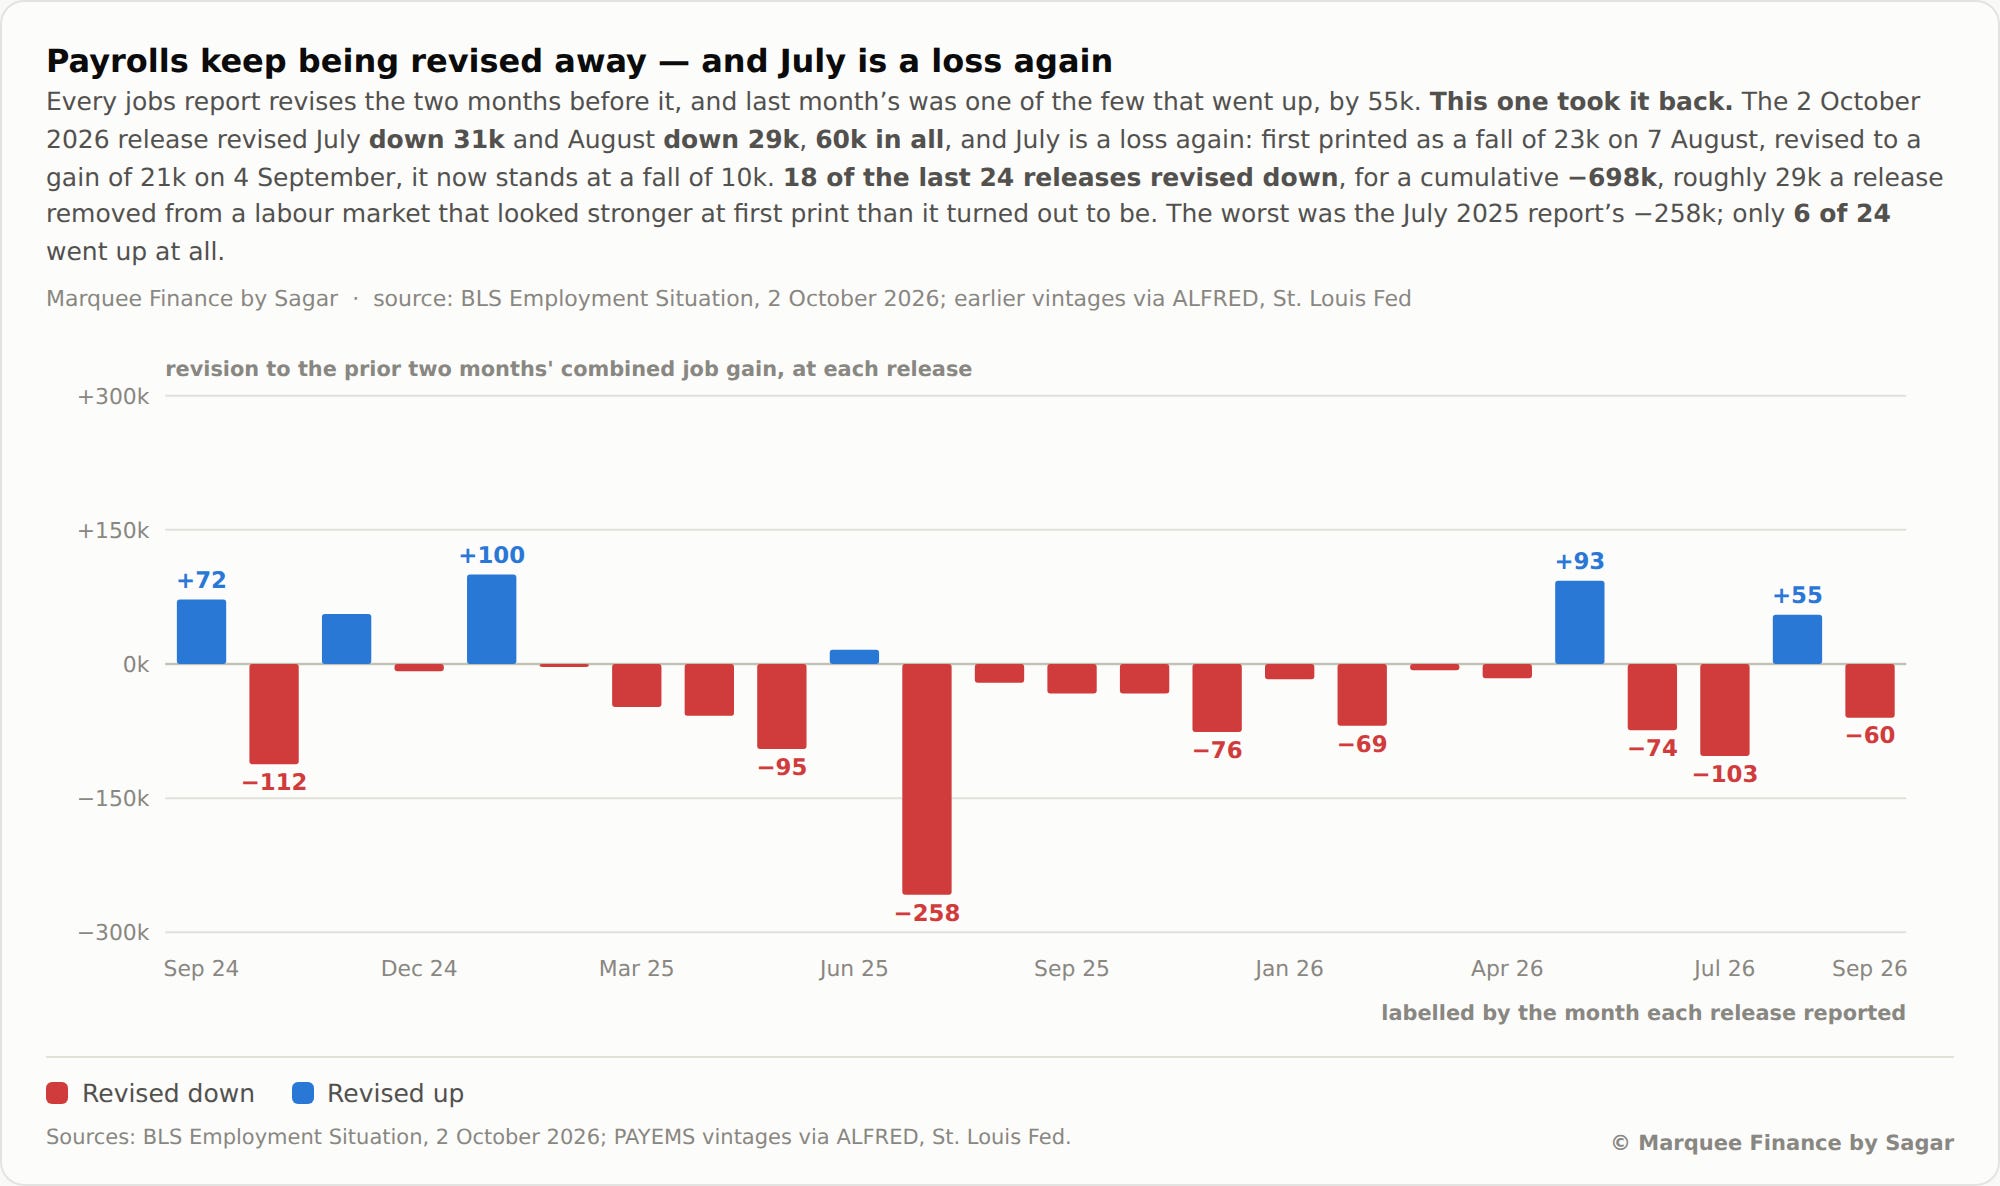
NFP-4: Not only was the headline number weaker, but the downward revisions were also stark. Total revisions over July and August came in at 60k. Notably, 18 of the last 24 releases were revised down, as the labour market is bogged down by structural factors such as a halt in illegal immigration (resulting in breakeven moving down from 150k to 25-30k)
Equities!
SPX!
Bulls have been defending the 7610/20 levels vigorously.
However, they haven’t been able to pull the index to fresh ATHs despite repeated attempts, so the consolidation continues.
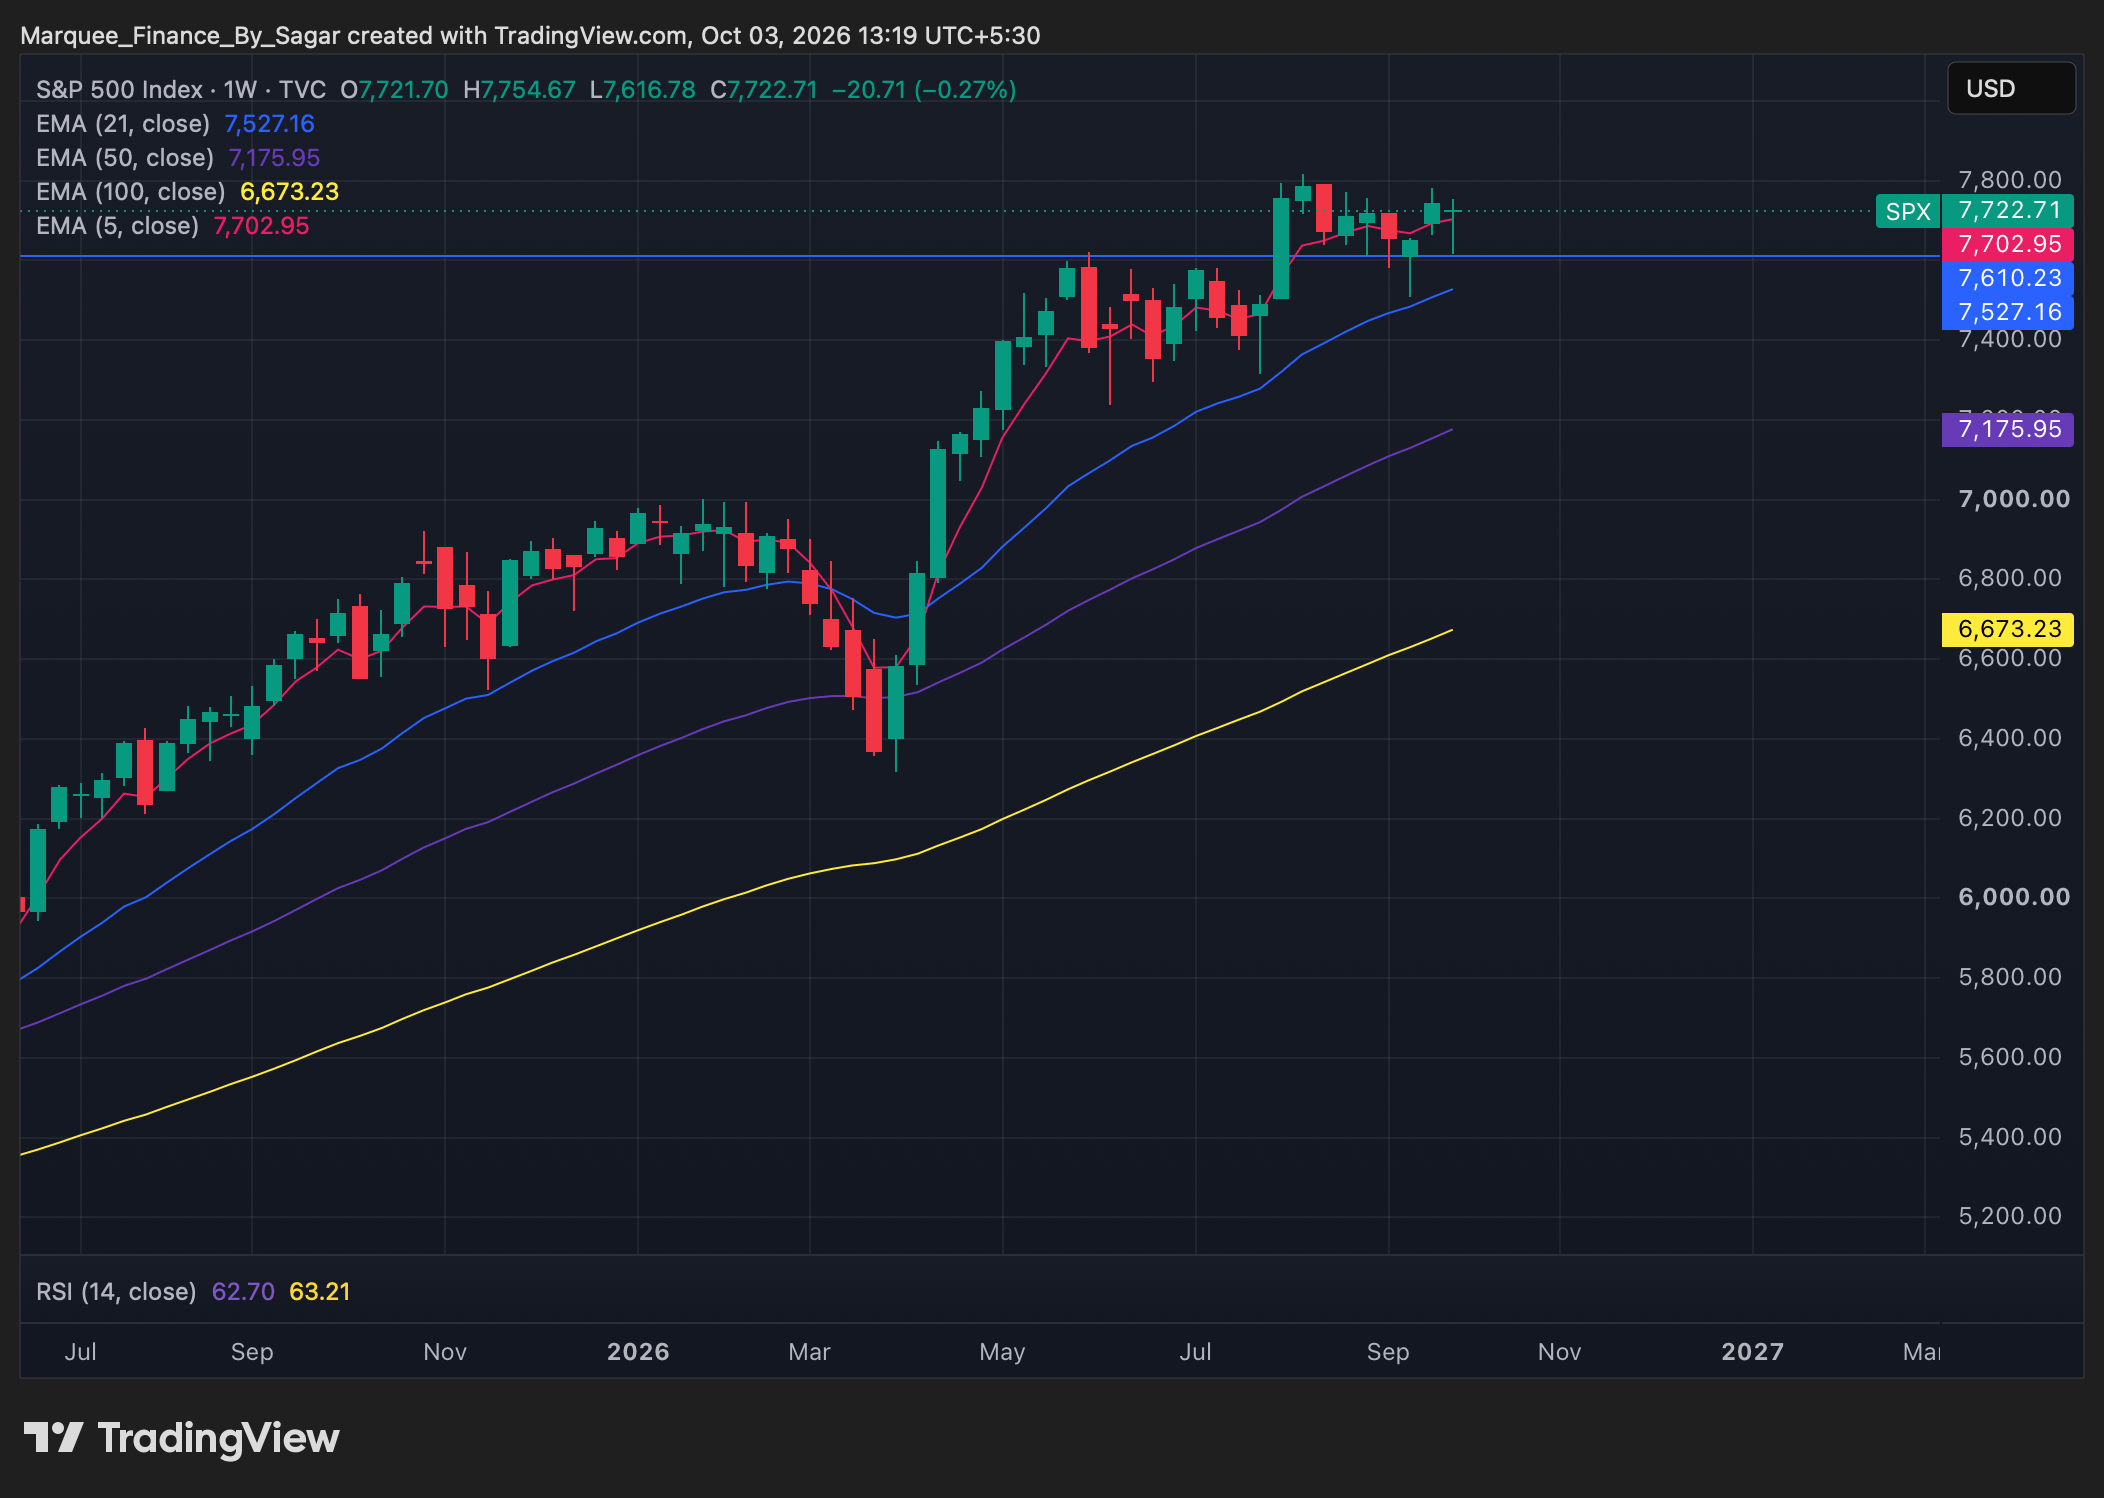
Yesterday in the chat section, we shared the following chart: