
"Giant Liquidity Sucking Trade"!

We are witnessing unprecedented price action across global cross-asset markets, with liquidity flowing towards a particular “asset” class as the corporate world spends trillions of dollars on the AI rollout.
In a mind-blowing stat, yesterday was the fourth time in “HISTORY” when the S&P 500 hit a record high while 5% of its members fell to 52-week lows.
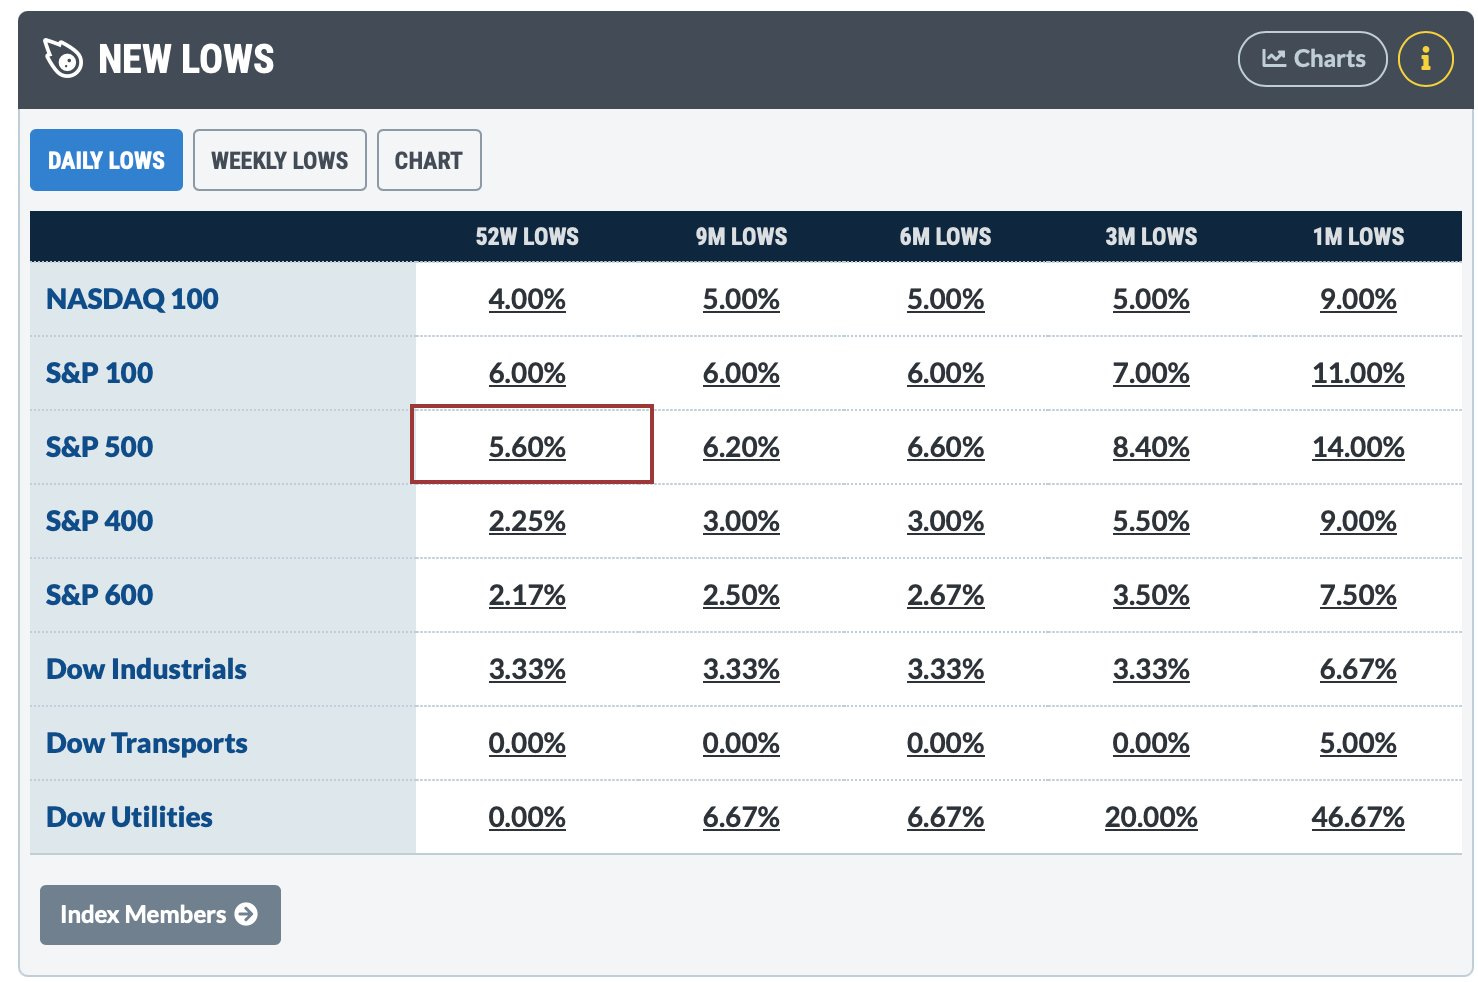
The last three episodes transpired in:
July 1929
January 1973
December 1999
Even in the coveted Mag7 (TSLA replaced by AVGO), there has been a significant disparity, with only three stocks outperforming the tech index (QQQ) since the vertical rally began on 30th March.
We were lucky to own one of the stocks as part of our exposure to the US tech ecosystem.
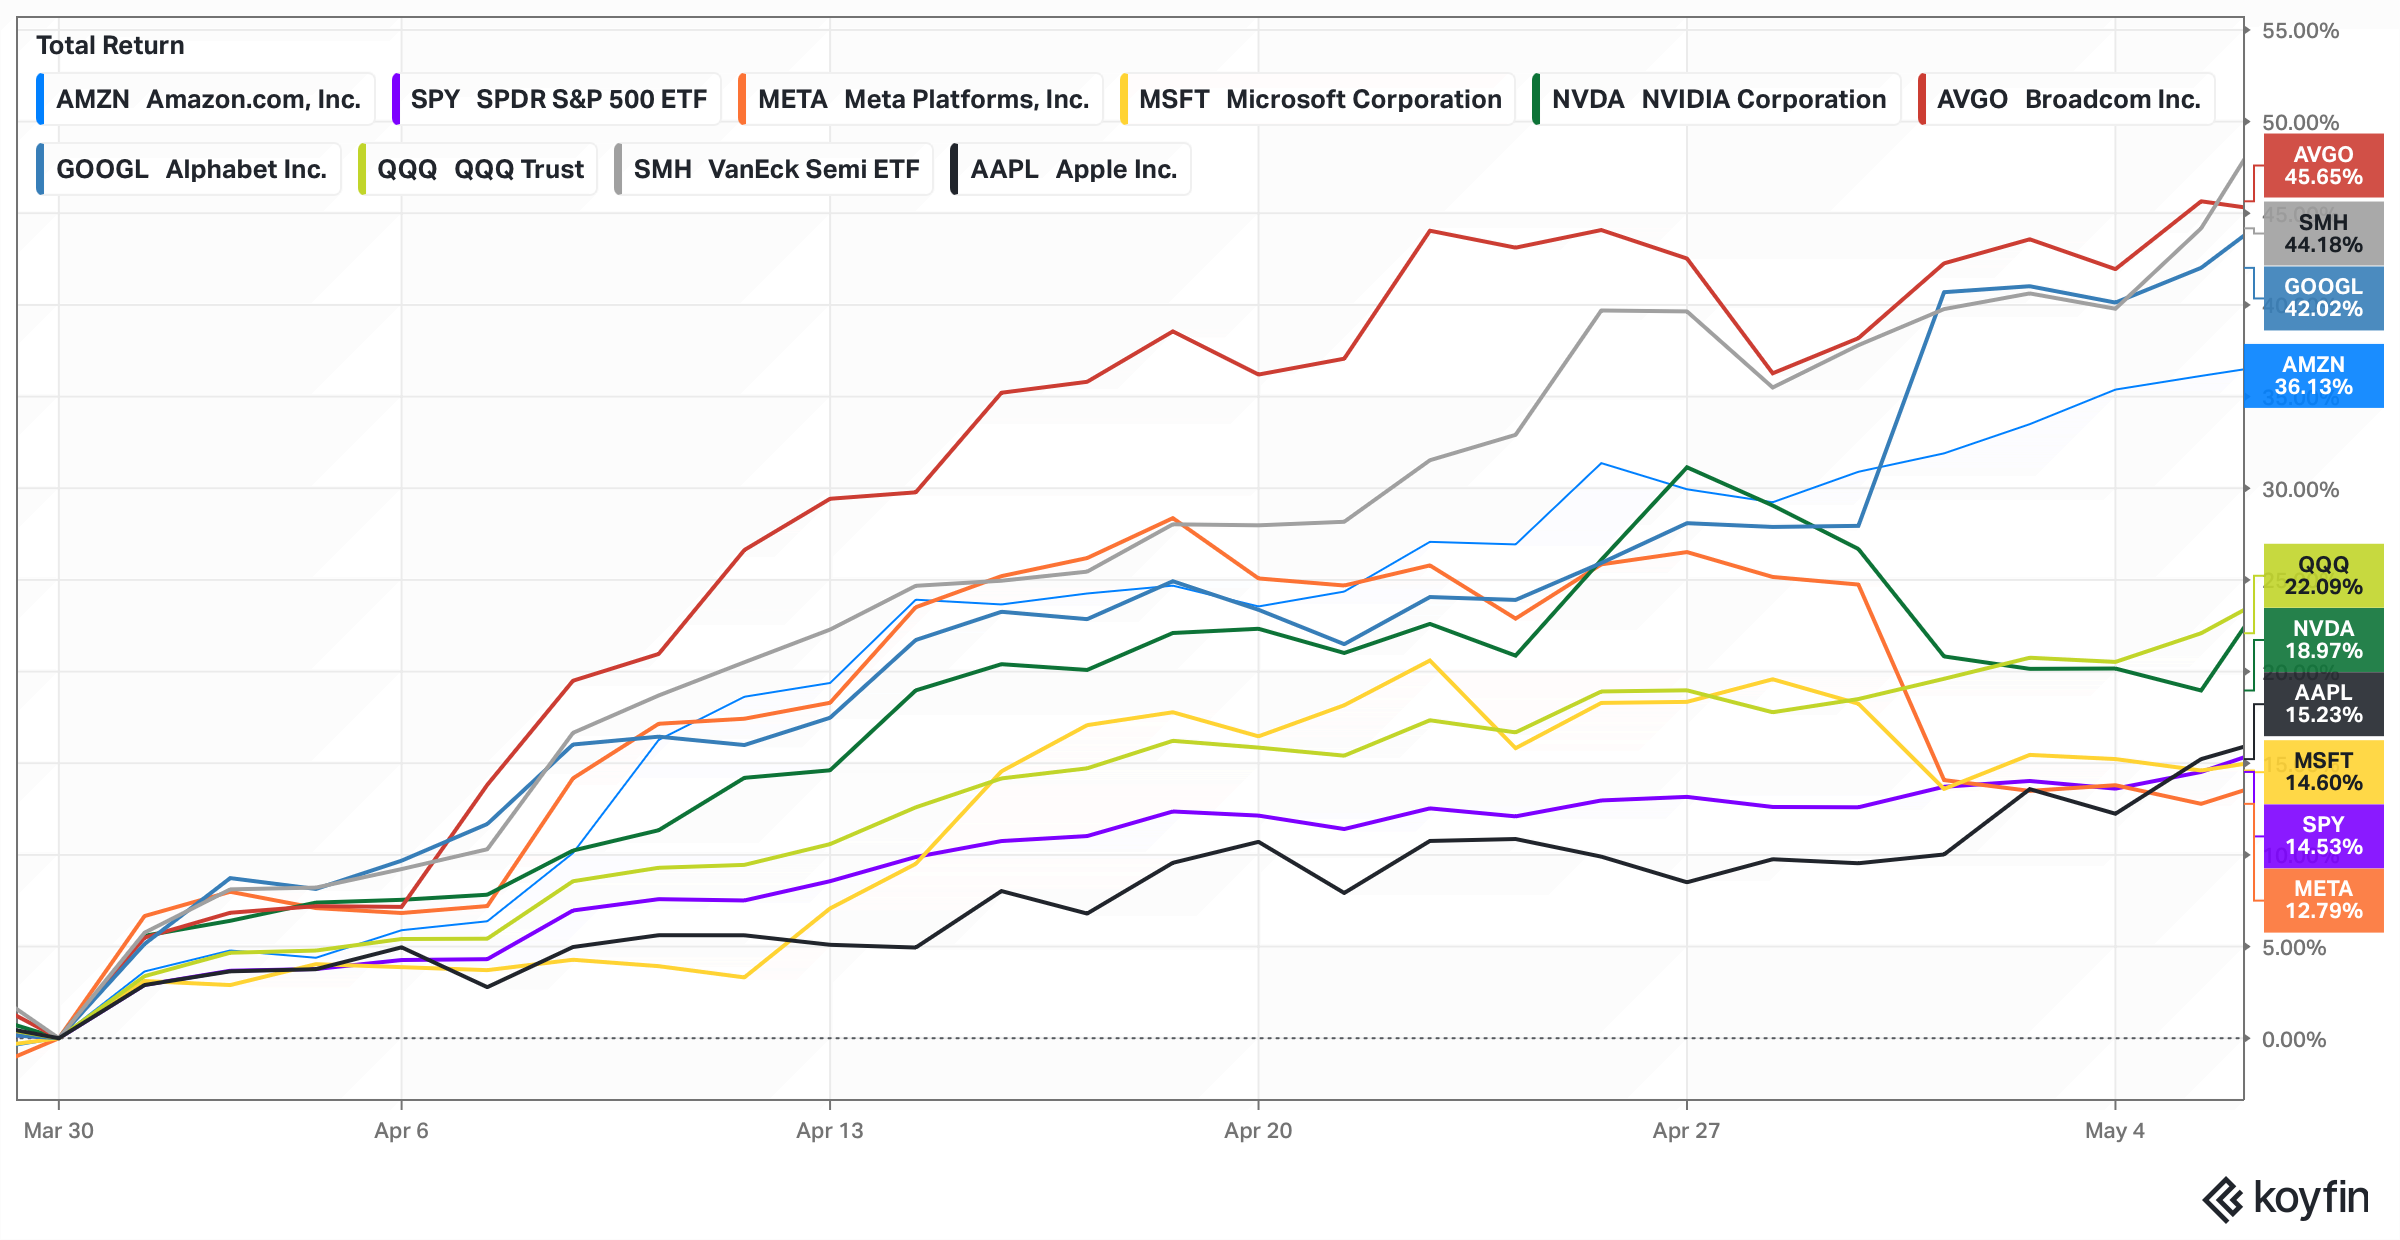
Thus, if you have had low exposure/underweight stance to the semis/hardware as an active investor/fund manager, you would have undoubtedly underperformed the benchmark.
Unsurprisingly, half of the S&P 500's returns since the rally began are attributable to only 5 stocks.
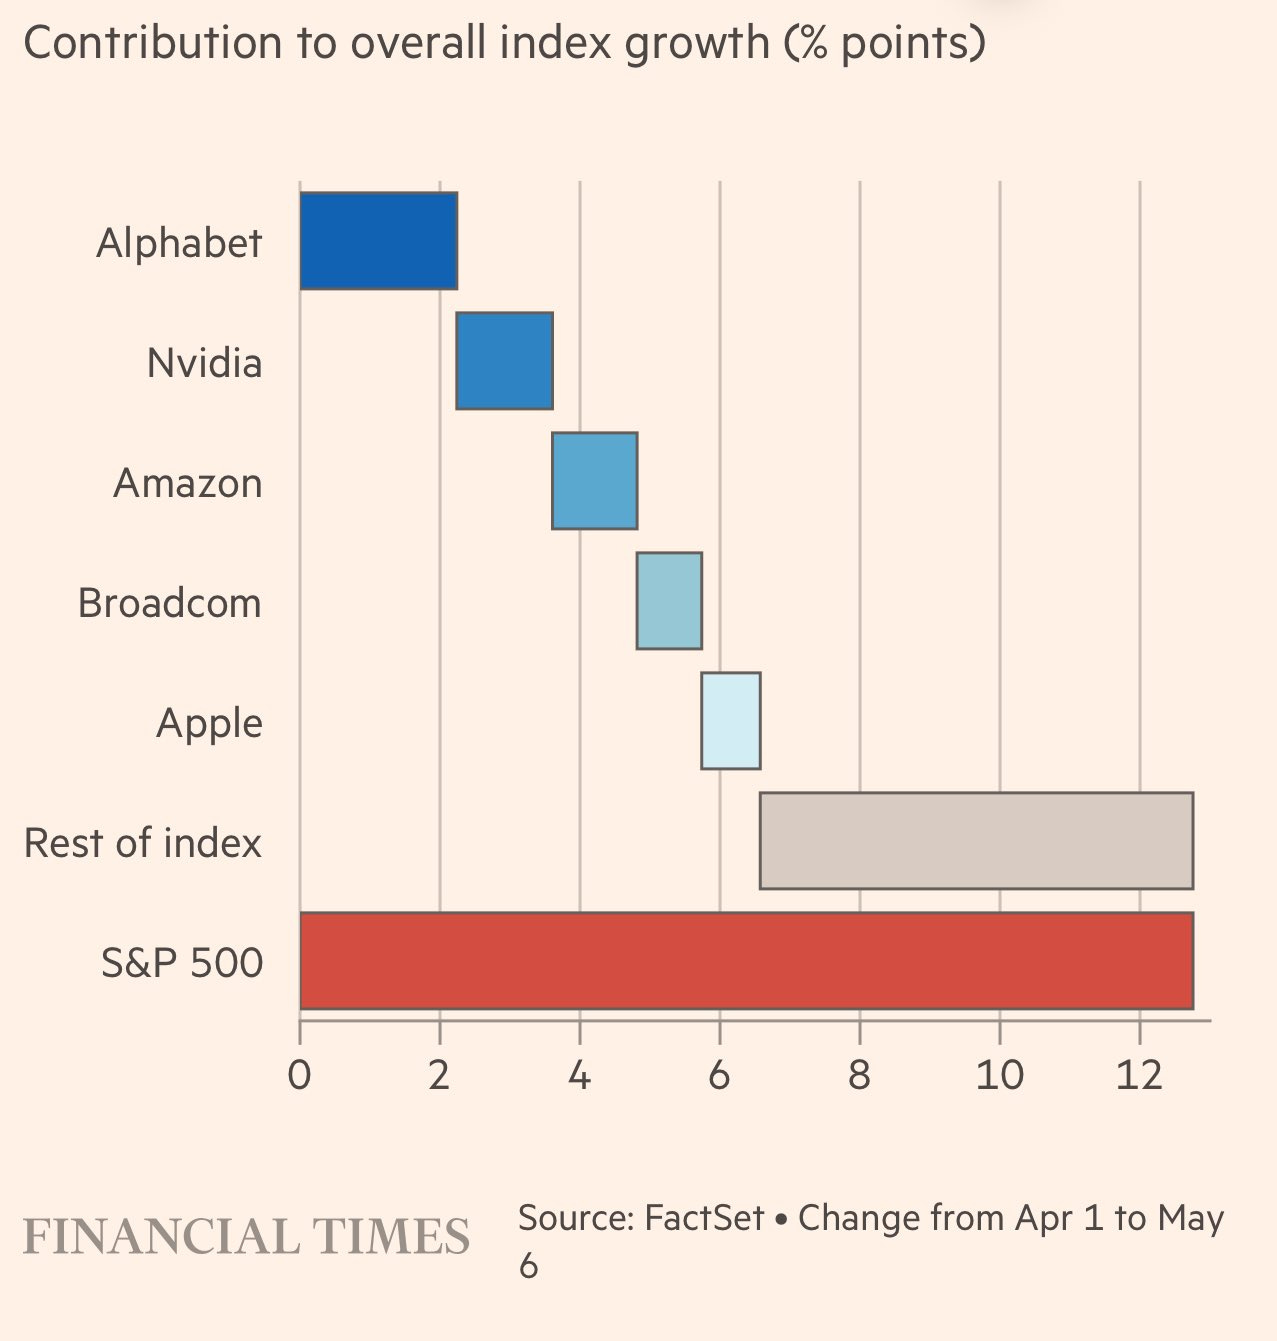
While today it may look like “nothing stops this mega semiconductor rally,” we believe that parabolas always end the same way (we will discuss this in detail later).
We are underperforming the benchmark by 100 bps despite allocating significant cash and being overweight US equities, given the nature of the rally we have witnessed since 31st March (and especially last week).
As discussed, even outside the US, we have seen the rally spearheaded by only a handful of chip stocks in Taiwan, Korea and Japan. Everything else has underperformed, and if you have been running a well-diversified portfolio, there is a high probability that you would have underperformed the benchmark.
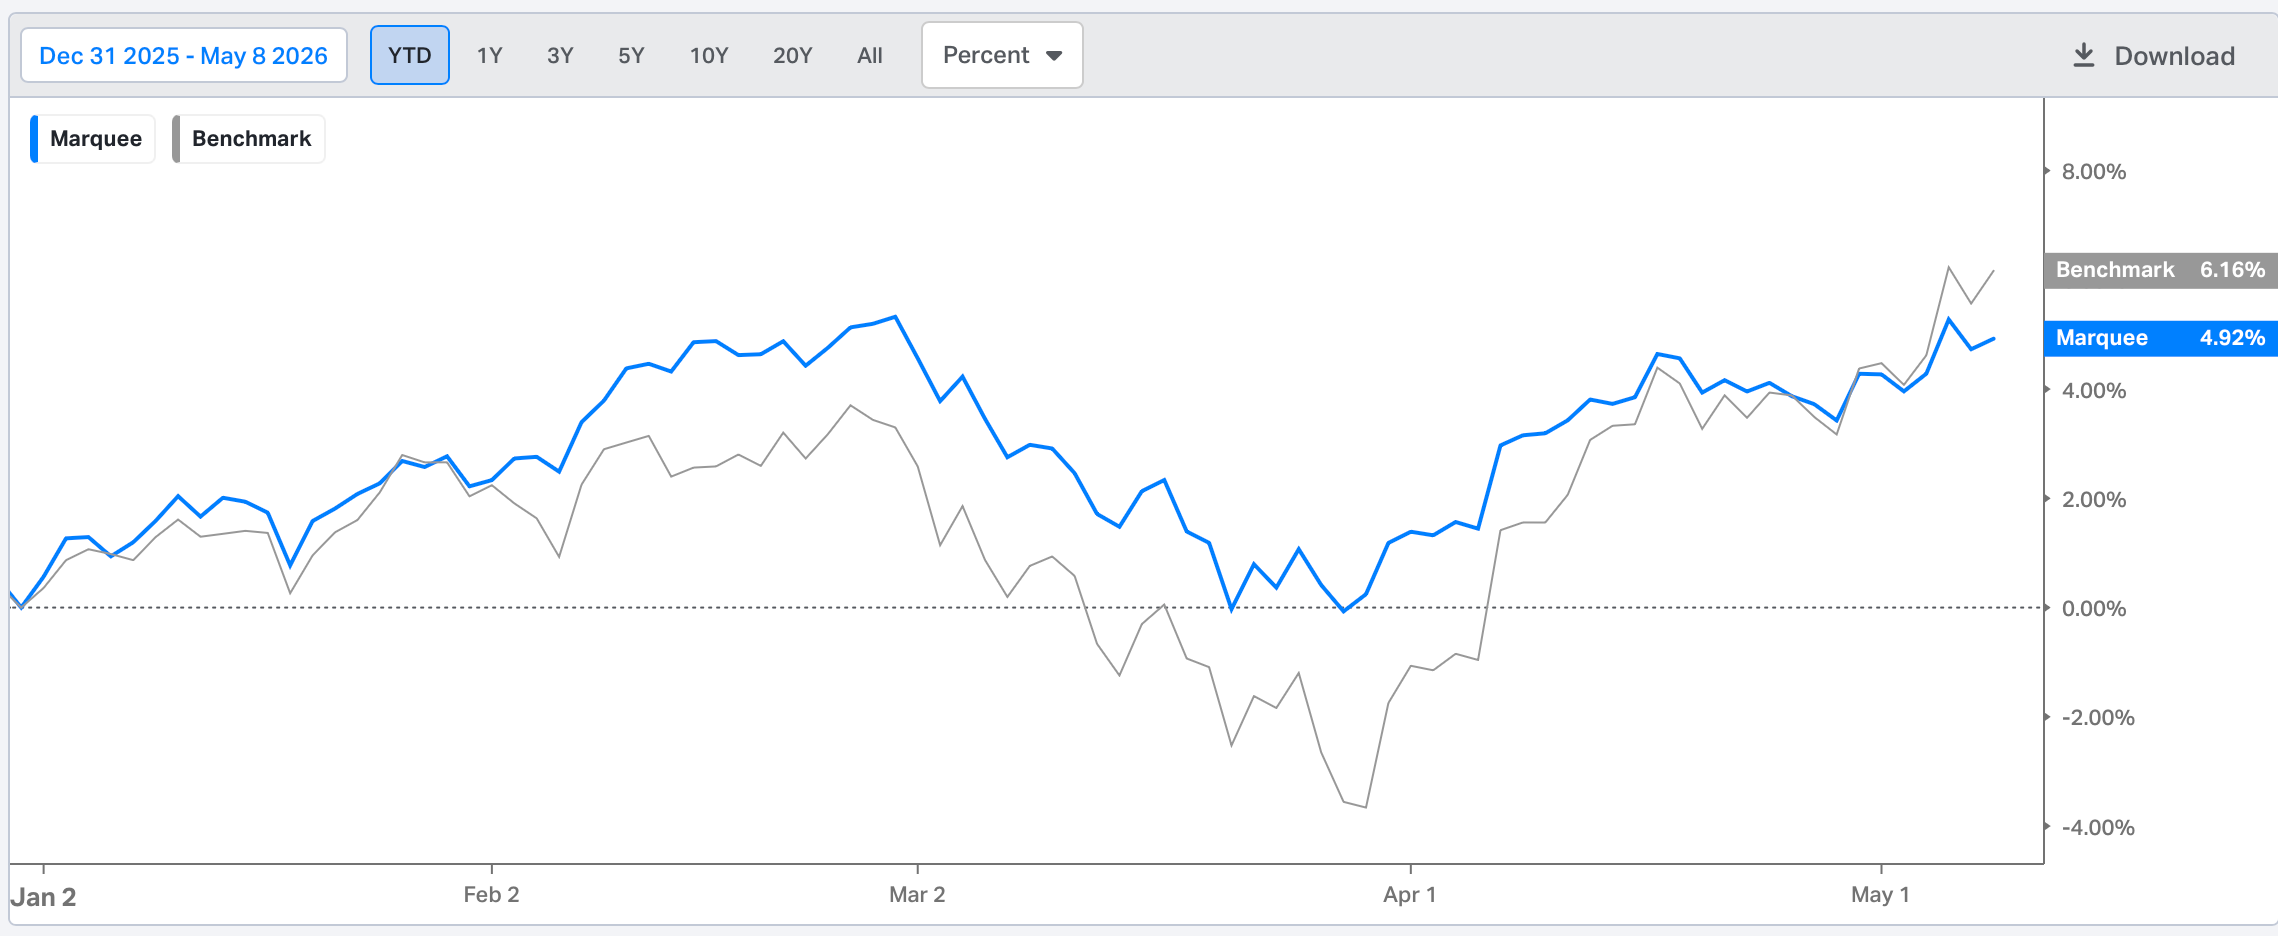
Nevertheless, we remain confident of outperformance in the medium term as we believe that fundamentals (macro) will catch up sooner rather than later.
Let’s take a deep dive into the macro universe and comprehend the cross-asset moves!
US/Equities/Bonds/Oil/Dollar/Gold/Copper/BTC!
This week, the ISM Services report was released, with the headline figure at 53.6, compared with the expected 53.7.
The sub-components showed no significant surprises; however, New Orders declined markedly compared to March.
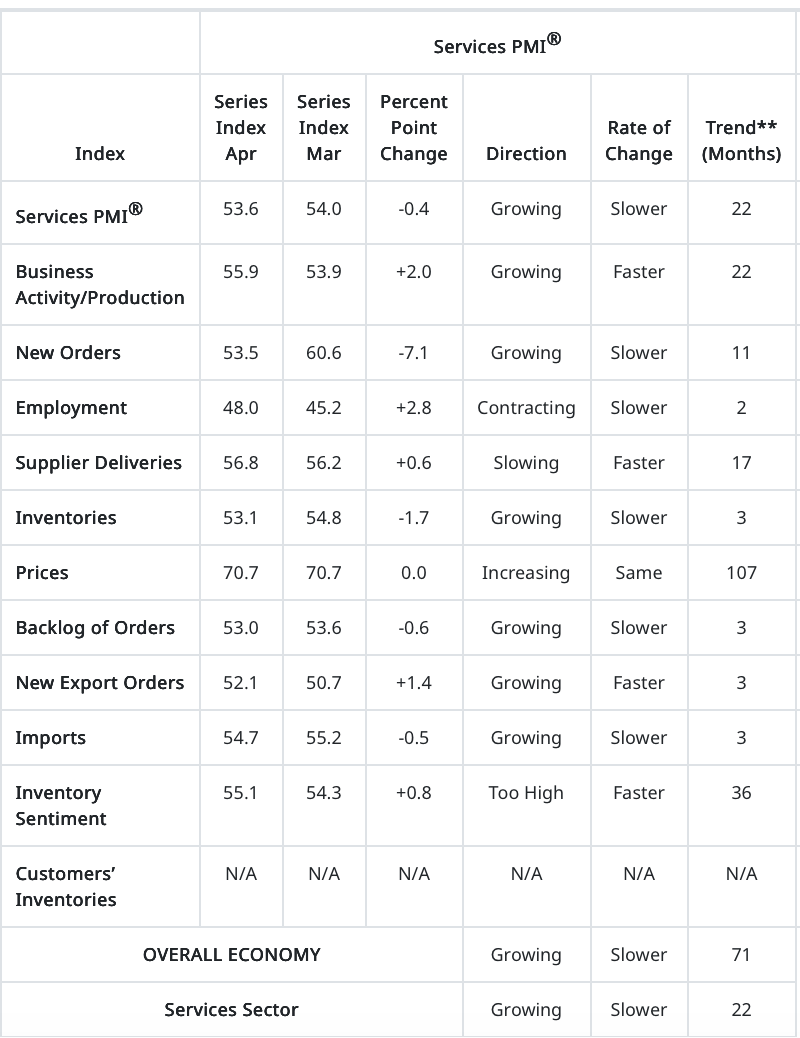
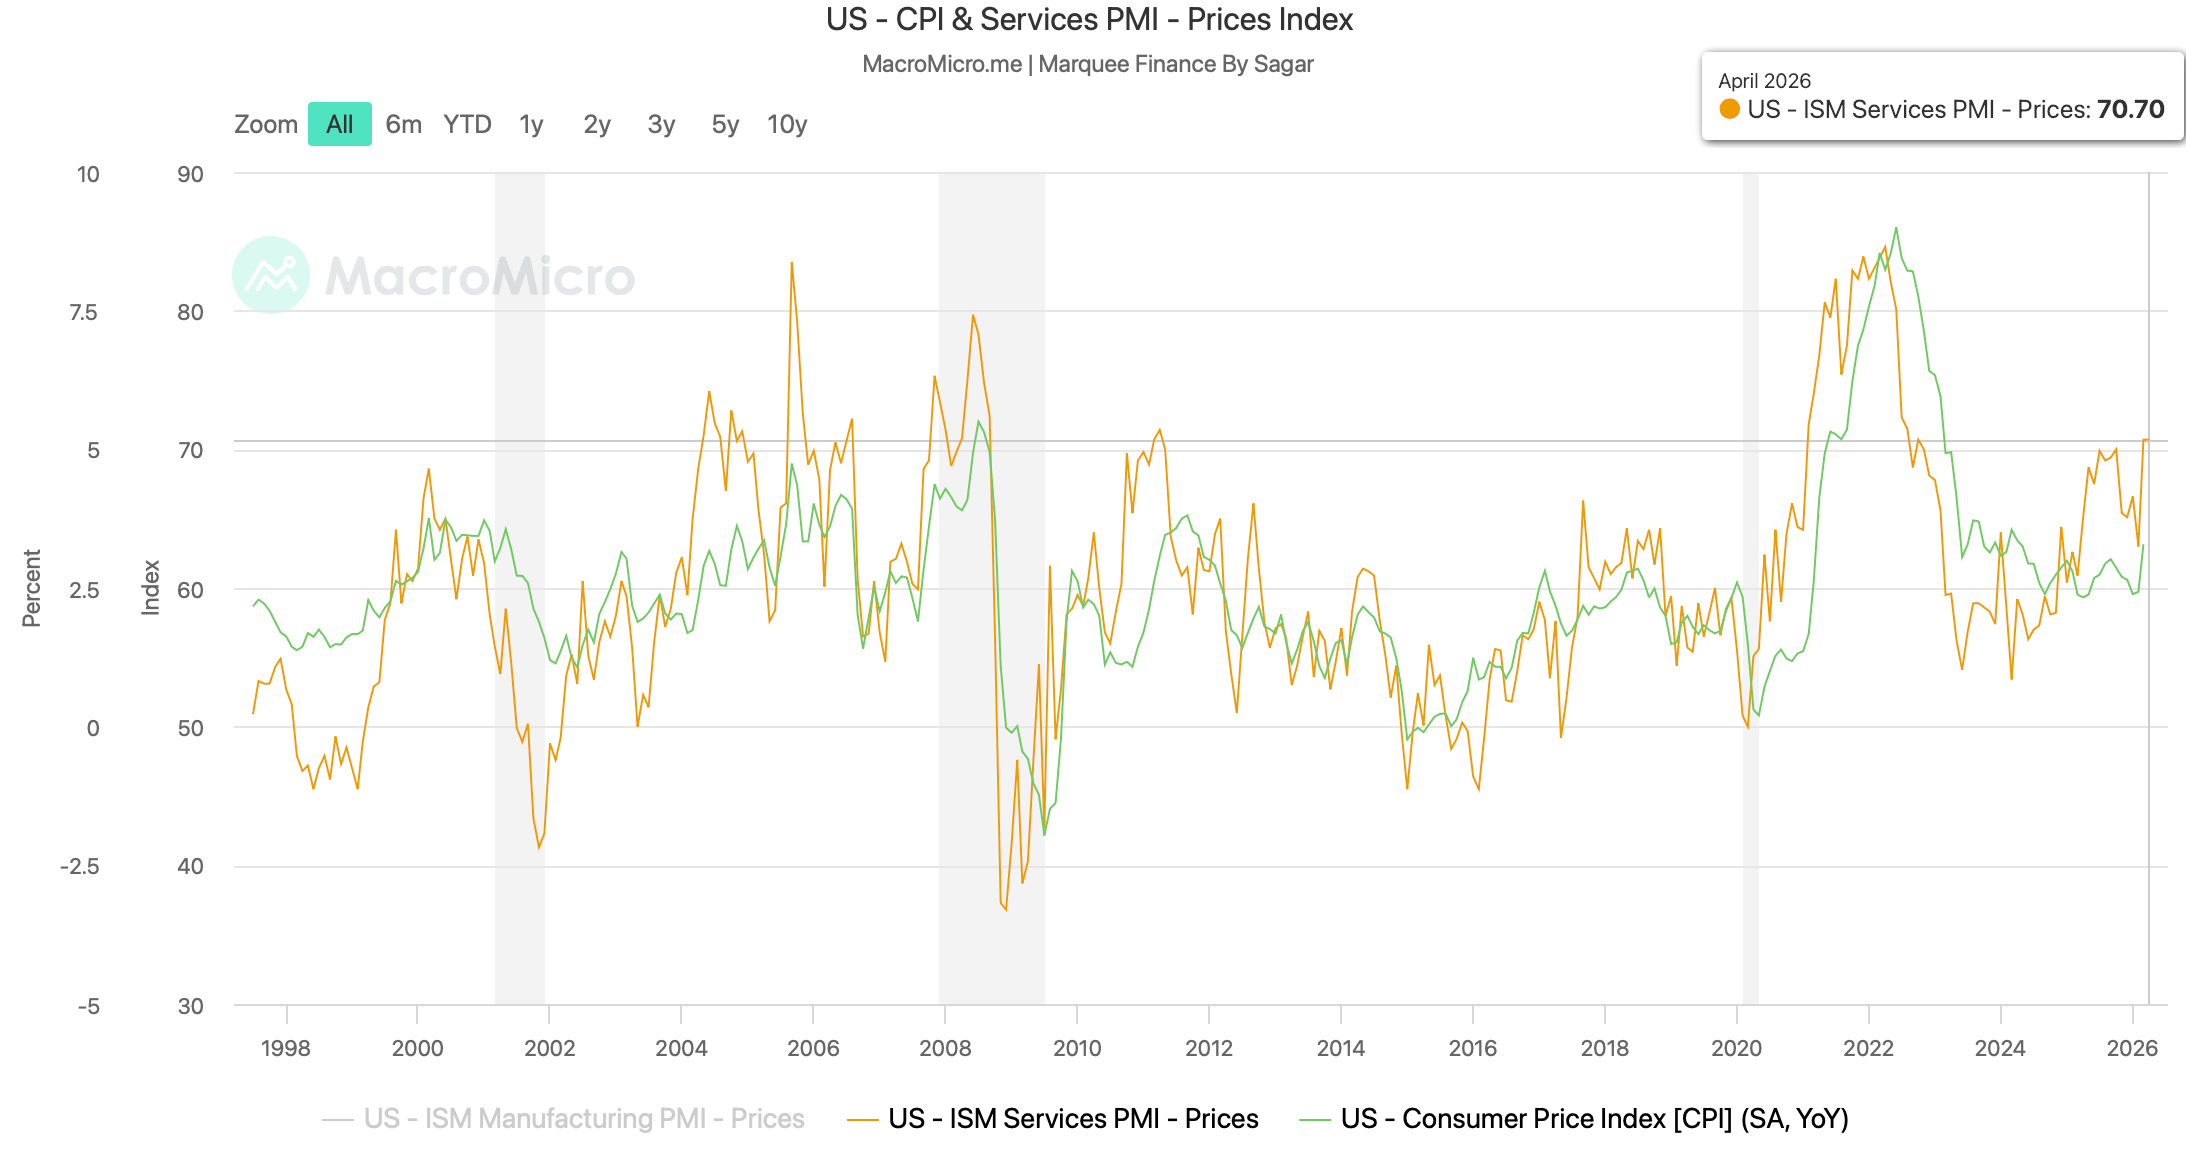
The ISM Services Prices Paid is one of the components which we track closely, as it has a tight correlation with the CPI.
Although there was no increase in the ISM Services Prices Paid (70.70) compared to last month, it remains at a multi-year high.
As a result, we expect the CPI to gradually rise above 4%.
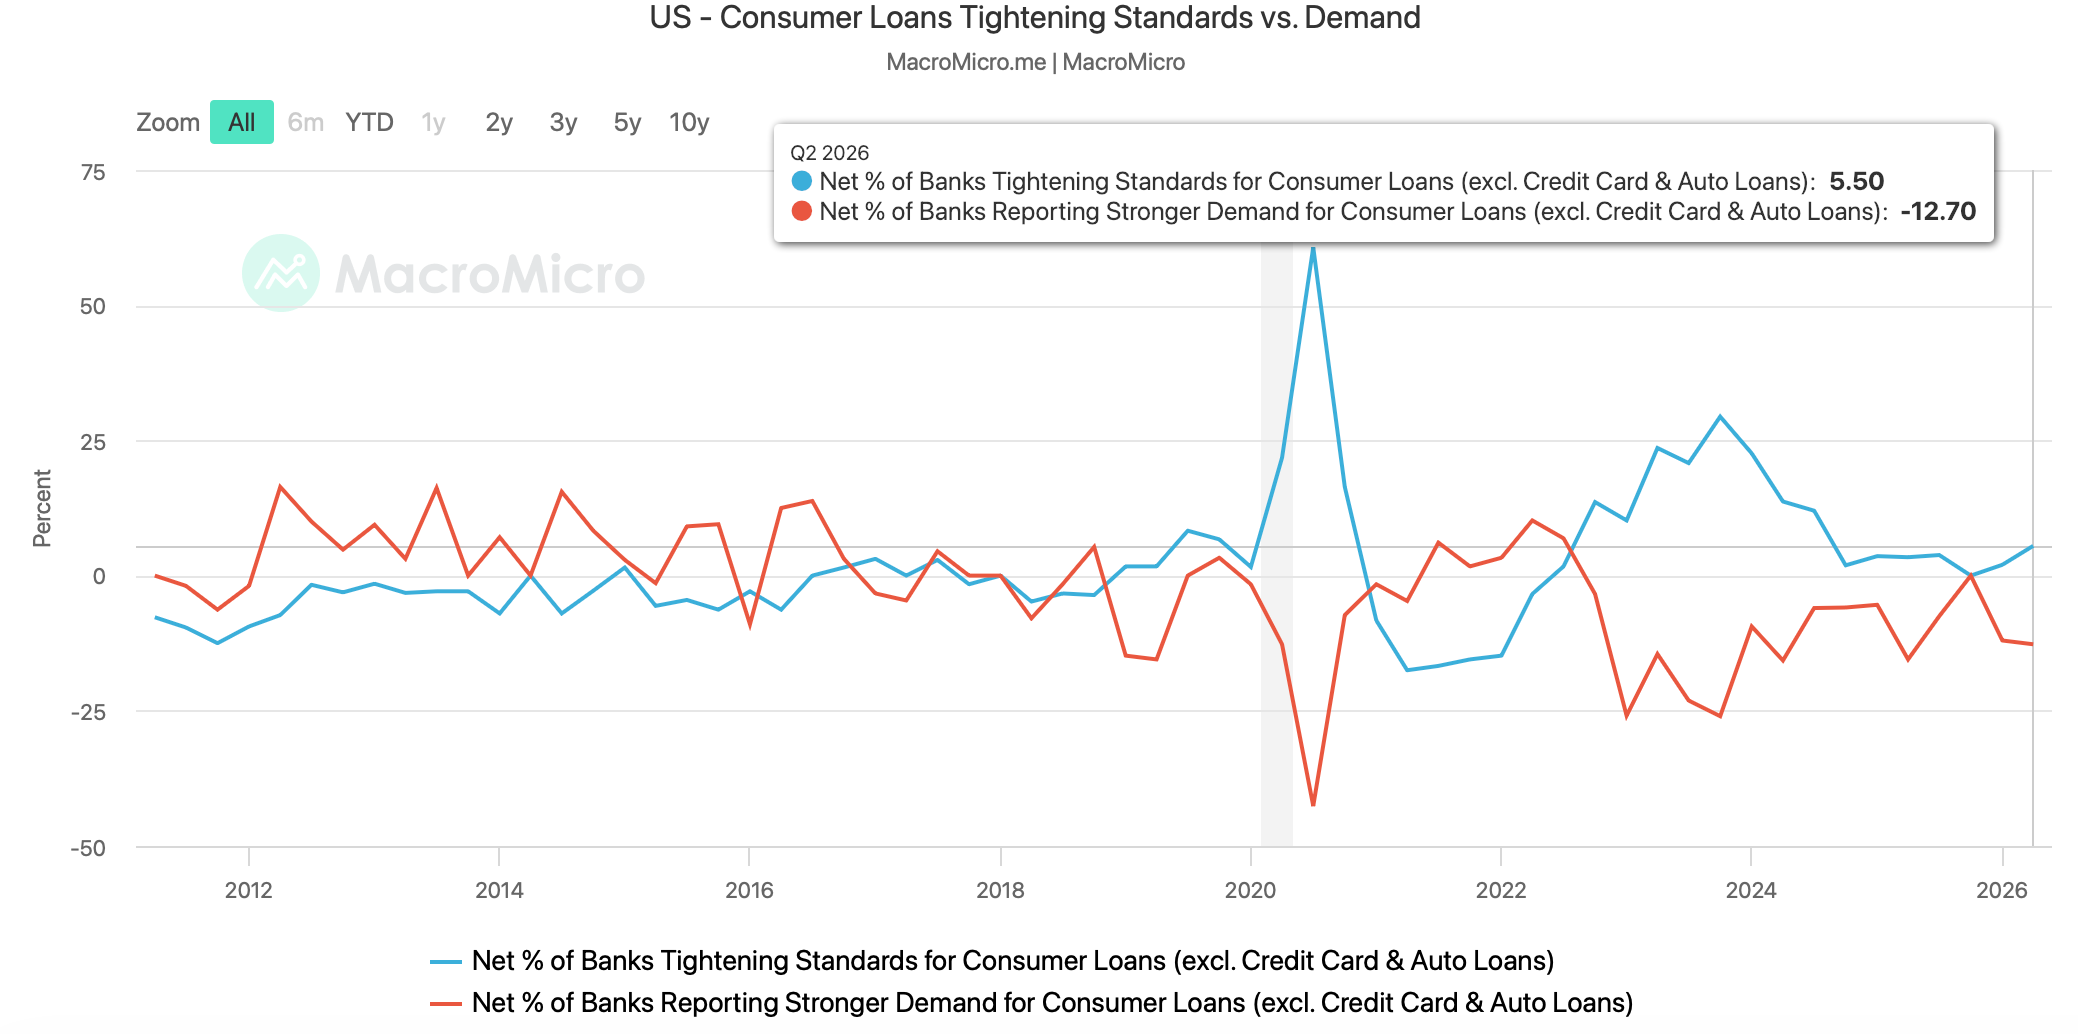
One of the credit measures which macro analysts closely monitor is the Senior Loan Officer Opinion Survey (SLOOS) on bank lending practices.
Past recessions have led banks to significantly tighten lending standards as they became wary of lending amid declining credit scores and rising defaults.
We saw a slight increase in % of banks tightening standards for consumer loans in Q2.
Furthermore, the % of banks reporting stronger demand for consumer loans also declined to -12.7%, indicating that credit demand (ex-CC & auto) from consumers remains weak, likely due to lower-income consumers facing hardship amid the rise in the cost of living.
In past recessions, we have seen the net % of banks reporting stronger Commercial & Industrial (C&I) loan demand plummet.
We saw a similar episode in 2023, post-SVB crisis, when banks significantly reduced lending to the private sector, and thus private credit scaled up.
We have seen a rebound since then; however, we are still away from the post covid highs.
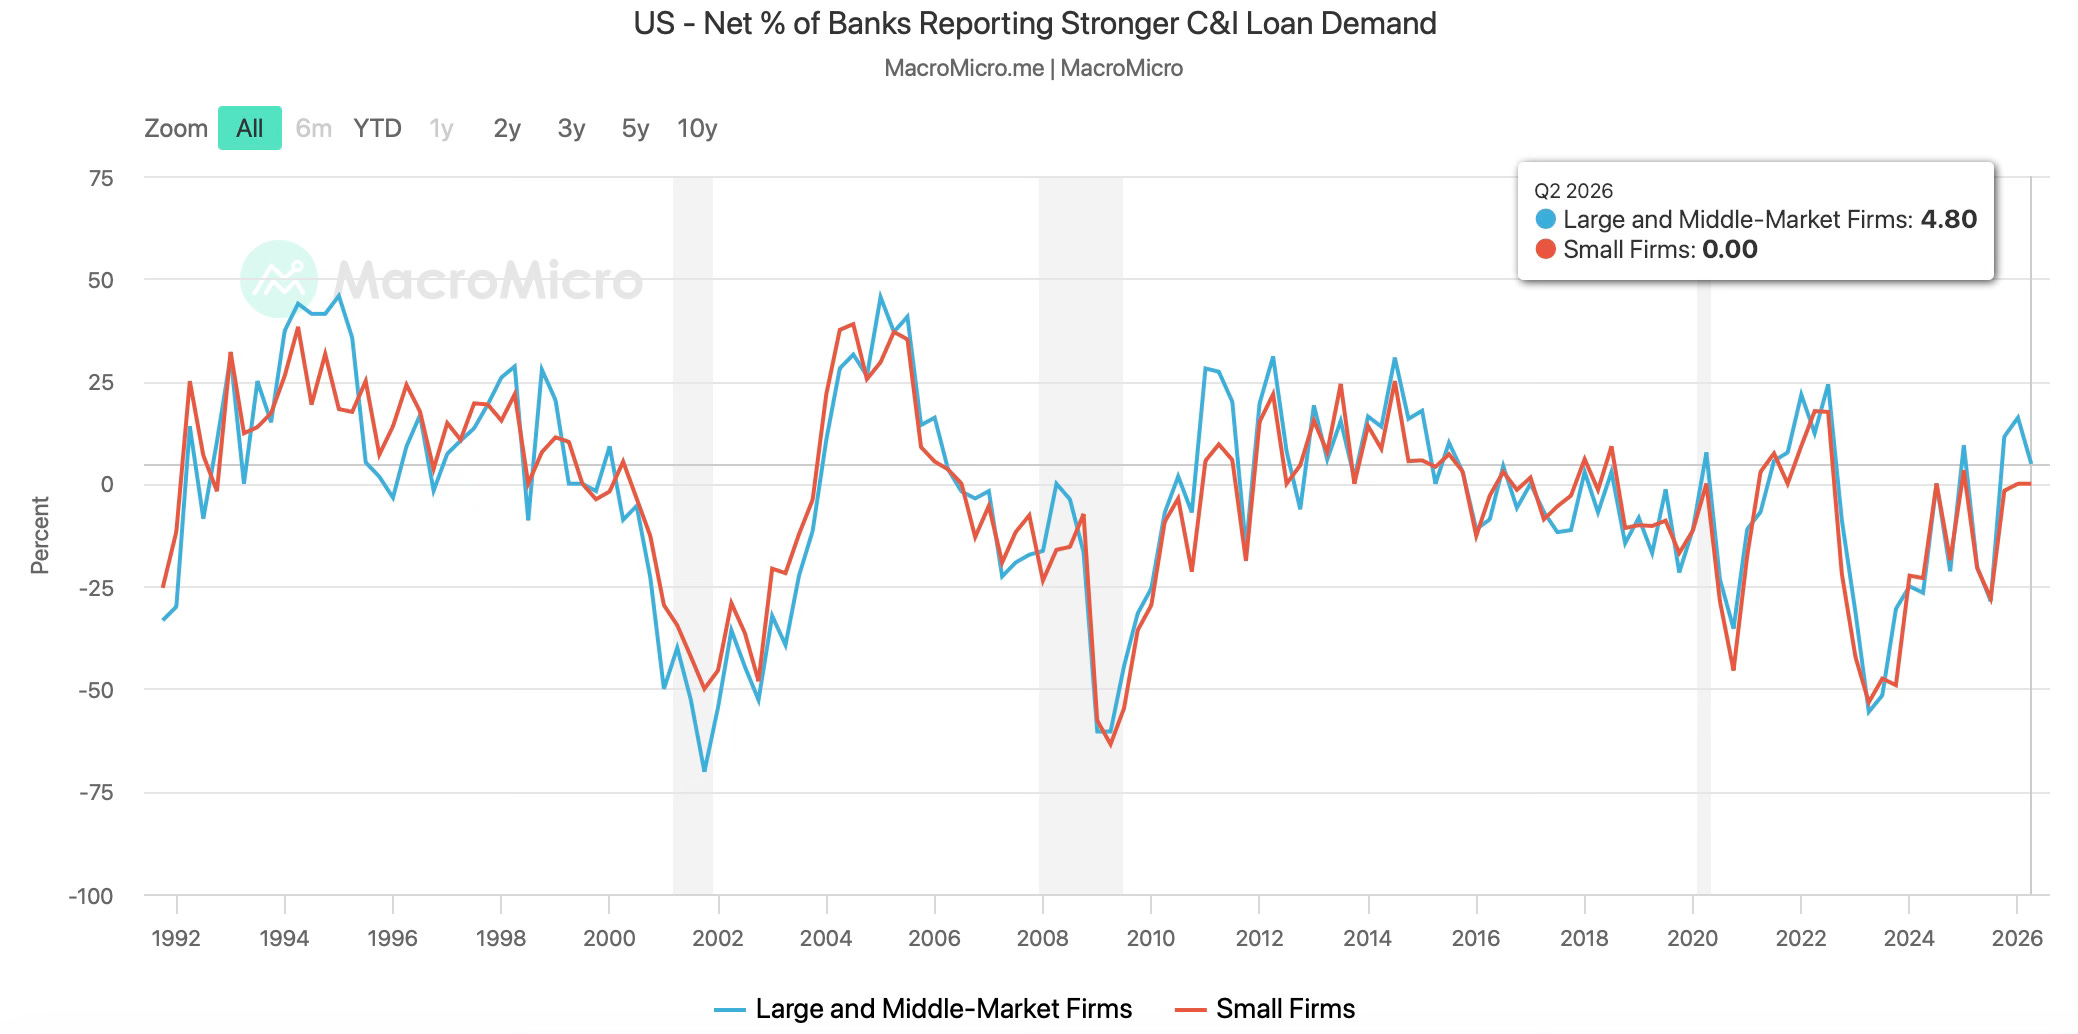
However, we anticipate a significant increase in credit demand in the coming months, driven by higher nominal growth and higher working capital requirements among businesses.
Now, let’s move on to the most important data release of the week: