
Lost In Translation!

“Macroeconomics, even with all of our computers and with all of our information - is not an exact science and is incapable of being an exact science.”- Paul Samuelson.
The most reasonable way to forecast the future trajectory of the economy is to profoundly analyze the data and use historical precedents of business cycles to reach a material conclusion about the economy's direction. Nevertheless, the current macro backdrop is the most unique ever and many market participants are truly “lost in translation”.
There are numerous reasons why most people are perplexed and cannot predict where we are in the business cycle as conflicting signals emerge from the incoming data.
Multiple exogenous shocks have hit the global economy in the past three years: pandemic lockdowns, supply chain shocks, the world’s second-biggest economy in lockdown for virtually three long years, and a bloody war rattling the energy markets.
Furthermore, tectonic shifts in fiscal and monetary policy have taken place: trillions of dollars of fiscal and monetary stimulus followed by the unprecedented “synchronized” tightening of monetary policy by the Central Banks globally.
The most significant learning from the series of exogenous and policy shocks is that the transmission of each of these shocks in the real economy takes place with a variable lag.
While the effect of the gigantic stimulus post covid is still visible in the economy (excess savings still not dried up), the monetary policy transmission has, in a brief period, taken a toll on the housing sector. Lately, we have seen that other sectors of the economy (manufacturing and even services) have started to show some cracks.
As the data continues to worsen, the debate rages up on whether we are already in a “recession” or whether we are headed for a “soft” landing or a “hard” landing.
Today’s newsletter is inspired by the Tweet of one of my favourite FinTwit accounts:
Today, we will dig in, try to understand the blurred macro landscape and gauge the economy’s direction!
H.O.P.E!
Since the last year, I have been following Stay Vigilant (Rich Excell) on Linkedin, who analyses the US economy and markets in detail. One of the most significant learnings from his decades-long market experience has been the identification of the business cycle by the acronym:
H.O.P.E: Housing--> Orders --> Profits --> Employment!
This sequence by Kantro accurately predicts the business cycles as it begins with the leading indicator “Housing”. This is because, in any economy, housing/ property/ Real Estate is the real economy and is one of the largest contributors to the GDP.
Some people even call housing the “Real” economy; thus, the significance of “housing” is paramount in understanding the business cycle.
To understand what’s happening in US housing, this thread by Eric Basmajian of EPB Macro is a must-read!
The crux of Eric’s analysis is that super-high mortgage rates are leading to a vicious circle where a record drop in volumes is leading to declining prices.
Nonetheless, the average drop in prices has been 2.4% as measured by Case-Shiller Index and is expected to reach 4-5% by December 2022.
As I wrote in “Long Road Ahead”, I expect the average prices to fall by around 15% across the US, and we may have the entire correction by the end of 2023.
As the “H” has already started witnessing contraction, we now move our focus to “O” and “P,” i.e. orders and profits.
When we take a deep look into the “orders”, the ISM data released last week (ISM is the most reliable indicator in the US) shows that even the services is now undergoing a contraction (though some of it can be attributed to the seasonal factor). Please note that manufacturing has already been under contraction for two straight months: November and December.
PS: A reading below 50 indicates a contraction, while above 50 indicates an expansion.
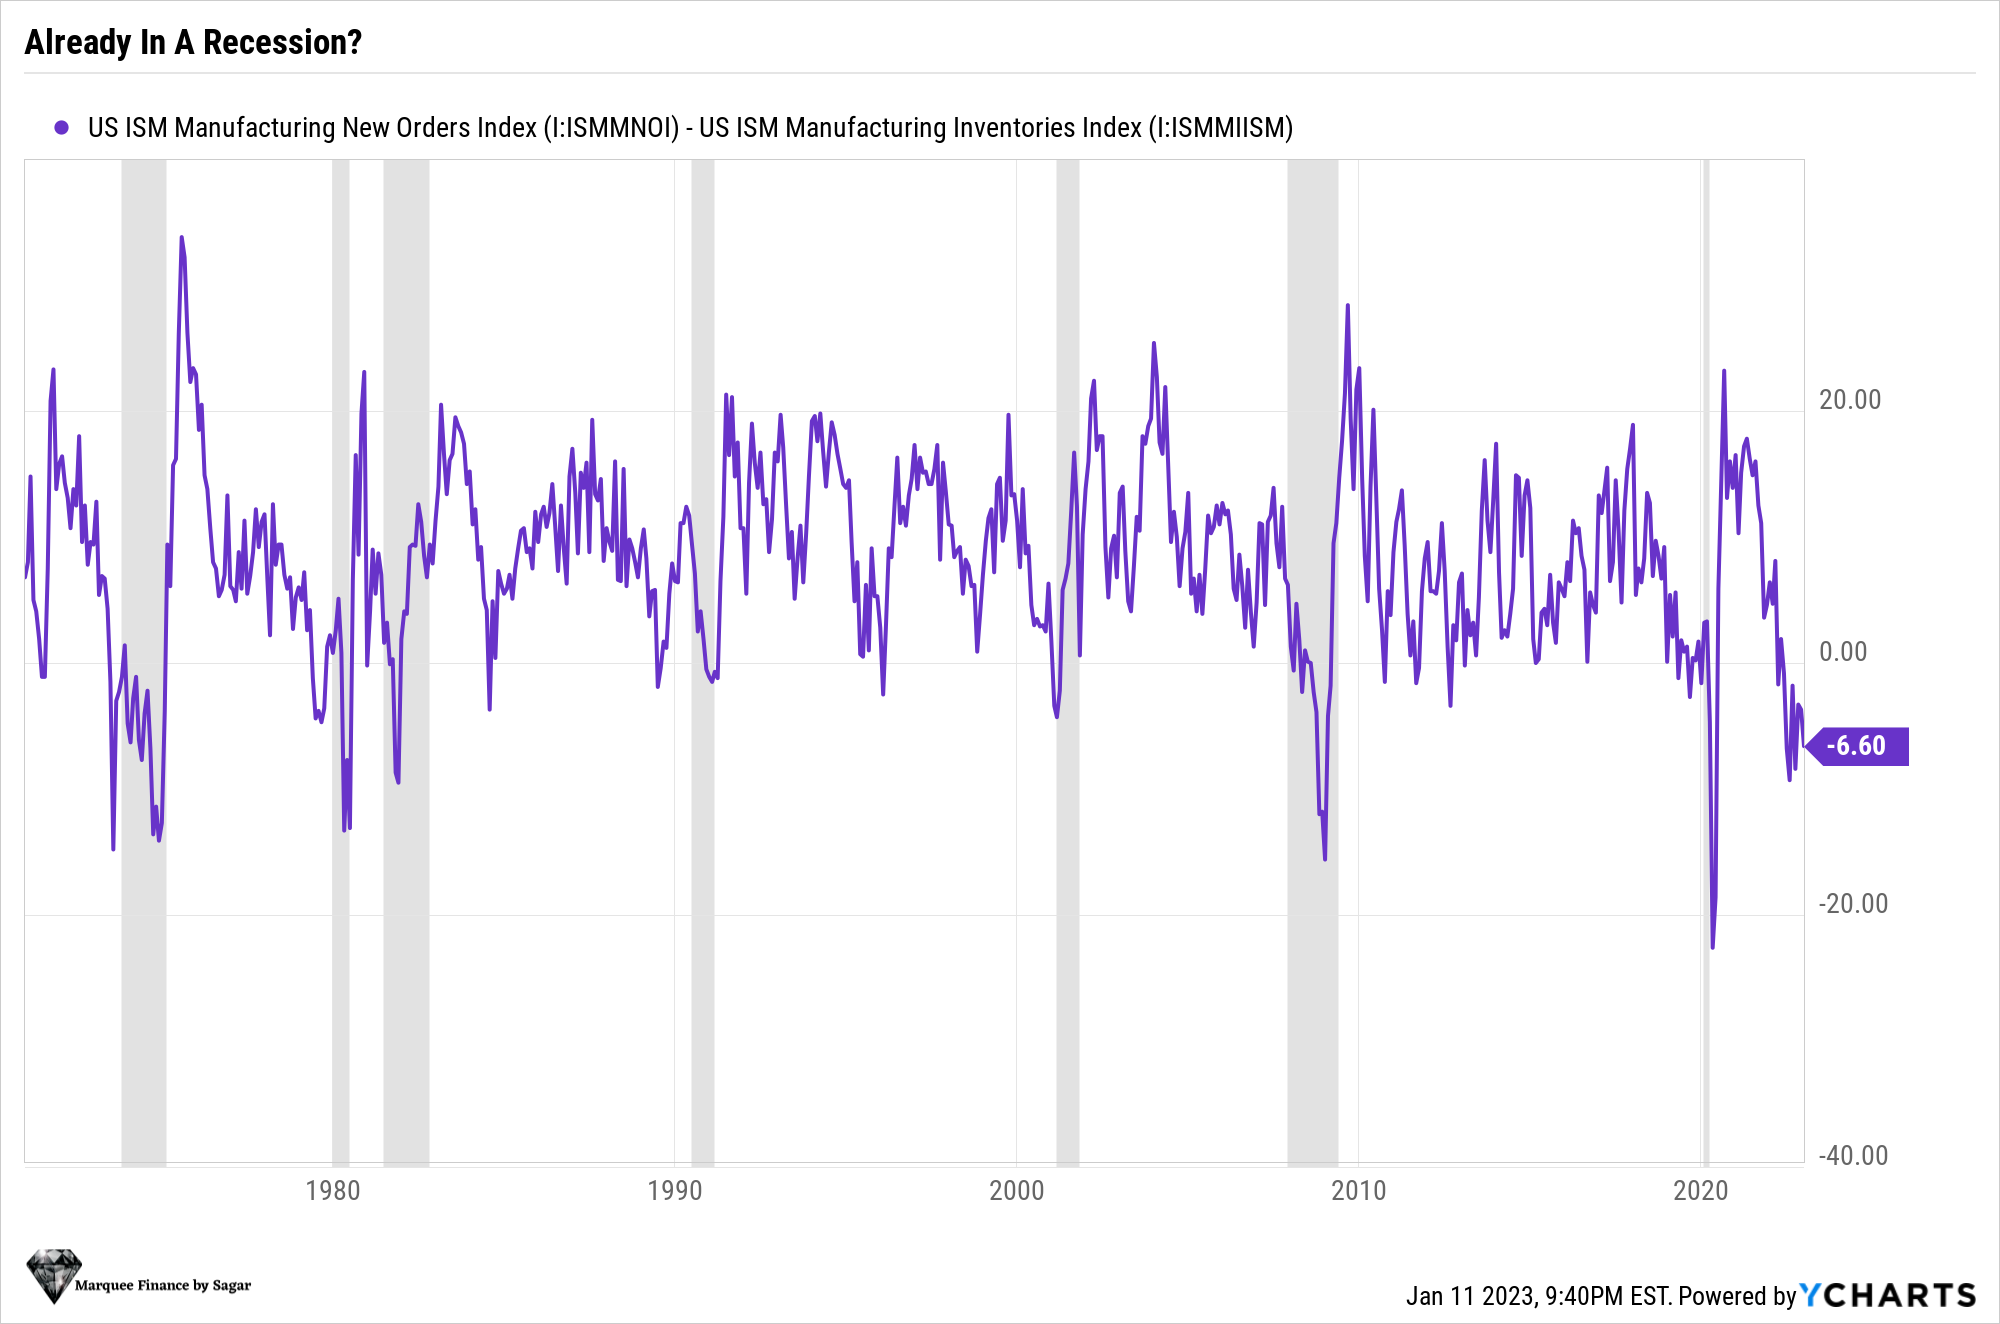
We can't miss the vital data from ISM: the Orders-Inventories data which is very reliable for forecasting a recession in real-time. The successive negative print here is terrifying as it means that the economy is “already in a recession”.
As Housing contracts and New Orders plummet, industrial production has also faltered.
Industrial Production peaked in September and declined in October and November.
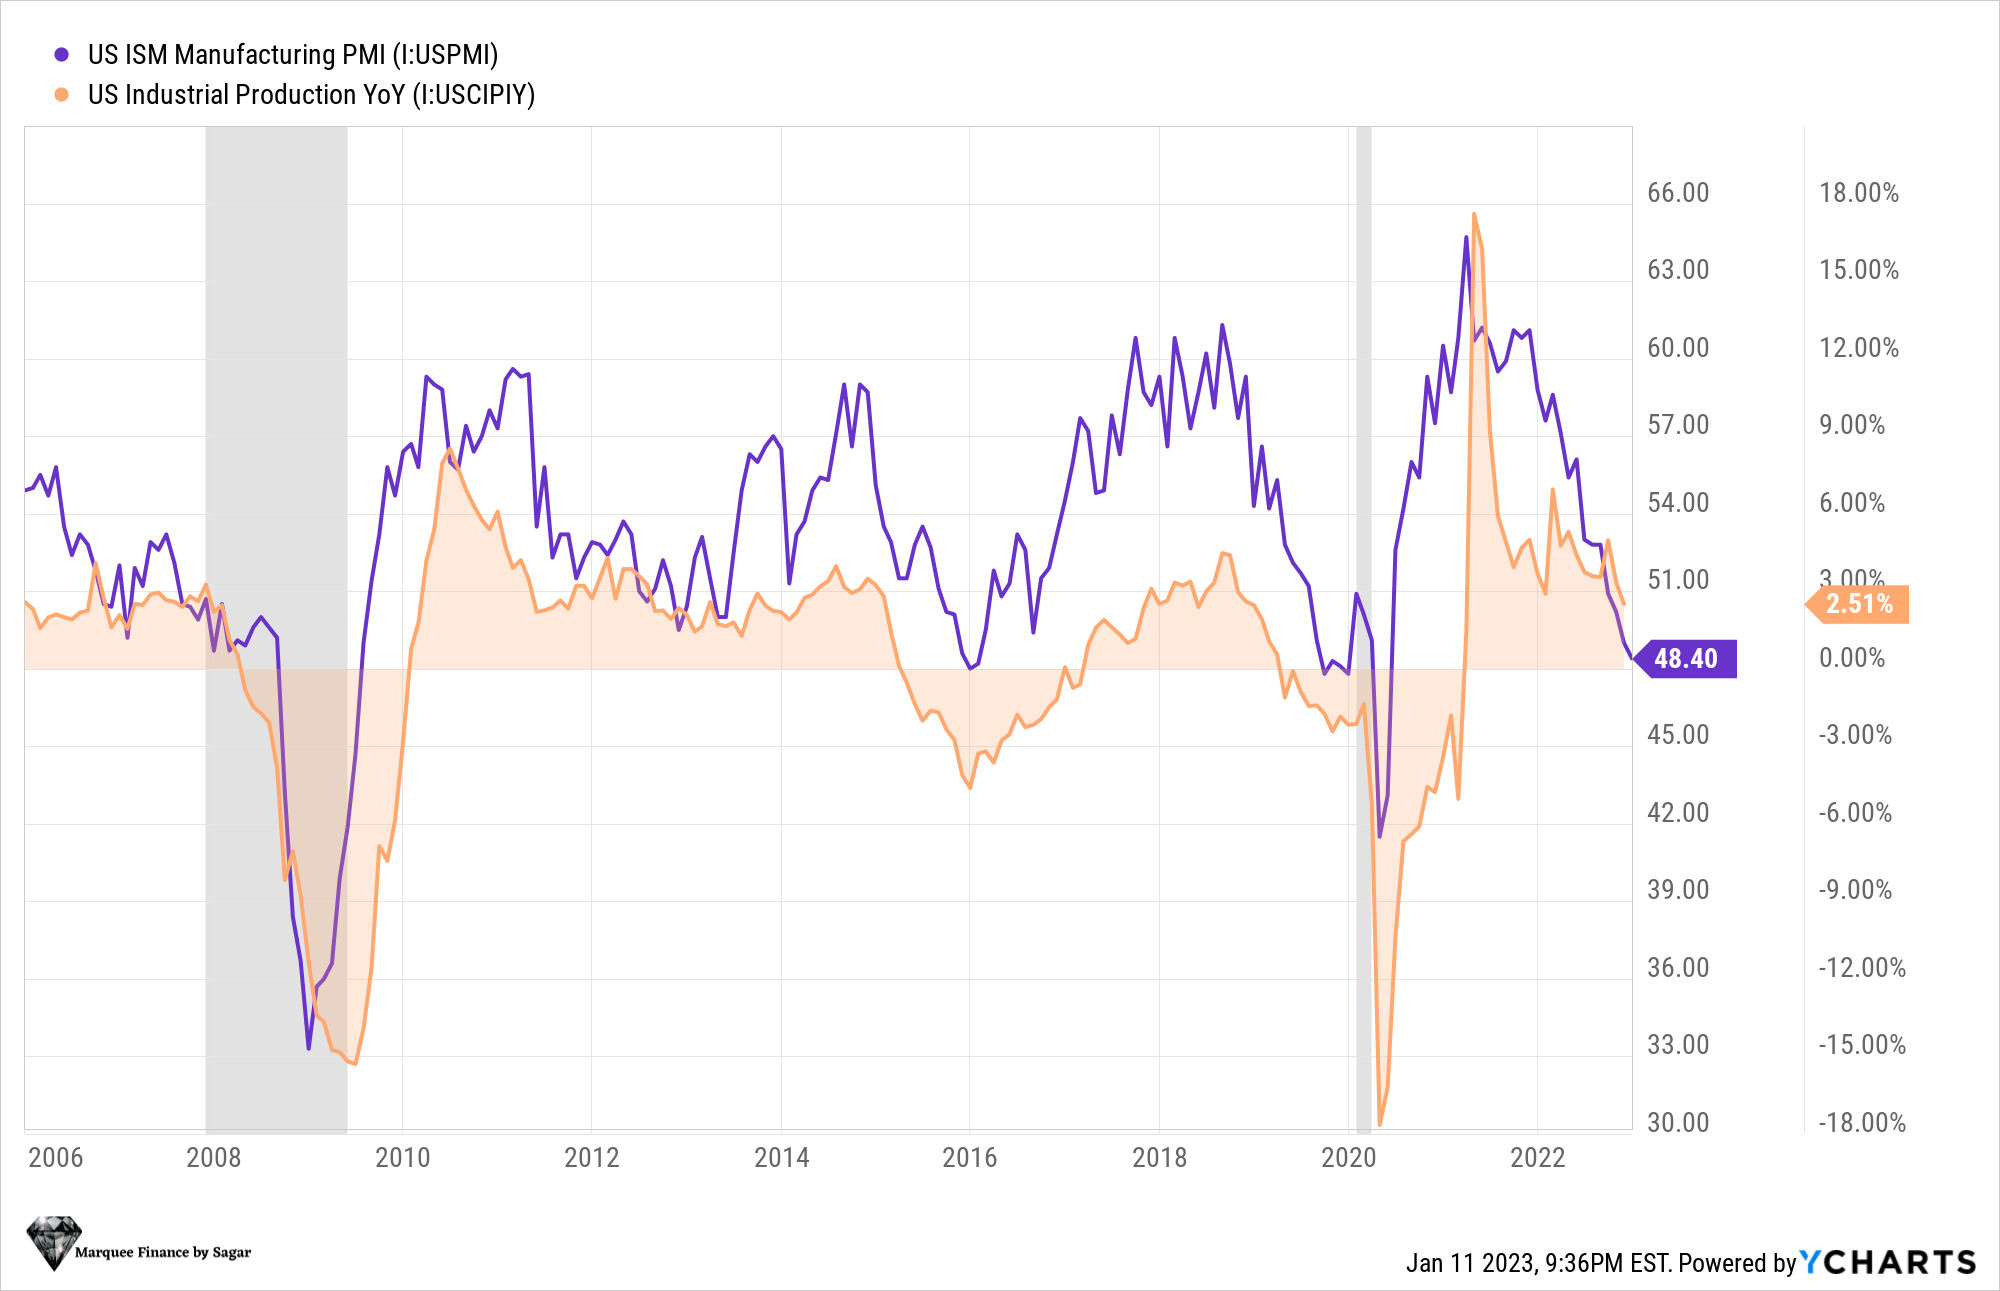
Clearly, we can see the HOPE model predicts; Industrial production lags the ISM manufacturing. As a result, we might see further declines in Industrial Production going forward.
The profits (P) will dramatically reduce and we will see the “Earnings” recession as the Industrial production plunges.
Next in our H.O.P.E model comes the trickiest component: “Employment”.
Employment is a lagging indicator; thus, the economy is already in a recession when the numbers indicate that the unemployment rate is ticking up.
However, I have been highly vocal about the exceptional strength of the labor market due to the structural changes in the economy. Nevertheless, the bigger picture reveals that the softening is visible even in the labor markets.
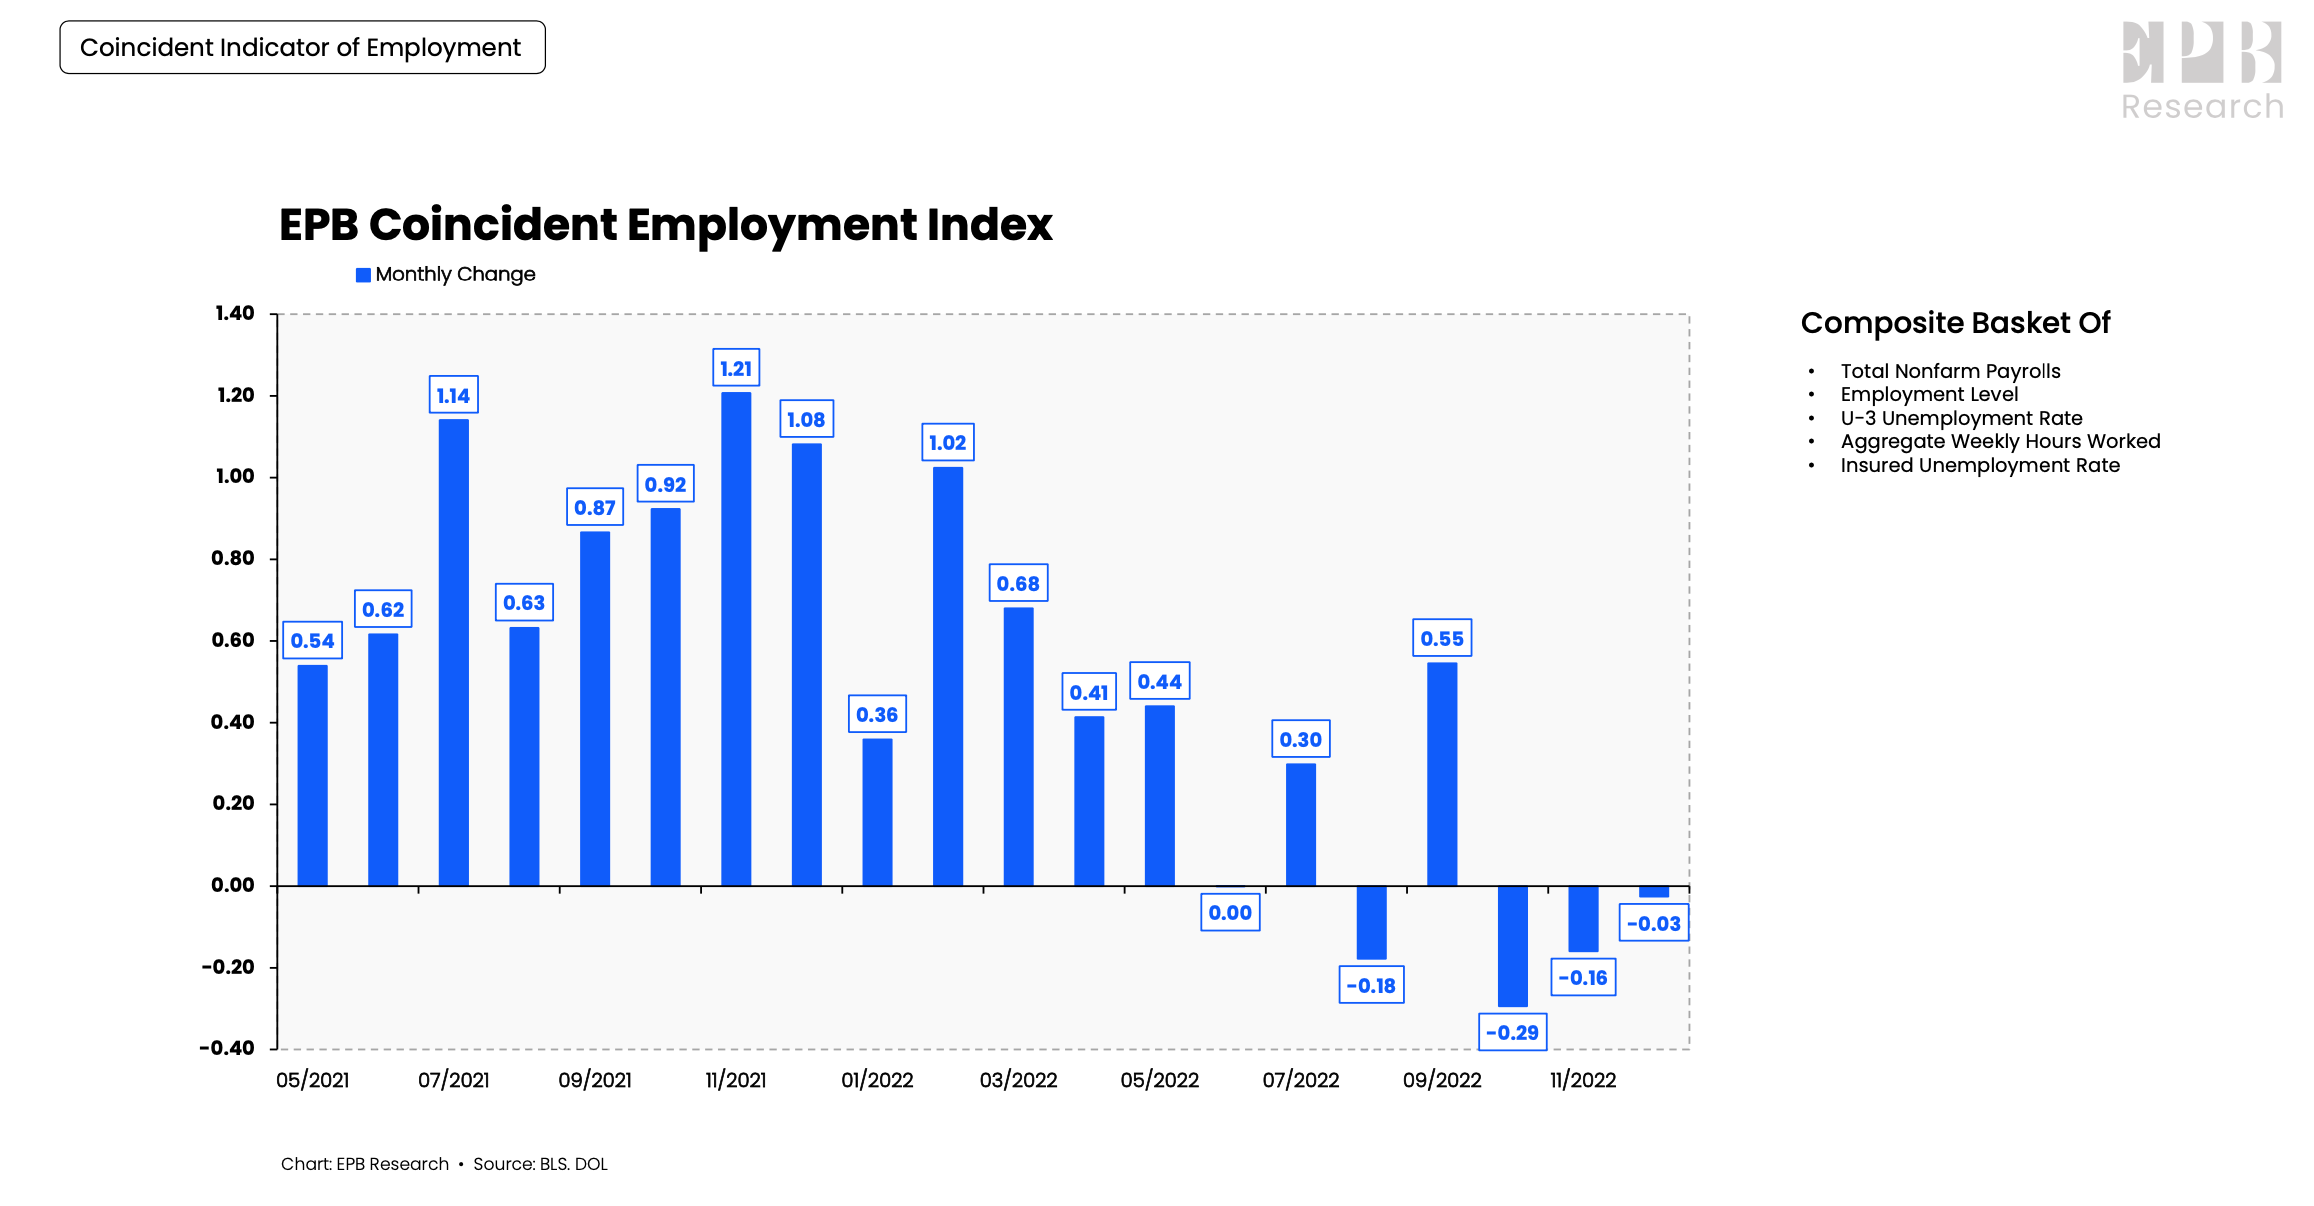
Though more data is needed to ensure that the trend continues, as the leading and coincident indicators indicate, the unemployment rate might inch up to more than 4.5% in the next six-nine months triggering the Sahm-Rule and NBER calling in a recession.
H.O.P.E model concludes that the US economy is already in a recession, if not on the verge of recession.
Please remember that if you contradict by raising the point that the real GDP growth remains strong, you will be astonished to learn that the revisions in data can be significant. Just for example, in 2008:

On the contrary, I would like to make two “valid” points that few market participants have raised recently:
Firstly, some market participants believe that a fall in gasoline prices, rents, disinflation in goods, and the remaining stock of excess savings will drive the rebound in consumption which has softened (falling real retail sales), thus postponing the recession to the second half.
Secondly, the Chinese reopening has led to a massive rally in commodity prices, raising fears of a revival in commodities inflation. Thus, we are likely headed to a stagflationary scenario where even if the growth falls off a cliff, inflation might not reach the 2% handle and hover around 4%.
Are you lost in translation?
Wait for the conclusion!
But before that, what about the globe, the Chinese reopening?
RoW And Chinese Reopening!
While the U.S. is in a recession, the other D.M.s in the West will follow suit. On the other hand, China has startled everyone with the pace of reopening. As a result, this time would be different than 2008 or the covid recession when the entire global economy suffered from the slowdown.
The unprecedented stimulus the Chinese government is embarking on to revive its ailing property sector and an economy battered by the covid lockdowns will lead to an enormous increase in the credit impulse.
Furthermore, as the demand for oil, natural gas and other base metals increase, the commodities might witness a swift rally in H1 before the extent of slowdown emerges from the West.
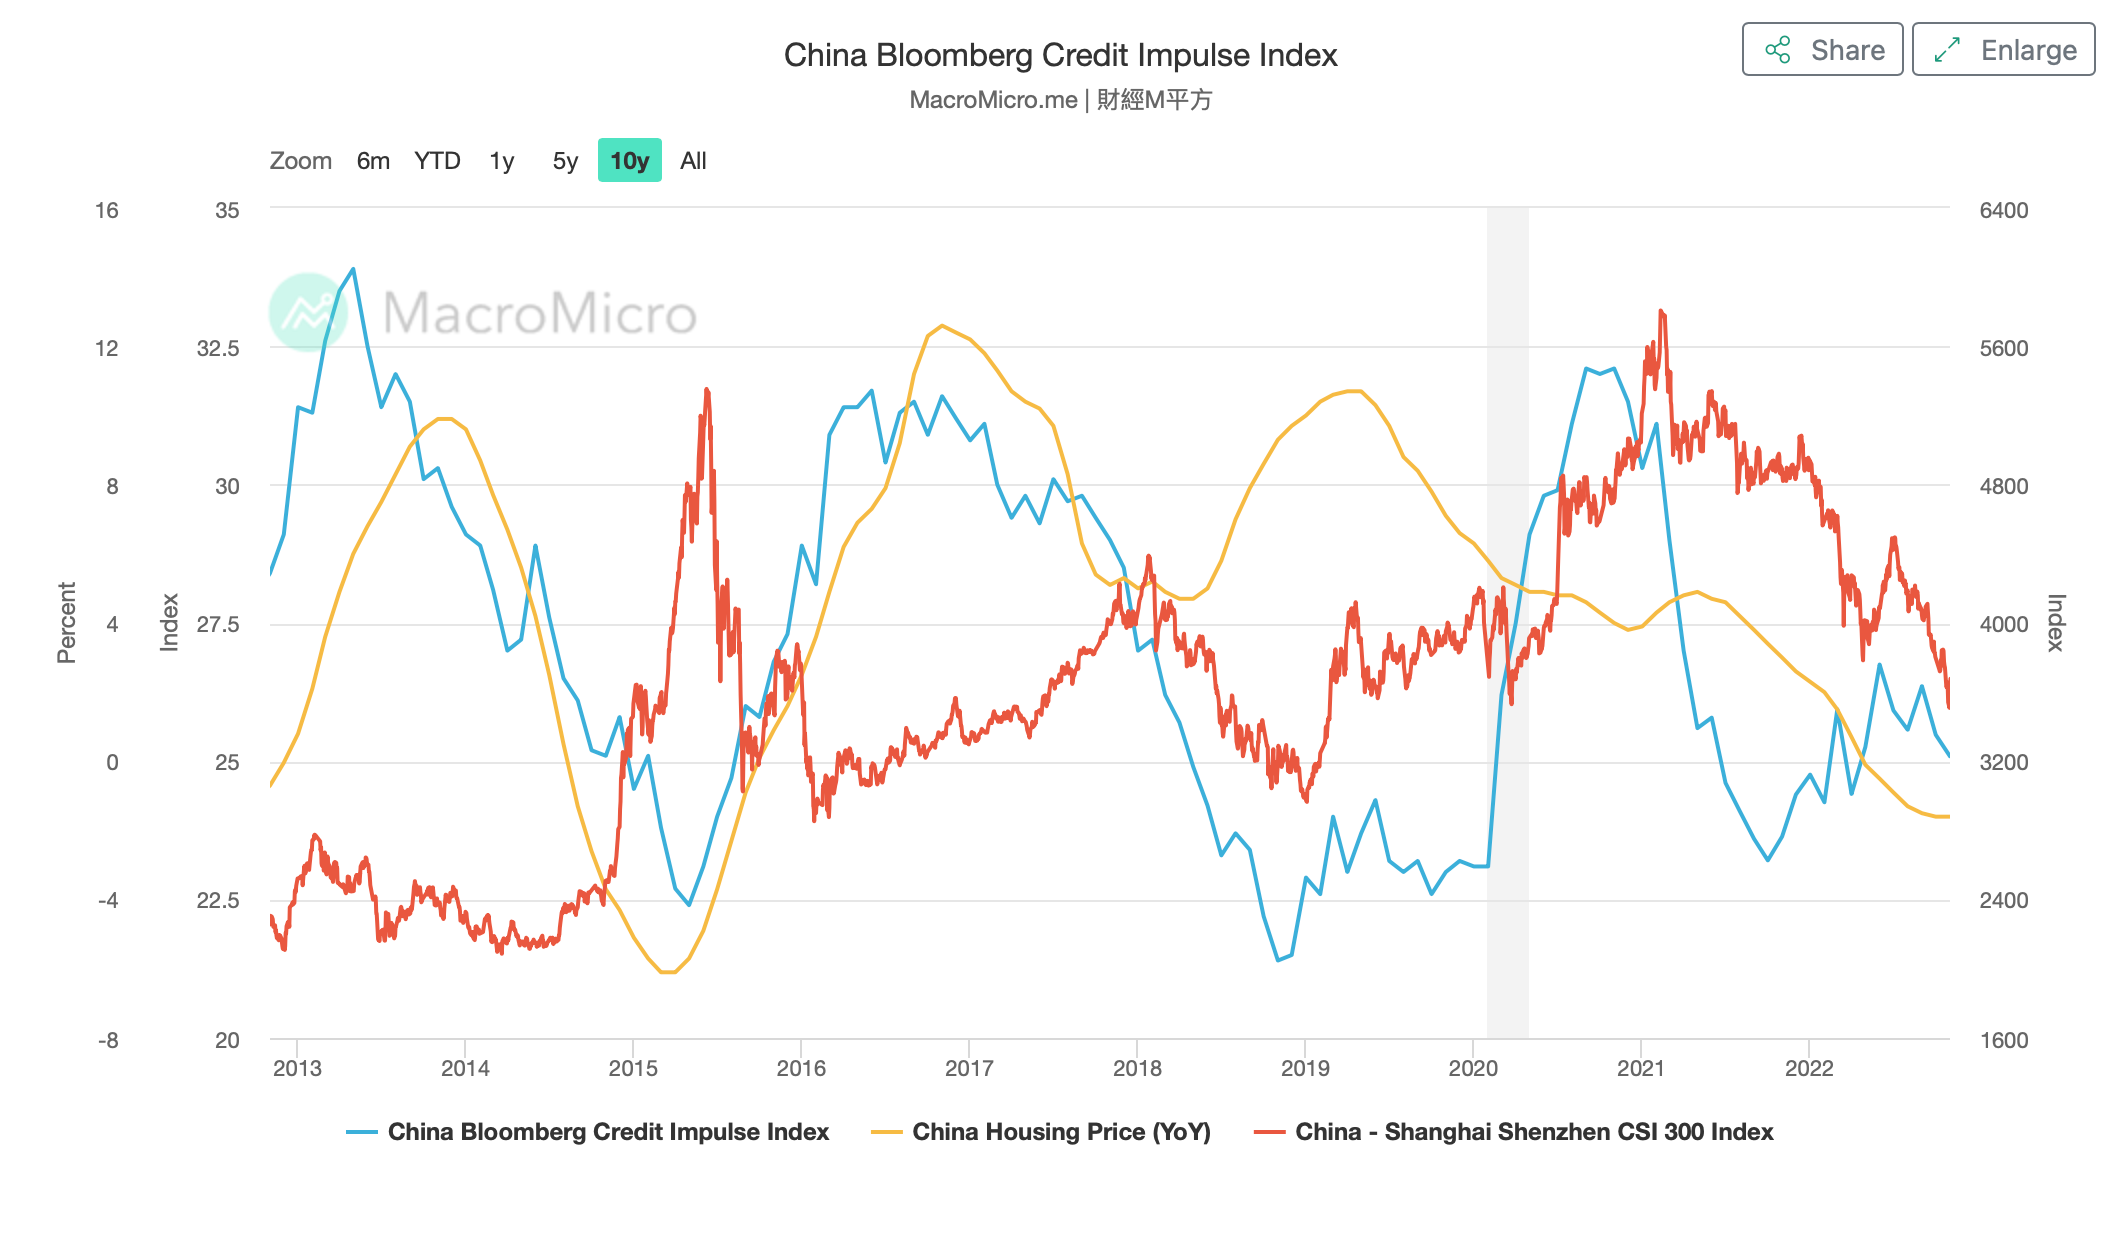
This chart is of paramount importance to global investors. It demonstrates that the credit impulse will pick up massively once the economy reopens completely and the current covid wave subsides. (See the peak in 2013, 2016, 2021)
Moreso, an interesting trend is that before 2018, the increase in credit impulse led to rising housing prices; however, the recent increase in credit impulse led to a stock market rally as the housing sector stalls. This gives another reason to be bullish on Chinese equities.
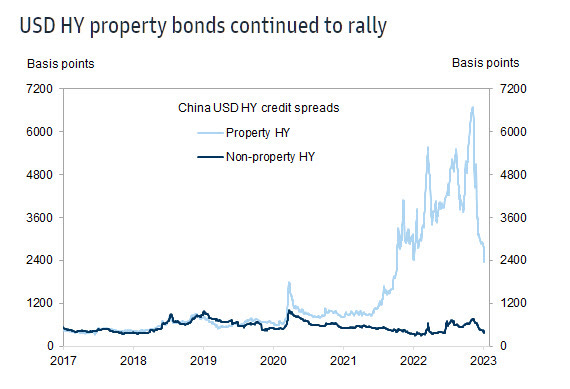
The reopening cheer has already led to a record rally in USD Junk Bonds of Chinese property developers.
The Chinese reopening remains the biggest story of 2023.
A Chinese reopening will also give impetus to other Asian economies as S.E. countries like Vietnam, Indonesia, Thailand, and South Korea will benefit enormously from outbound Chinese tourism and the resurgence of Chinese consumers marked by the tremendous pent-up demand this year.
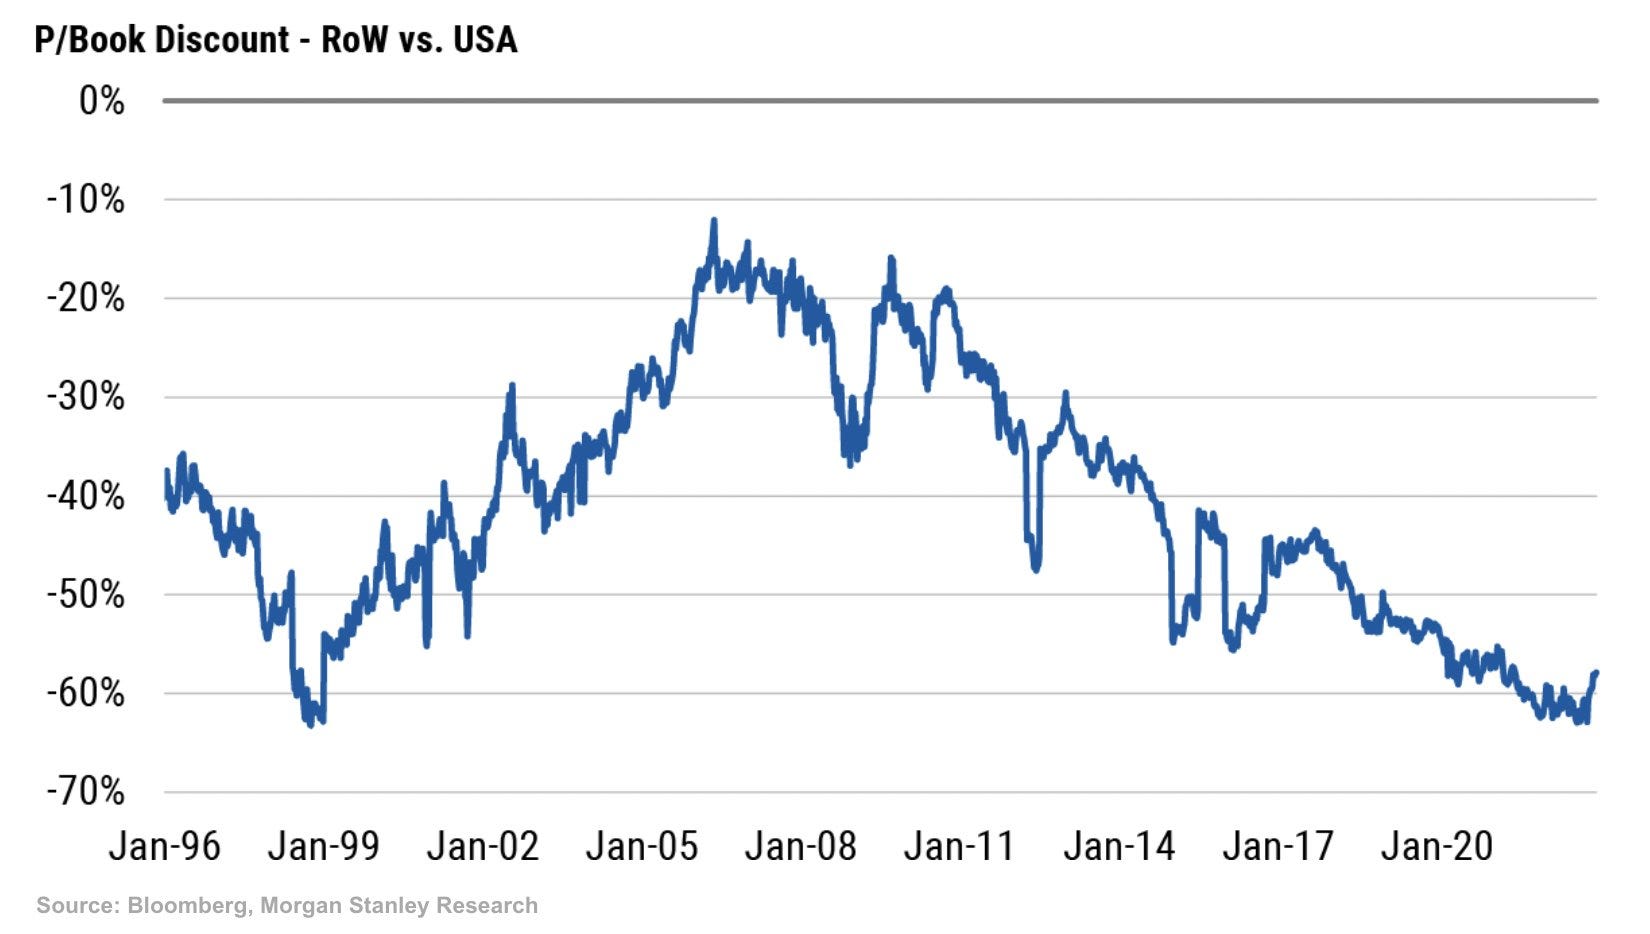
All the roads lead to a path where Asian economies are expected to remain reasonably immune to the recession in the West, at least in 2023, and thus Asian E.Ms may outperform U.S. equities. Moreover, the valuations remain conducive for RoW to outperform their U.S. peer.
Conclusion!
We are in a rather bizarre situation where half of the world will be/ is in a recession while the other half is likely to escape it. As the transmission of falling M2 supply and tightening monetary policy seeps into the real economy in the U.S., the data will continue to deteriorate on the growth front and sweeten on the inflation front.
Furthermore, the growth collapse might lead to inflation plunging faster than anticipated by most market participants (more details in the next week’s newsletter).
The focus of the Western C.B.s on lagging indicators like C.P.I. and the Labor market means that “they are likely to overtighten” in this cycle.
The repercussions of overtightening might be catastrophic, and the hopes of a soft landing might be decimated as the vulnerable parts of the financial system, like private markets and shadow banking can collapse, leading to a hard landing.
The portfolio positioning becomes uber important in the current scenario.
The firming up of the Chinese reopening and the data released in the U.S. in the first two weeks warrant a slight change in the model portfolio. (Those who are new to the substack, Click Here to know more about the Model Portfolio)
I will share the portfolio changes next week with in-depth insights about inflation, bonds, and stocks with a lot of data.
Stay Tuned, and have a Happy Weekend!
Disclaimer
This publication and its author is not licensed investment professional. Nothing produced under Marquee Finance by Sagar should be construed as investment advice. Do your own research and contact your financial advisor before making investment decisions.