

April saw a cool-off in the risk assets as the world’s largest central banker pivoted and turned into a hawk after the resilient economic data and higher-than-expected inflation readings led Mr Market to reduce the number of cuts from 7 at the beginning of the year to just 1/1.5 cuts today.
Heightened geopolitical tensions also marked April as events in the Middle East heated up fairly rapidly before diffusing “suddenly”.
Let us understand the cross-asset performance and the macro updates via intriguing charts.
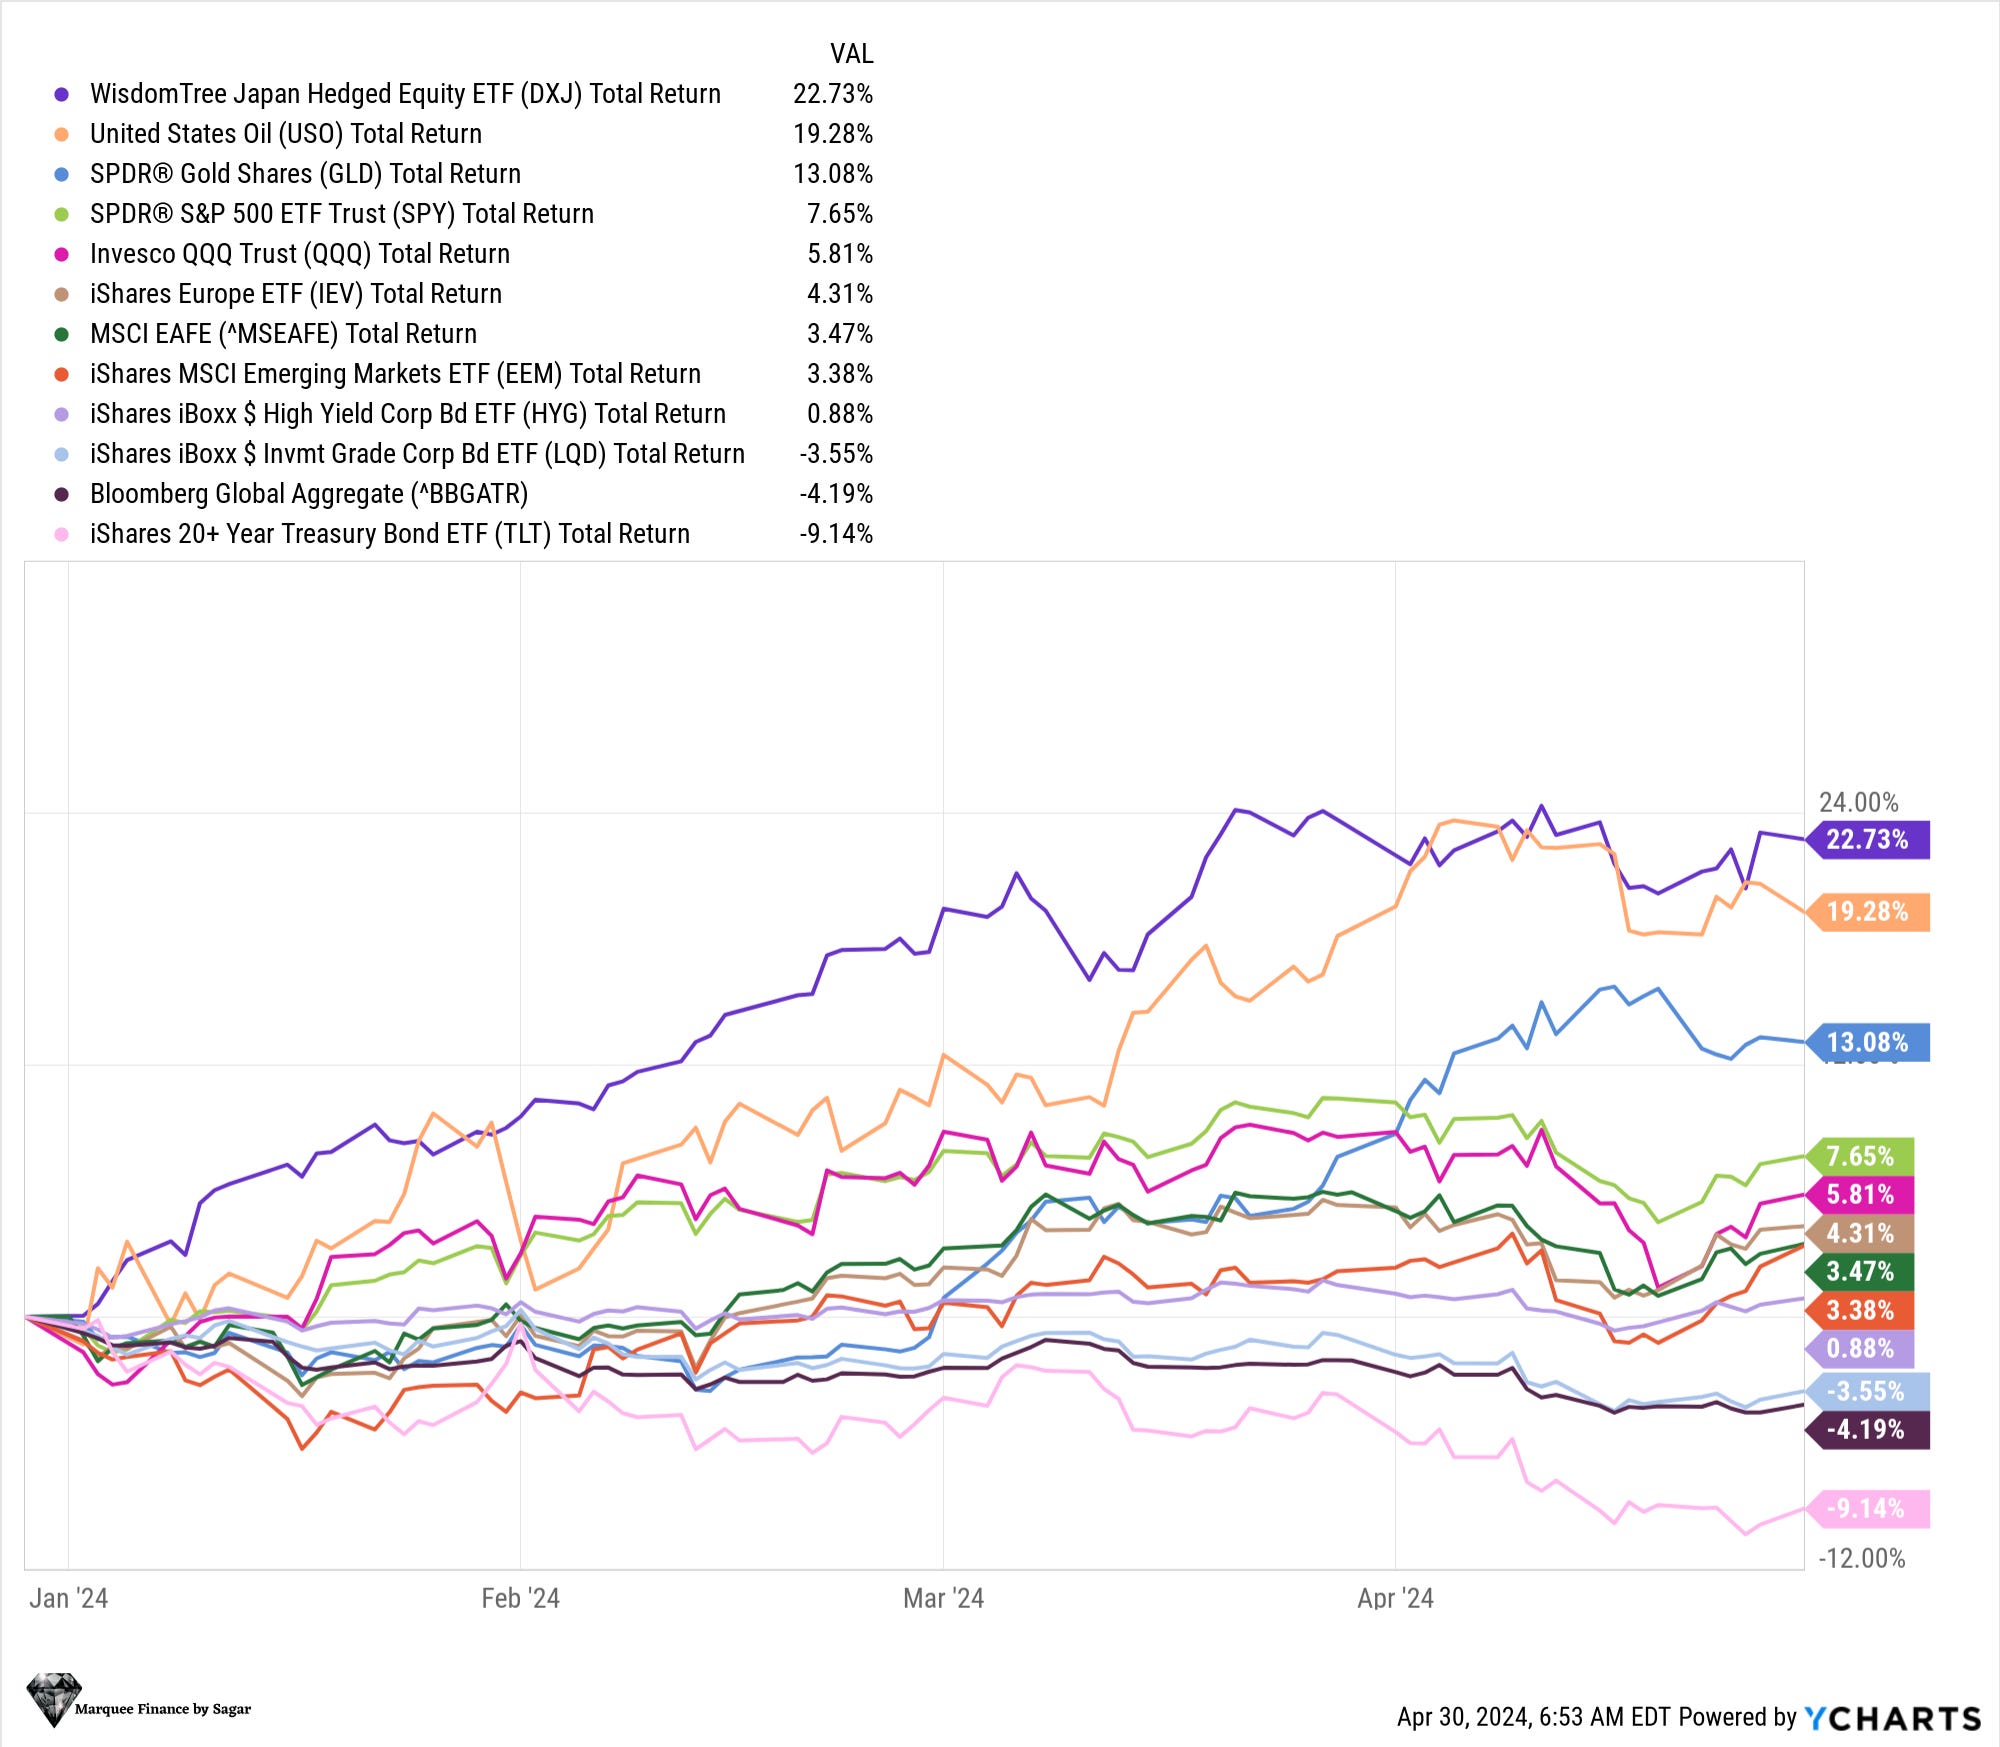
Commodities led by oil and copper remain the biggest outperformers YTD.
Conversely, Gold has seen a blistering rally due to several tailwinds, including massive global buying by central banks.
While the US outperformed RoW (ex-Japan), Europe has been doing a catch-up lately.
Nonetheless, bonds continued their worst rout, with long-duration bonds being the worst performers as the epic bond bear market enters its third year.

While inflation readings have been hotter than expected, one thing that stands out is the explosion in inflation expectations.
Since the Fed's premature pivot in December and the recovery in the Chinese economy, which led to an enormous rally in commodities, inflation expectations have risen significantly.
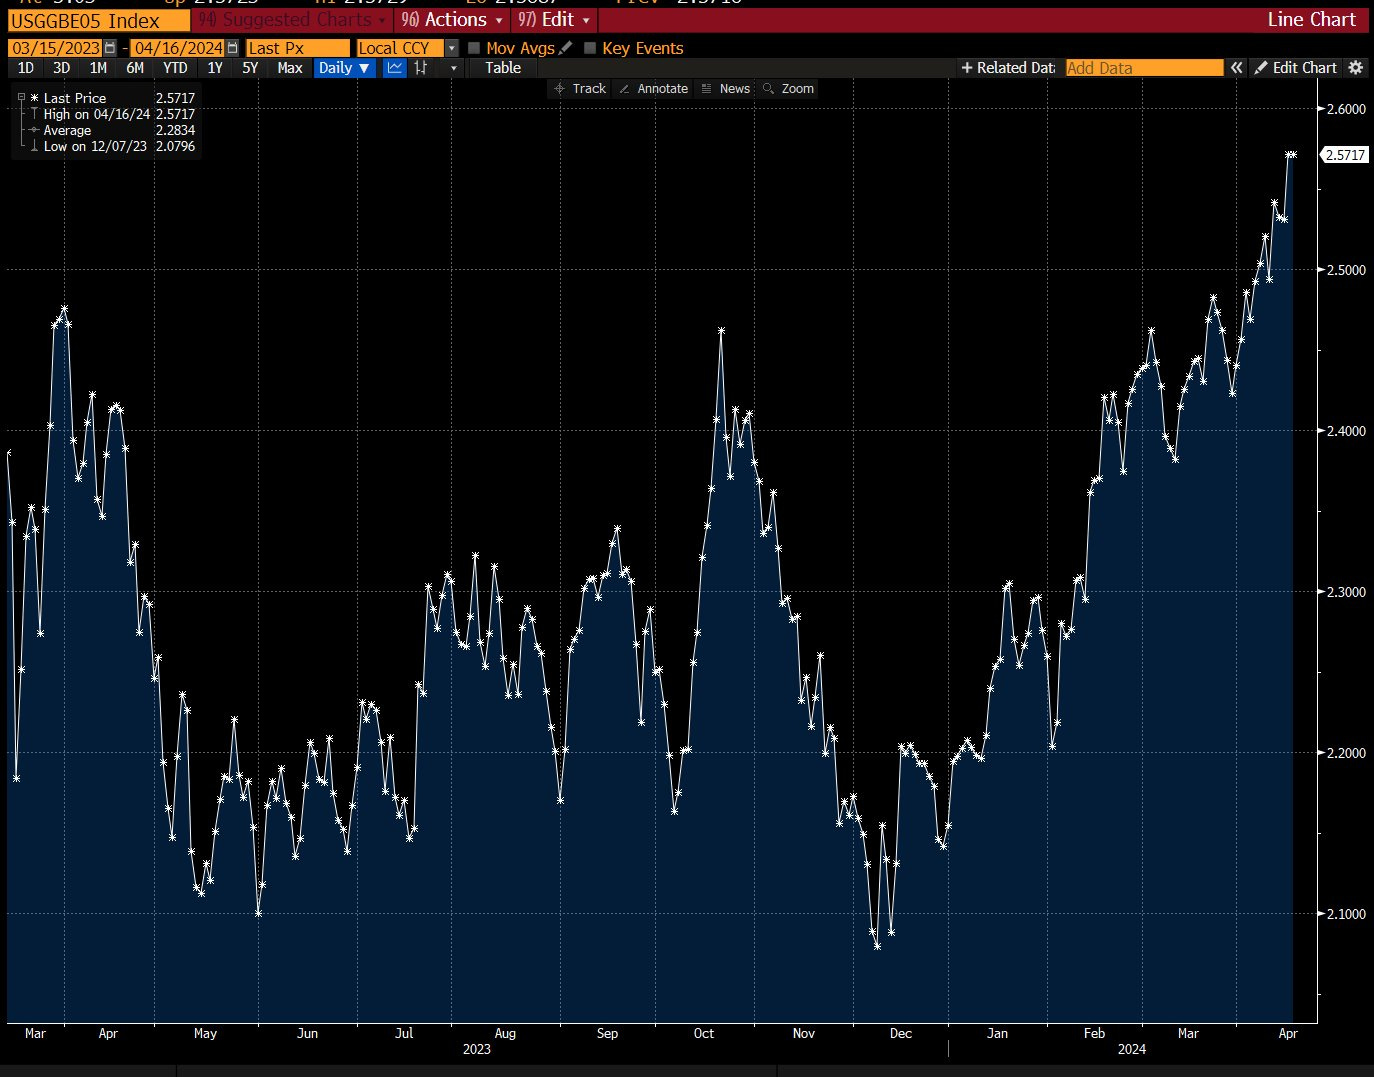
Source: BBG

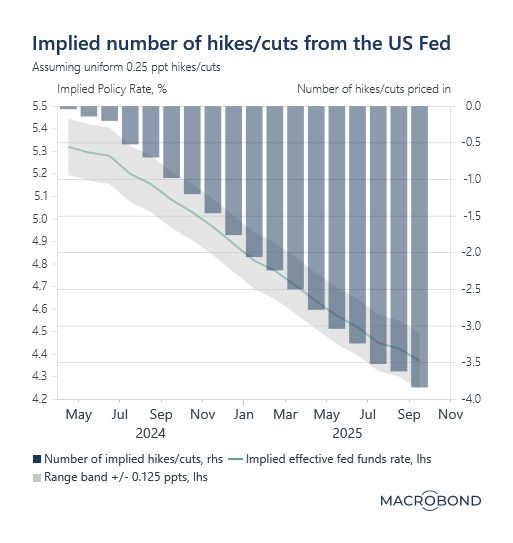
As inflation overshoots expectations, Mr Market has given their verdict and expects only 1.5 rate cuts this year.
Note that seven cuts were expected at the beginning of the year, and long “duration” was the consensus trade among the fund managers.

The macro fundamentals of the US economy have been robust thanks to “fiscal dominance,” as the US Government continues to spend like a drunken sailor.
Nevertheless, the equities are overvalued despite a solid macro backdrop, as per Goldman Sachs Investment Research.
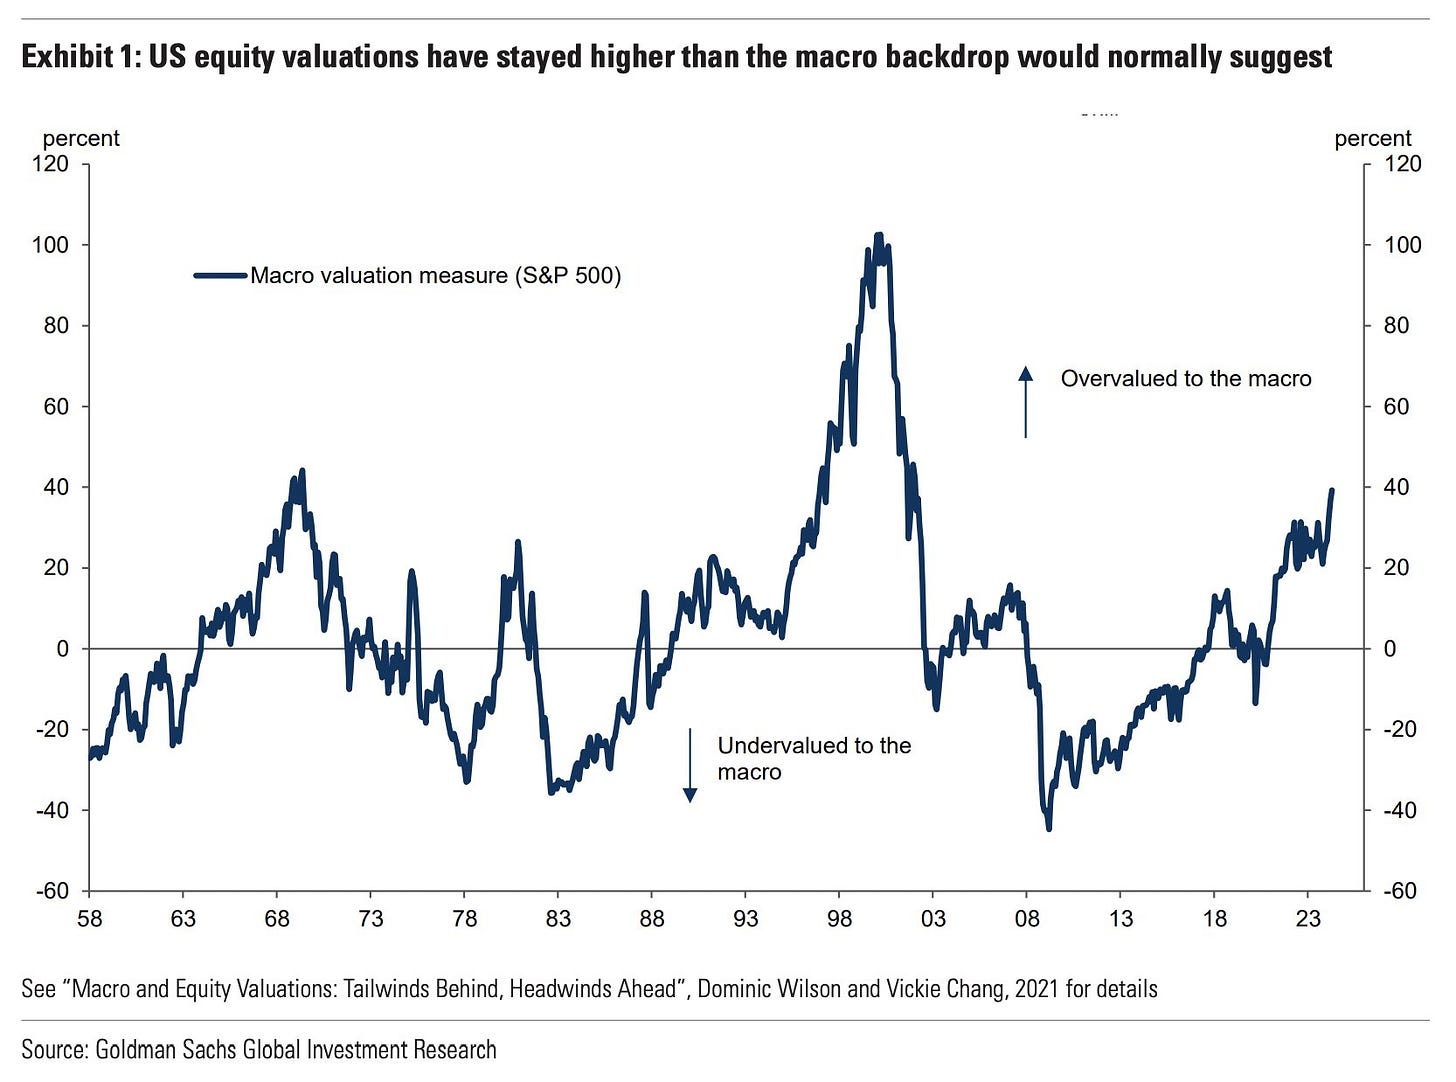

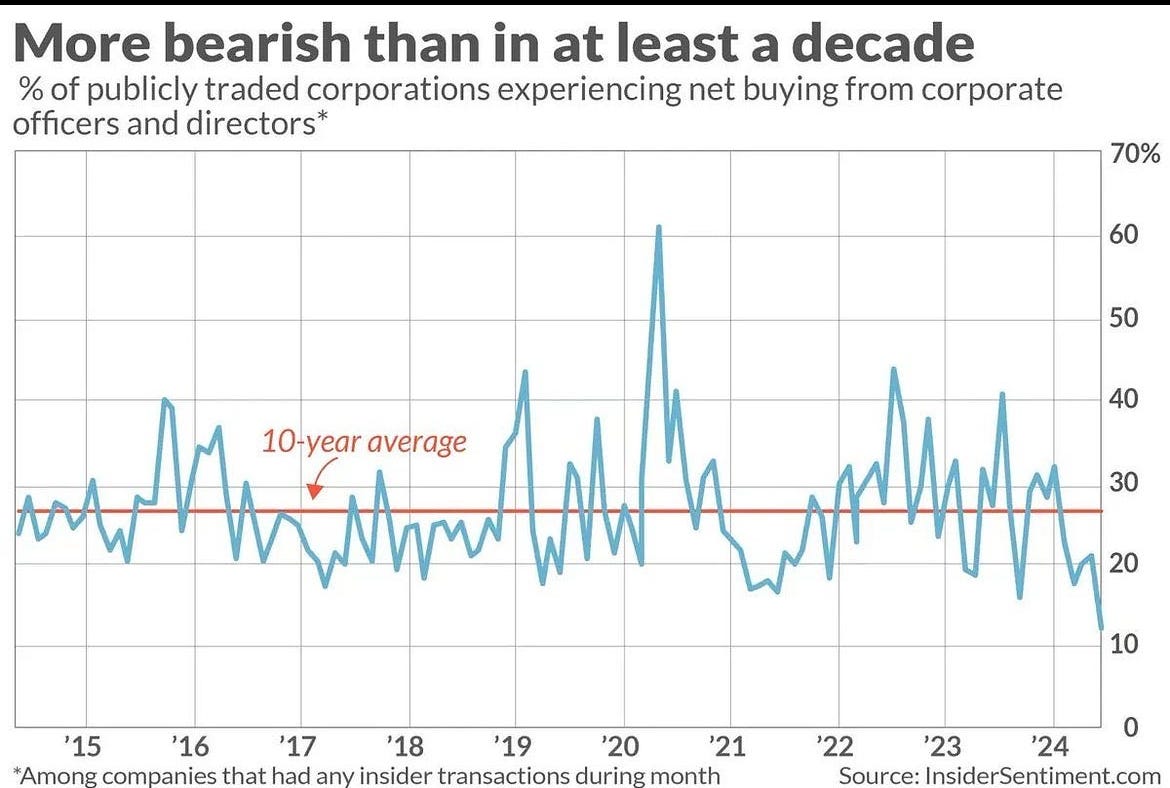
No one other than insiders better know that the stock markets are overvalued.
Just 10% of insiders (corporate officers and directors) were optimistic and buying their stocks, indicating extreme bearishness.

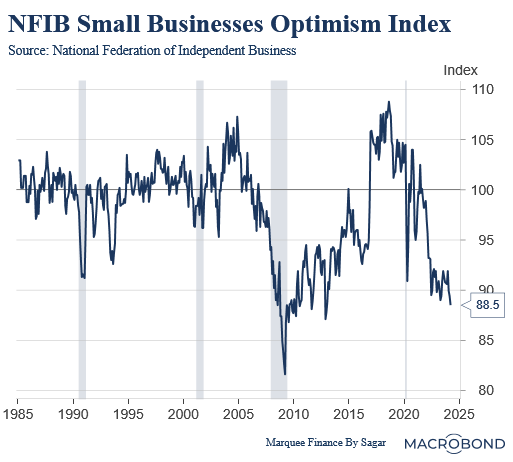
While macro fundamentals have been robust, some parts of the economy are flashing red signals.
Before we conclude, more data is required to confirm whether the “R” word that the market has completely forgotten will return with a vengeance before elections.

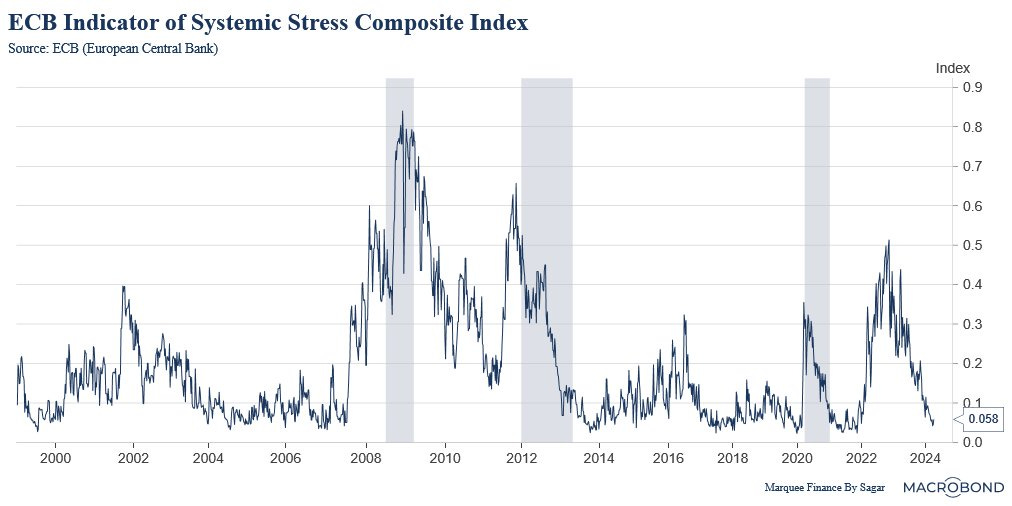
In Europe, the financial conditions have been extremely loose as stocks remain near ATHs and the credit spread remains unusually tight. Furthermore, a dovish ECB has helped.
As a result, the ECB’s indicator of Systemic Stress is near pre-pandemic lows.

If you are wondering the reason for the recent outperformance of the European stocks against the US equities, then look no further than the revival/bottoming out in the cyclical sectors in Europe.
Early green shoots are visible in Germany, and if the trend persists, we can see buoyant returns from European equities this year.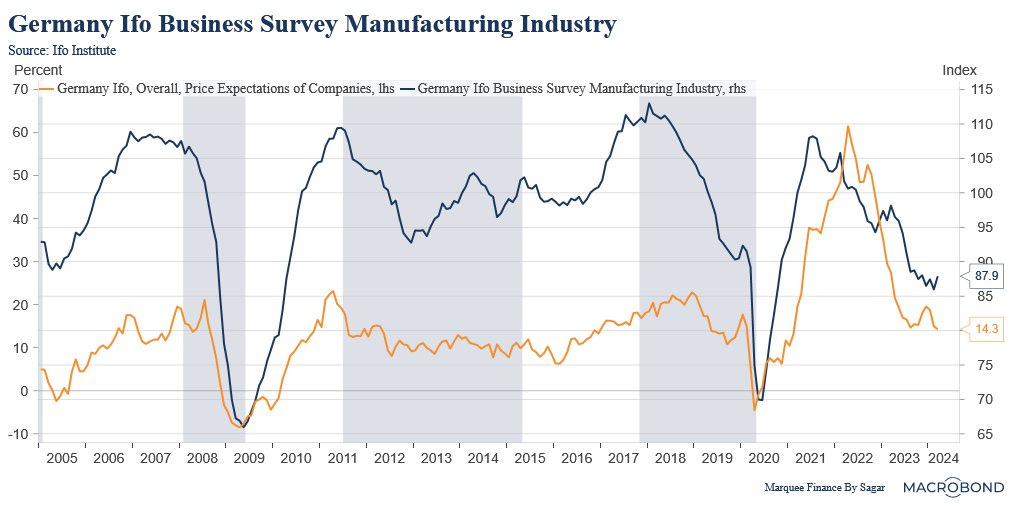

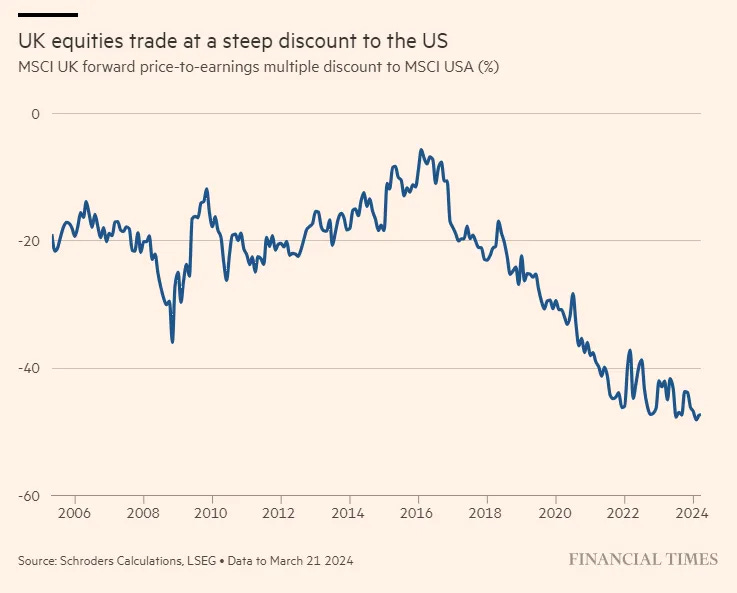
As Europe’s macro recovers, the UK's equity markets have been on our radar and have hit fresh all-time highs.
If you believe in mean reversion, then this chart is an eye-opener.

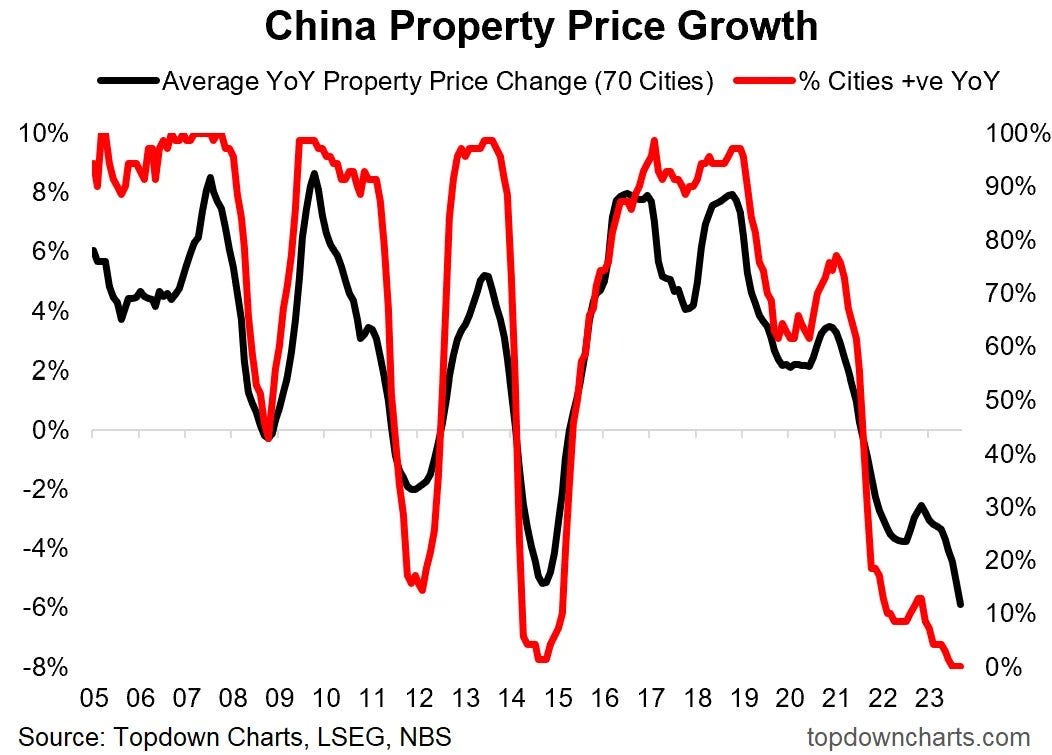
There is no end to the downfall in the Chinese Property Prices as the meltdown accelerates across the country.
Furthermore, the CCP is not interested in reviving the sector. It wants the economy to transform into a consumption-based one and encourage investments in new-age technologies (EV, Nuclear, Renewables, AI, etc.).
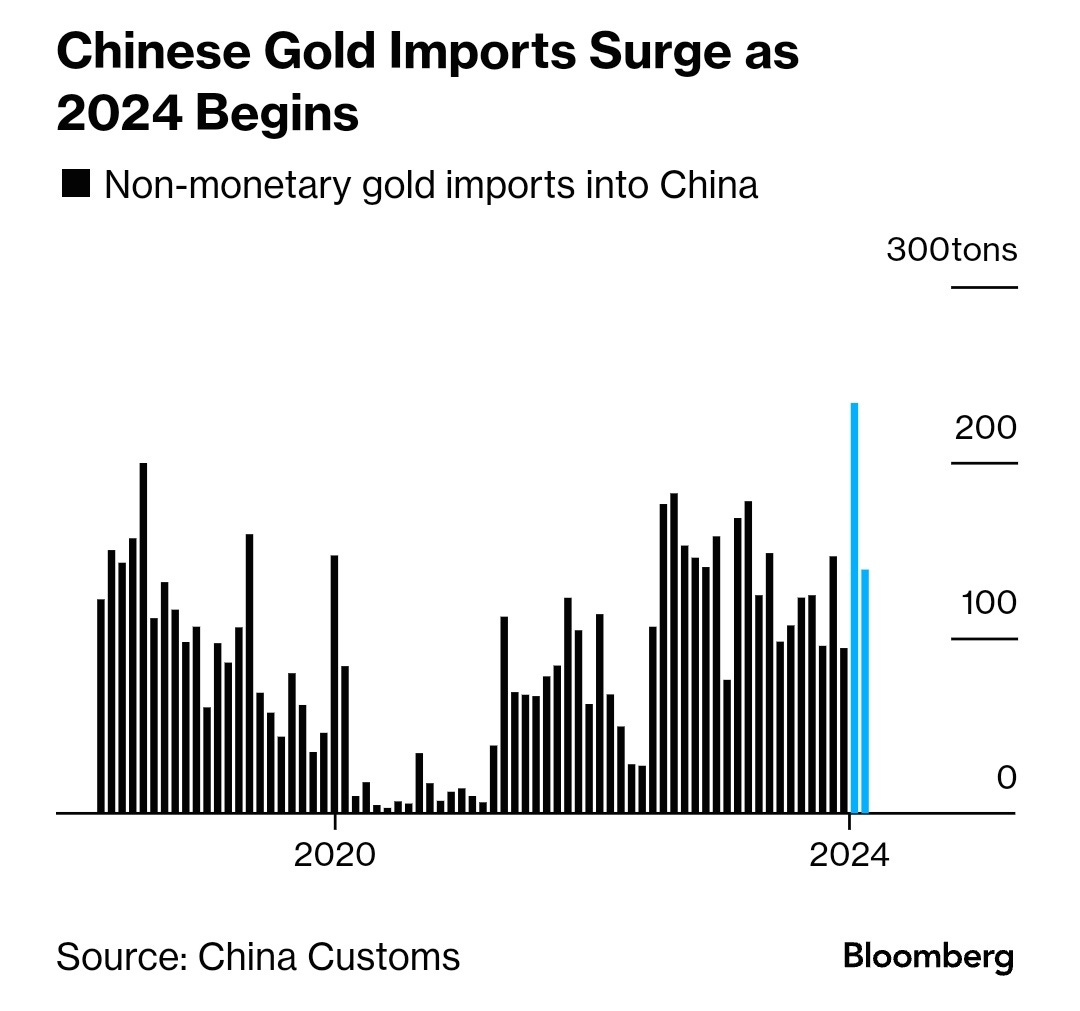
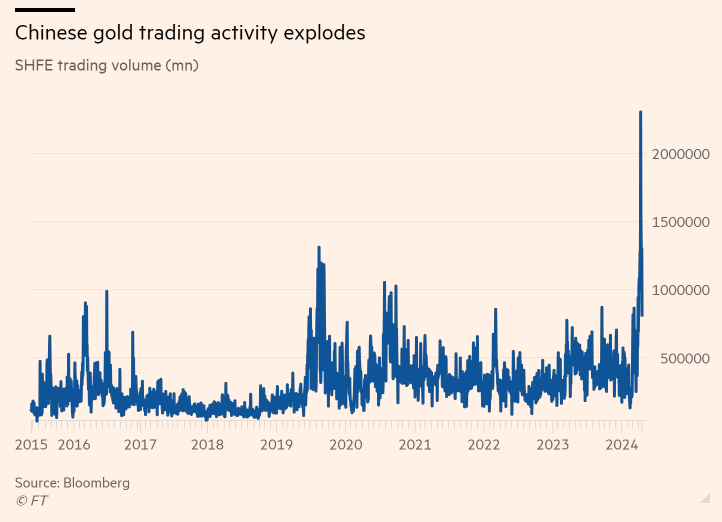
While the property sector has been in meltdown for the last few years, and the Chinese equity markets remain in a bear market, the love for bullion in the mainland has led to constant buying by households.
Over the last two years, overseas purchases totalled over 2,800 tons—more than all the metal-backing exchange-traded funds worldwide.
So, not only are the central banks buying the shiny yellow metal, but also the cash-rich Chinese HHs.

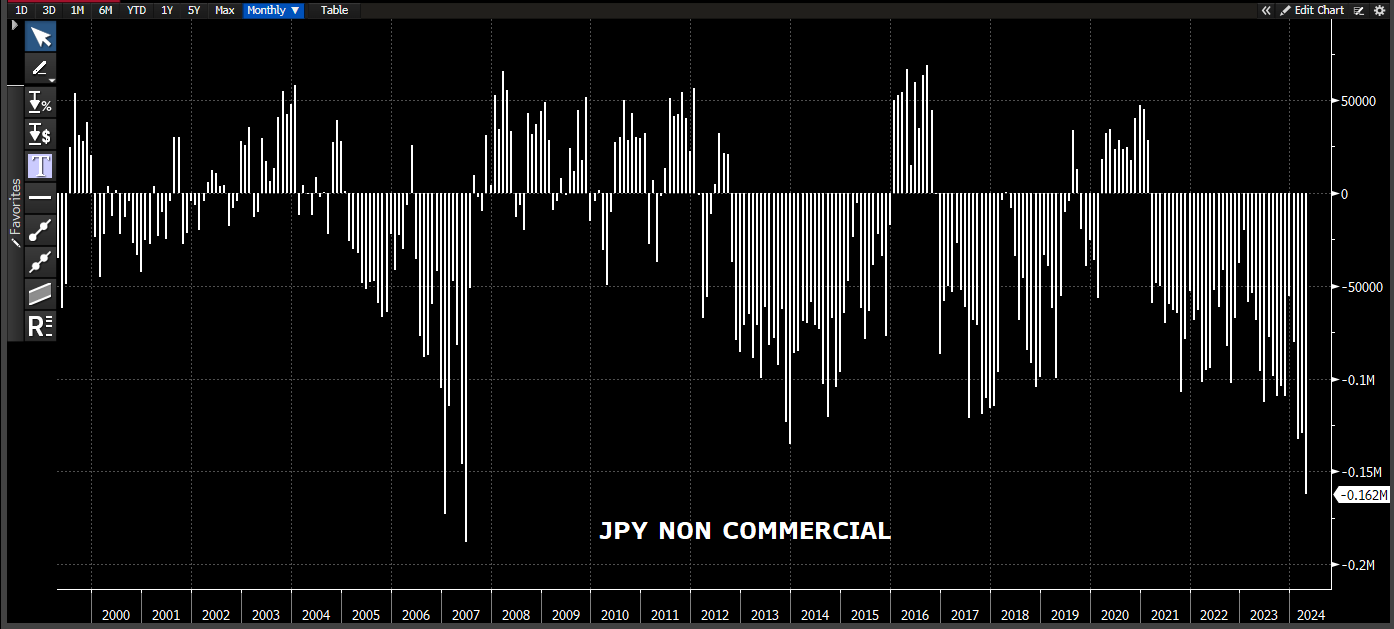
Late April saw a breakout of USDJPY from 152 levels as it plummeted to levels last seen 36 years ago (160).
The real effective exchange rates paint a grim picture, with JPY being the worst performer. Surprisingly, the Egyptian Pound, Turkish Lira and Argentina Peso outperformed the JPY.
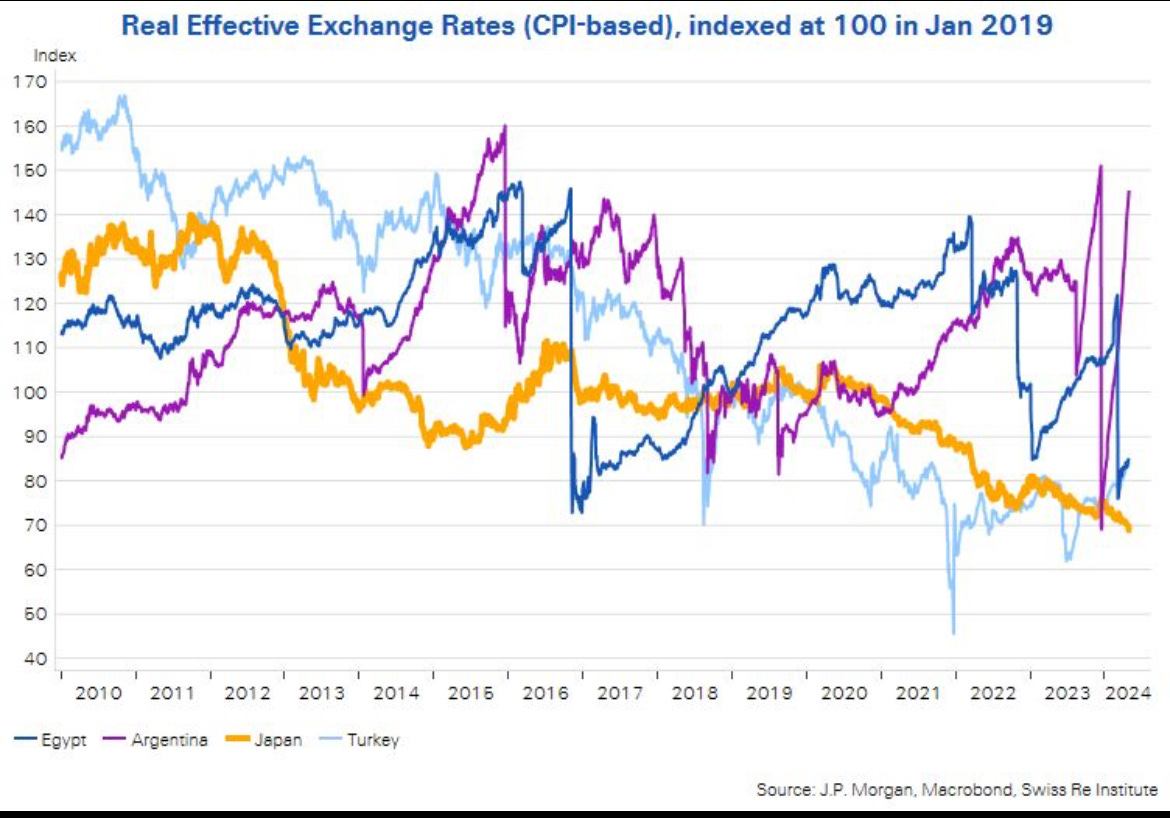

To stop the free fall of JPY, the Ministry Of Finance (MOF) intervened and likely ploughed $50 billion to stem the rise in the USDJPY.
The million-dollar question is: Will it be enough to drive away the speculators who have built the biggest short position in JPY ever?

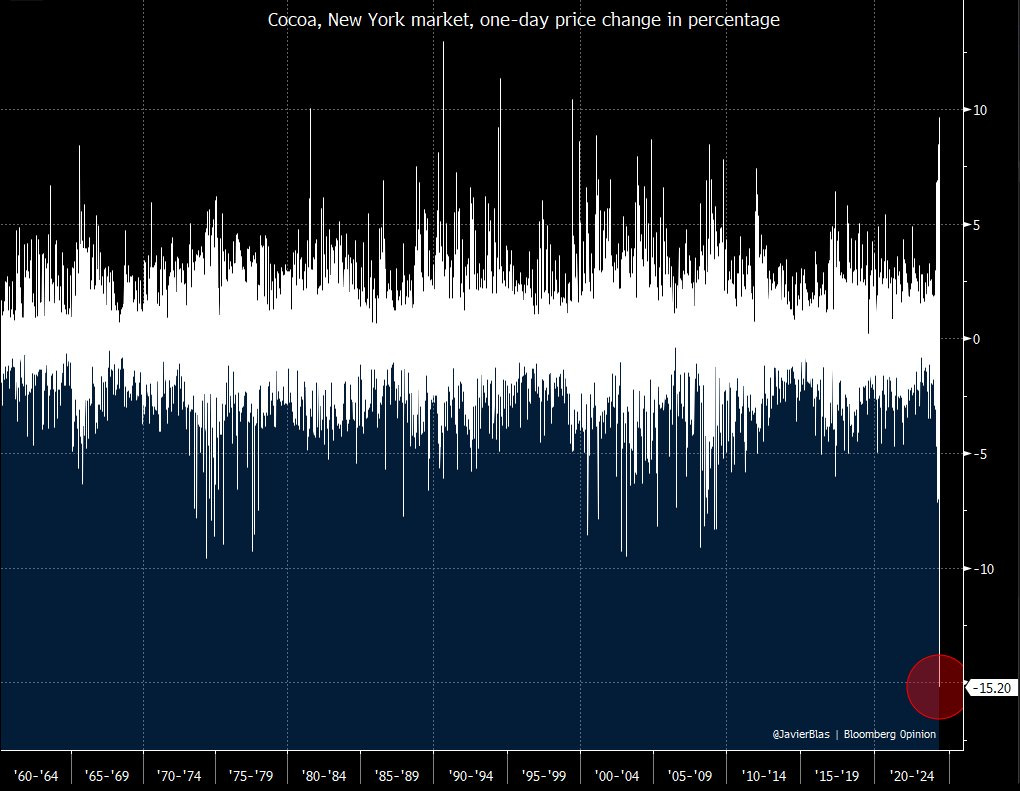
BONUS CHART: March saw a crazy rally in Cocoa as prices skyrocketed and tripled in just a few weeks.
Well, folks, yesterday, Cocoa witnessed its biggest fall in history, with prices crashing by 15% in 24 hours (think liquidity).
Has the cocoa bubble burst?

We can’t end the April Month In Charts edition without mentioning the shiny yellow metal.
Last month, we demonstrated that the two-decade-long negative correlation between Gold and real yields has broken. As we mentioned earlier, one of the reasons has been the unprecedented demand from Chinese households.

Let that sink in!
Disclaimer
This publication and its author is not a licensed investment professional. The author & any other individuals associated with this newsletter are NOT registered as Securities broker-dealers or financial investment advisors either with the U.S. Securities and Exchange Commission, Commodity Futures Trading Commission, or any other securities/regulatory authority. Nothing produced under Marquee Finance by Sagar should be construed as investment advice. Do your own research and contact your certified financial planner or other dedicated professional before making investment decisions. Investments carry risk and may lose value; Marquee Finance By Sagar LLC, Marqueefinancebysagar.substack.com or Sagar Singh Setia is not responsible for loss of value; all investment decisions you make are yours alone.