

Equity market bears had to run for cover as we saw a stealth rally led by the semiconductor names.
Countries with exposure to these names (South Korea, Taiwan, Japan and the US) have outperformed since the March lows.
The bond market bulls were annihilated as benchmark yields soared, with markets pricing in higher inflation over the next few quarters and hawkish central banks.
Let’s examine 14 charts to analyse the cross-asset price action and global macro!
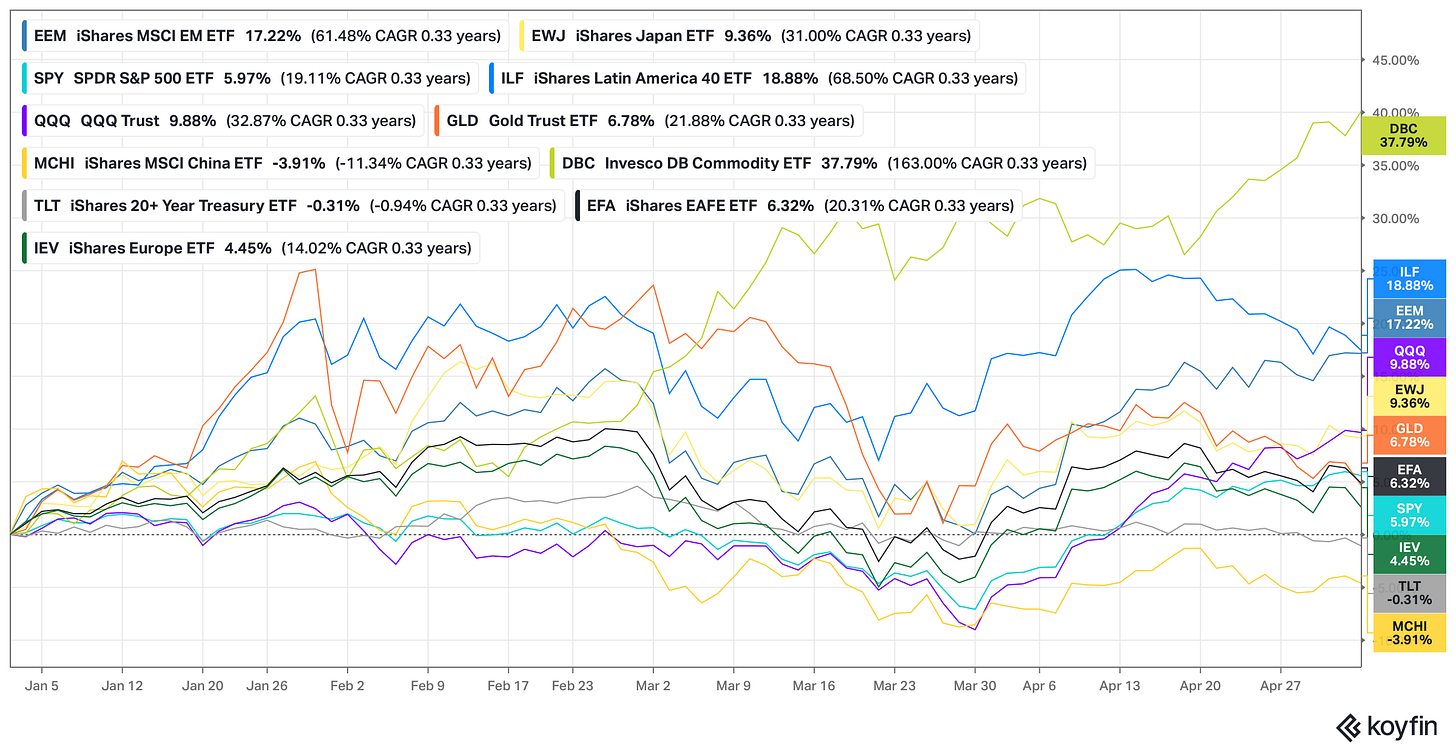
Led by a nearly 100% rise in crude oil prices YTD, DBC is the top performer this year.
Thanks to commodities’ outperformance, LATAM markets continued their winning streak, with the benchmark ETF ILF up 19% YTD (though it has underperformed over the last two weeks).
Gold lost its sheen after a stellar rally in January and is up less than 7%, as sentiment has turned bearish and technicals have followed suit.
The US eroded some of its underperformance relative to both its DM and EM peers. While the Emerging Market ETF EEM is up 17% YTD, the MSCI European ETF IEV is up 4.45% compared to a 6% gain for SPY and 10% gain for the QQQ.
China and long-term bonds have been the stark underperformers.

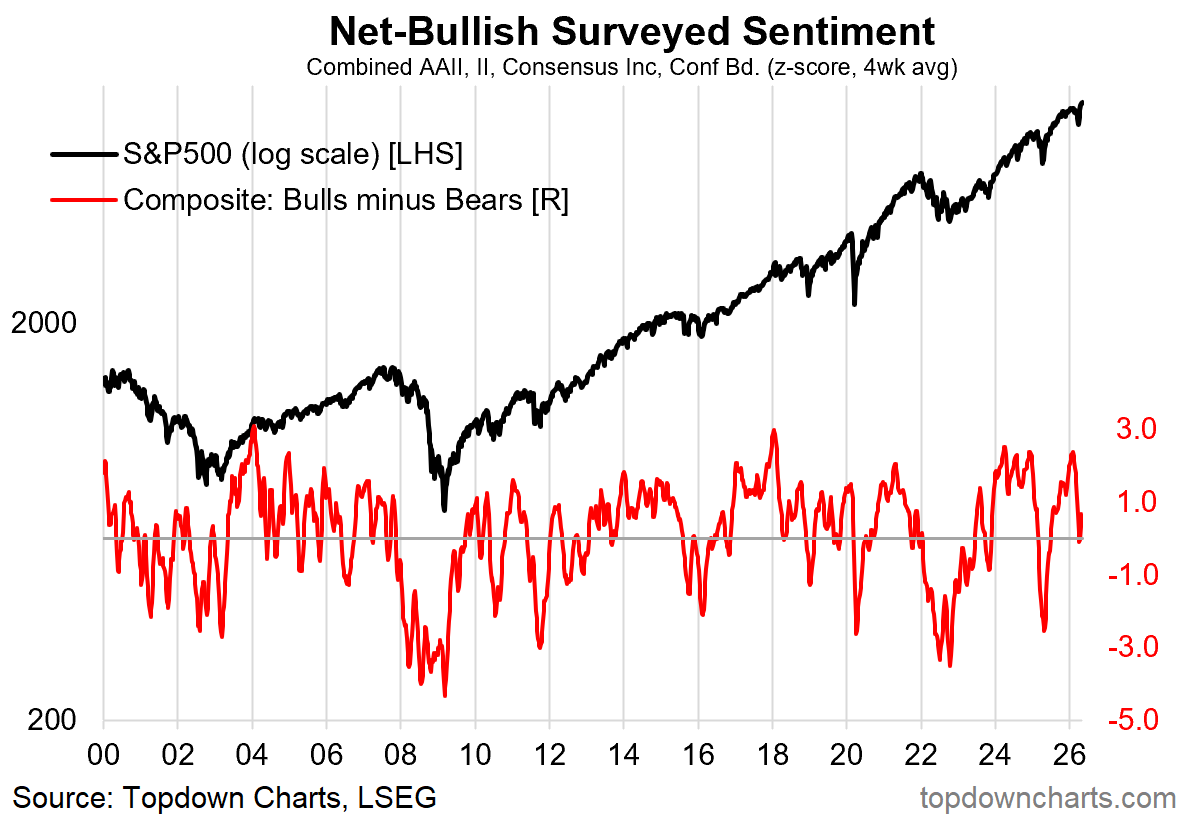
While indices have conquered new peaks, the Net-Bullish sentiment is far from euphoric.
In fact, the neutral sentiment could lead to further gains in equity markets, which have been on a one-way ride without a breather.

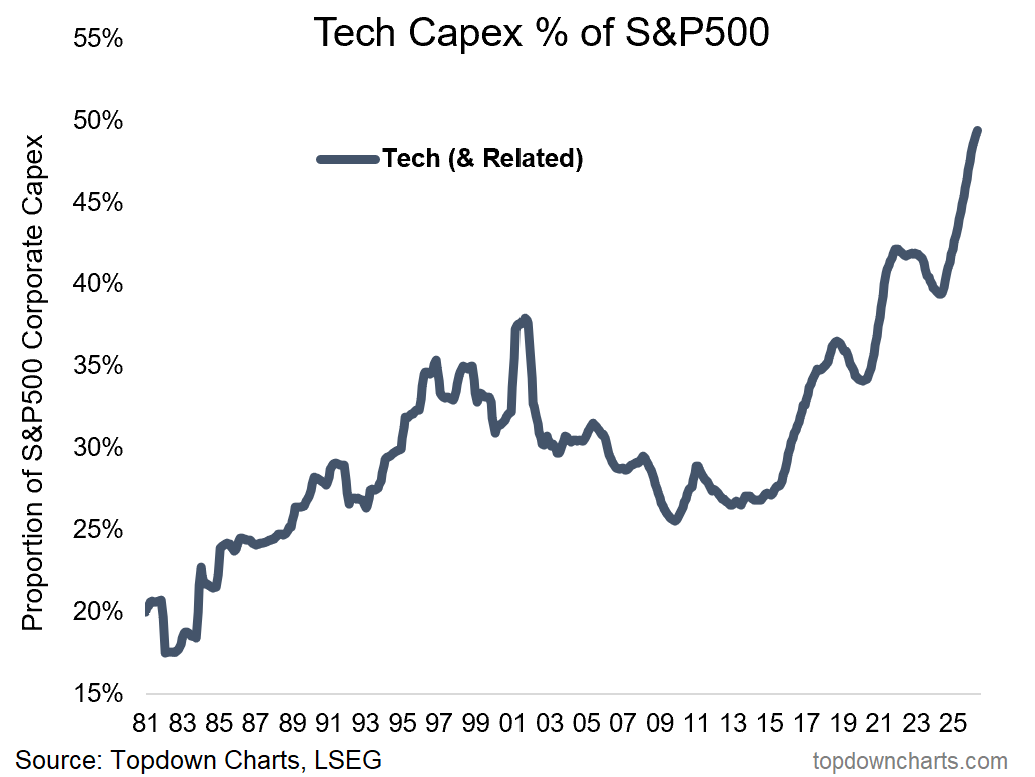
As hyperscalers go all in to meet the humongous AI demand, tech capex as a % of S&P500 has scaled to new highs, now exceeding 50% of total S&P500 capex.
Unsurprisingly, only a handful of stocks are responsible for this enormous capex.

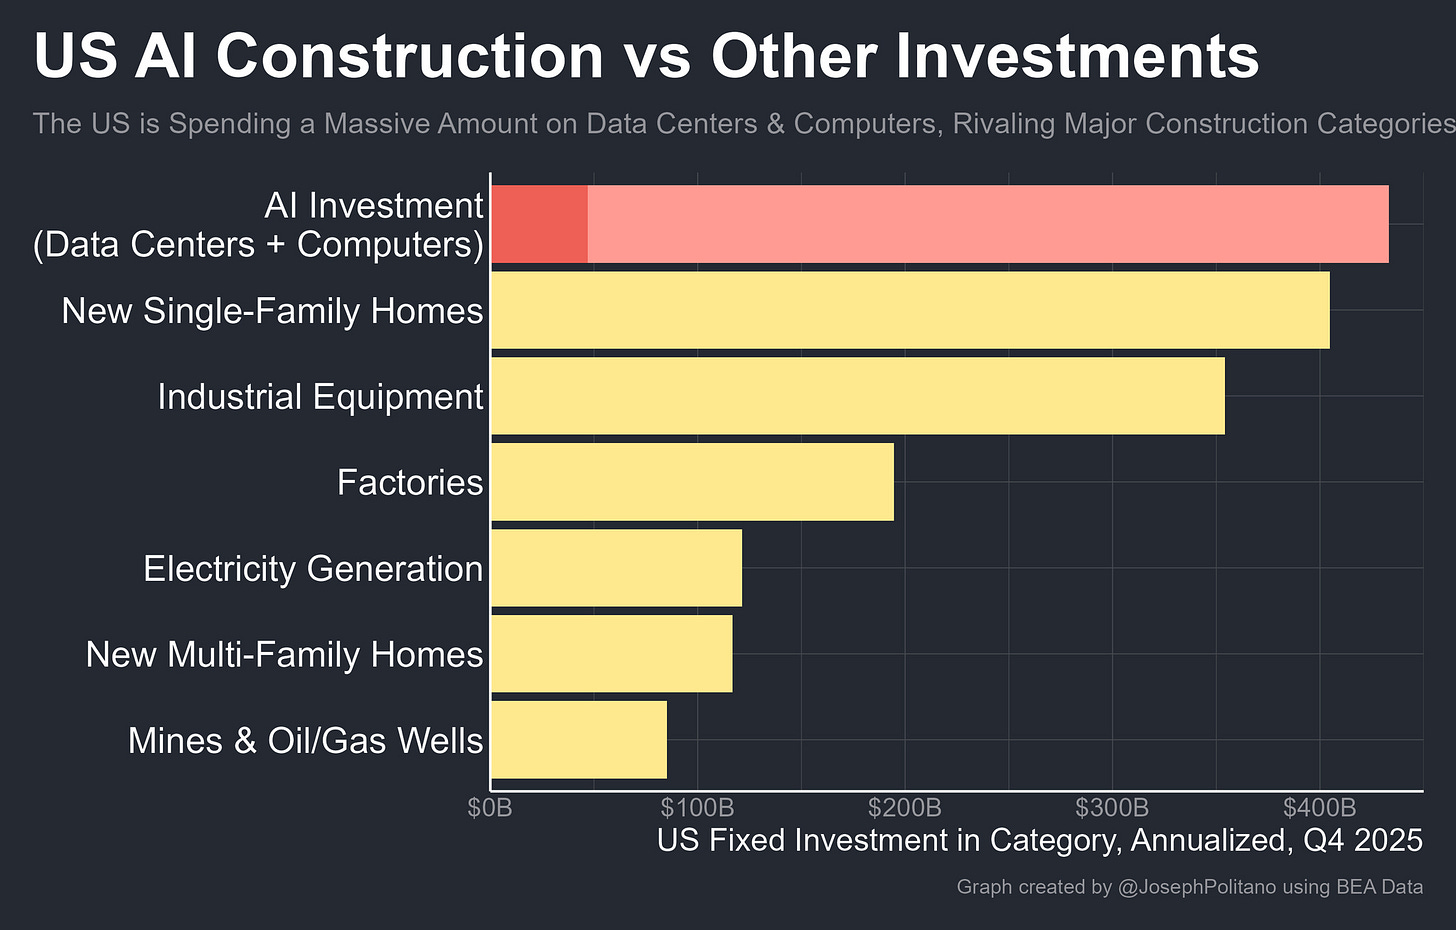
Considering the $800 billion of AI capex, it’s a no-brainer that a large proportion of the incremental growth in Q1 GDP came from AI investments, which have now overtaken even New Single-Family Homes investments!
We have now surpassed the dot-com levels, and Computer Equipment Investment as a % of Total GDP has exceeded 1.2%.

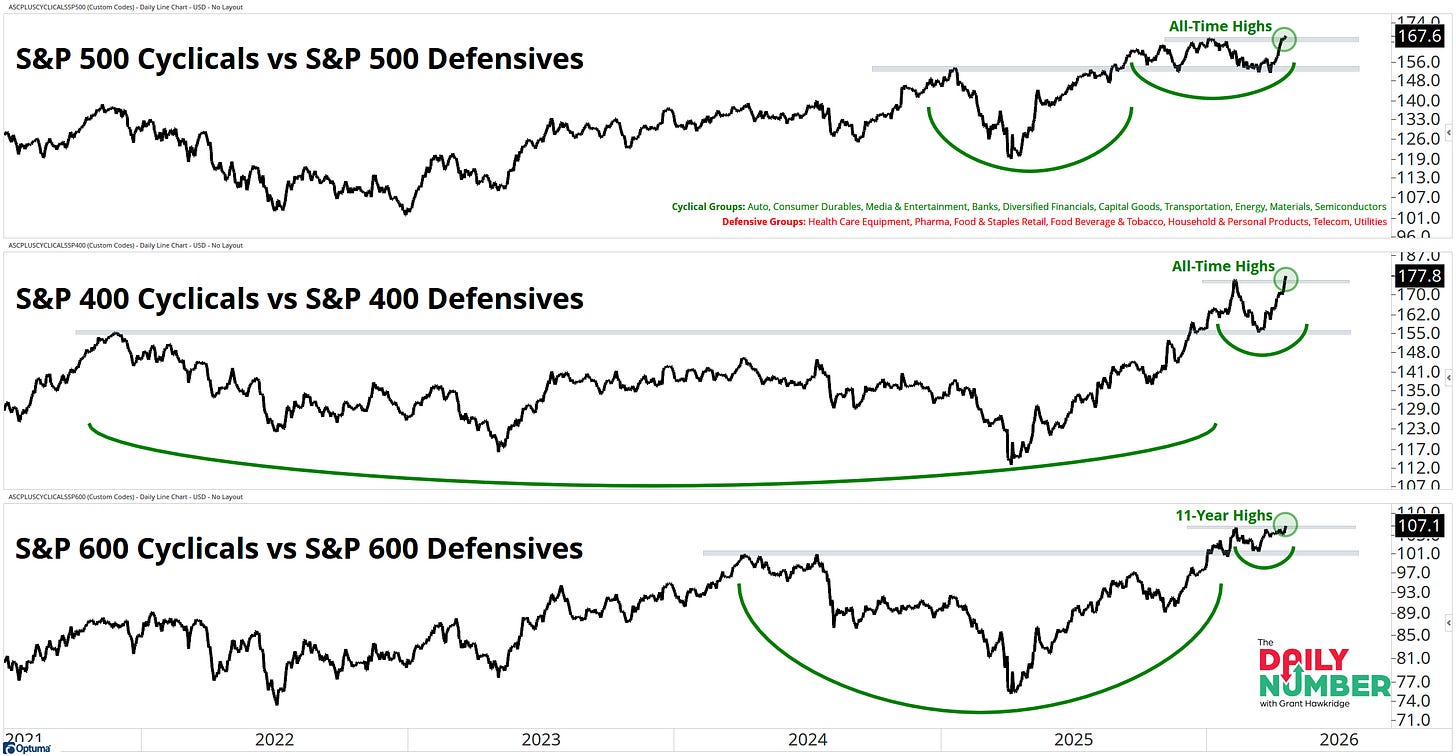
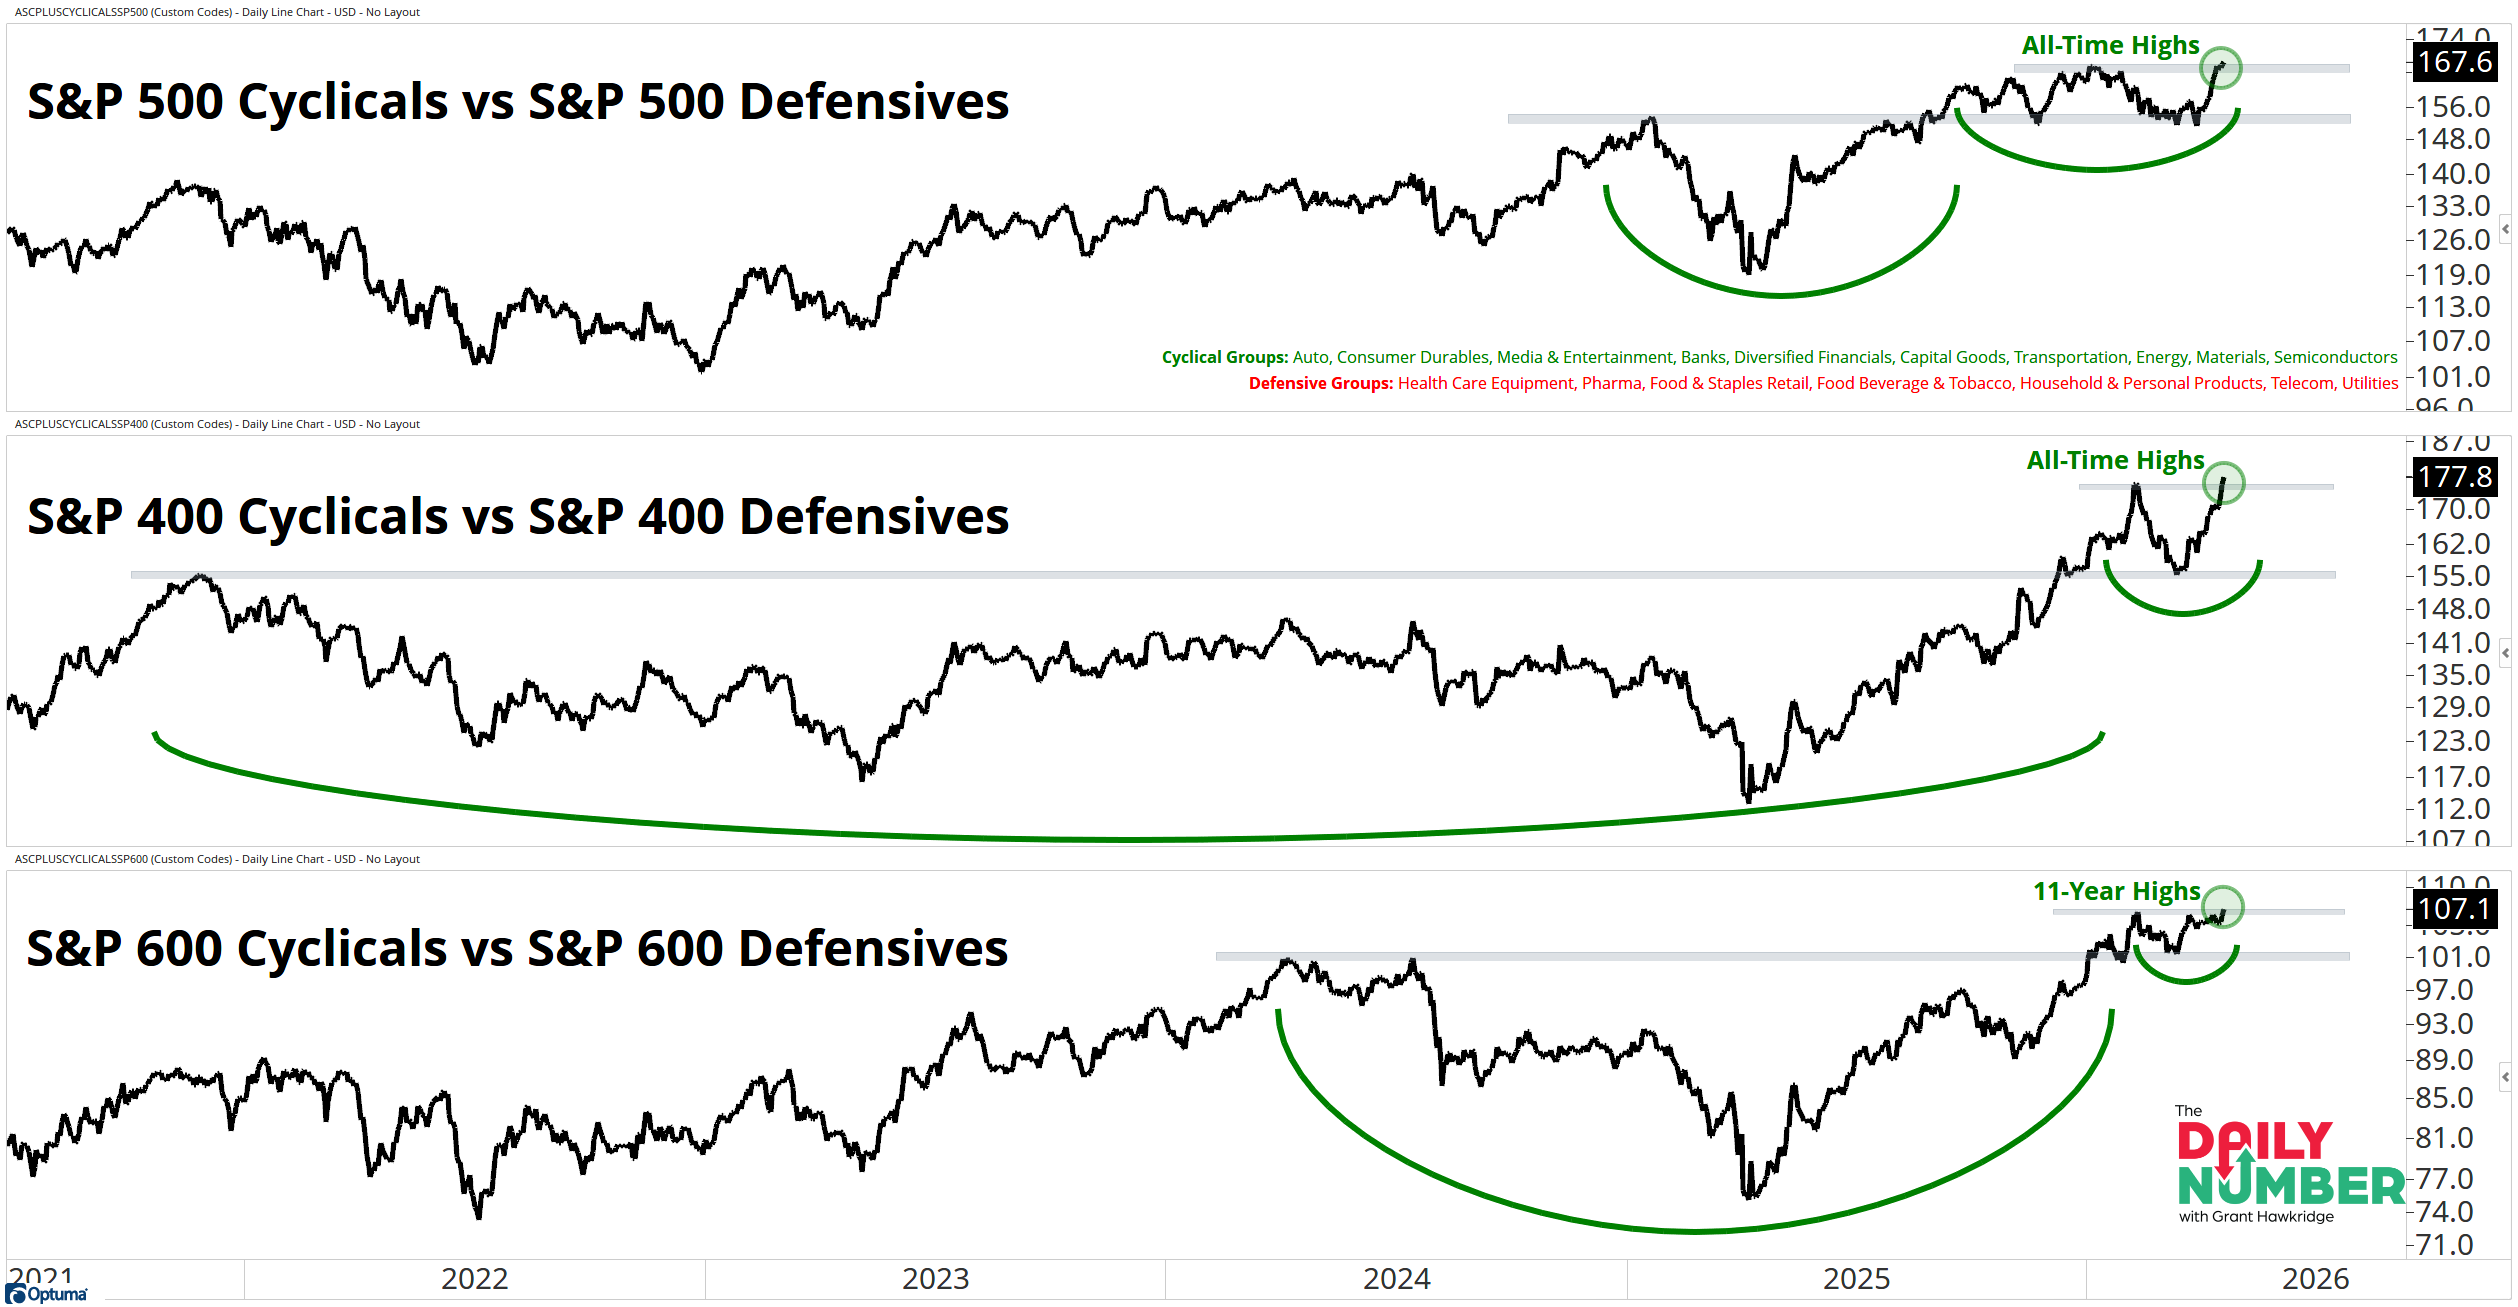
This has also led to money flowing into the old economy, with power, infrastructure, and energy accounting for a large share of AI investments.
As a result, we are witnessing the strong performance of Cyclicals relative to defensives.
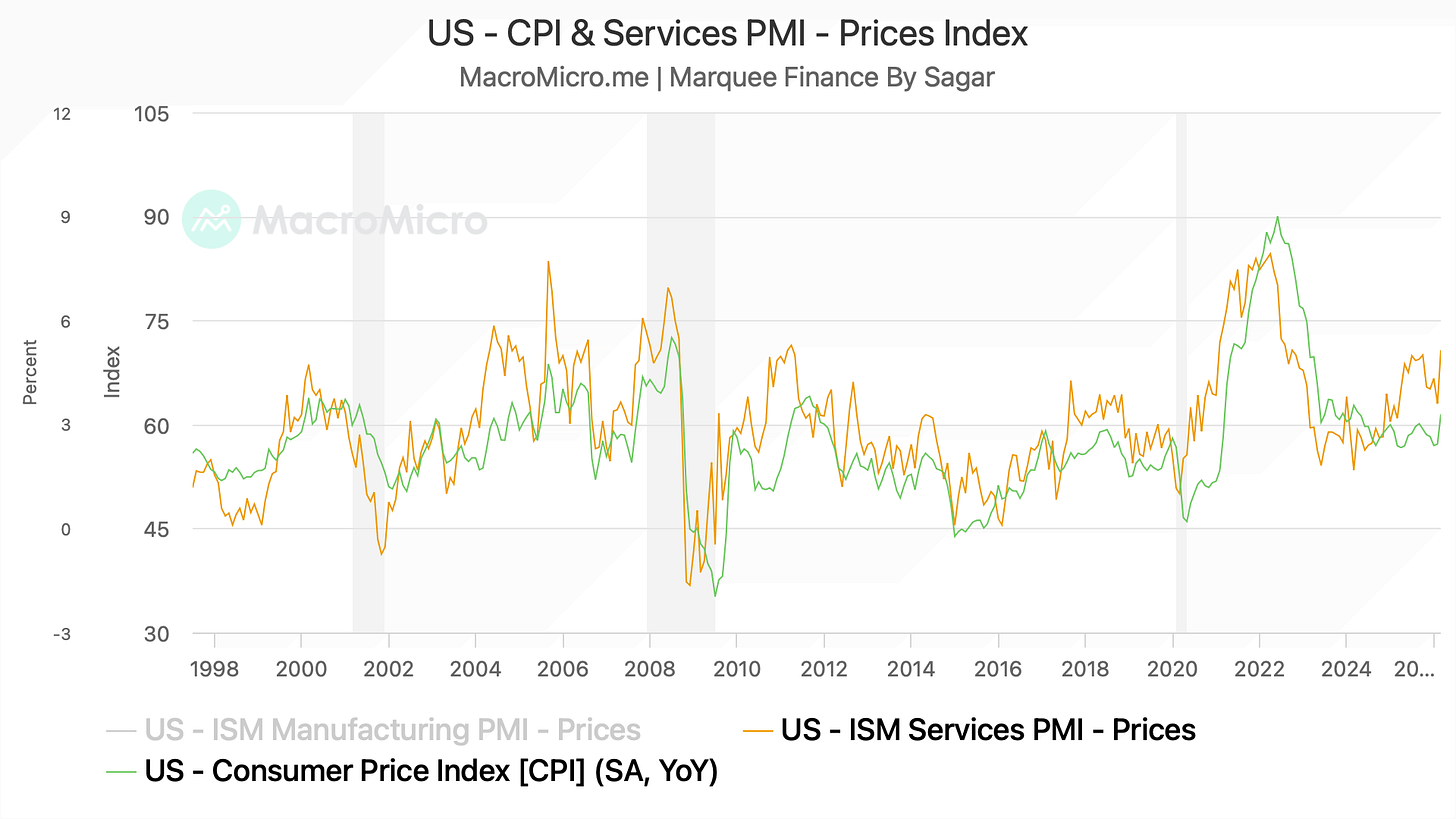
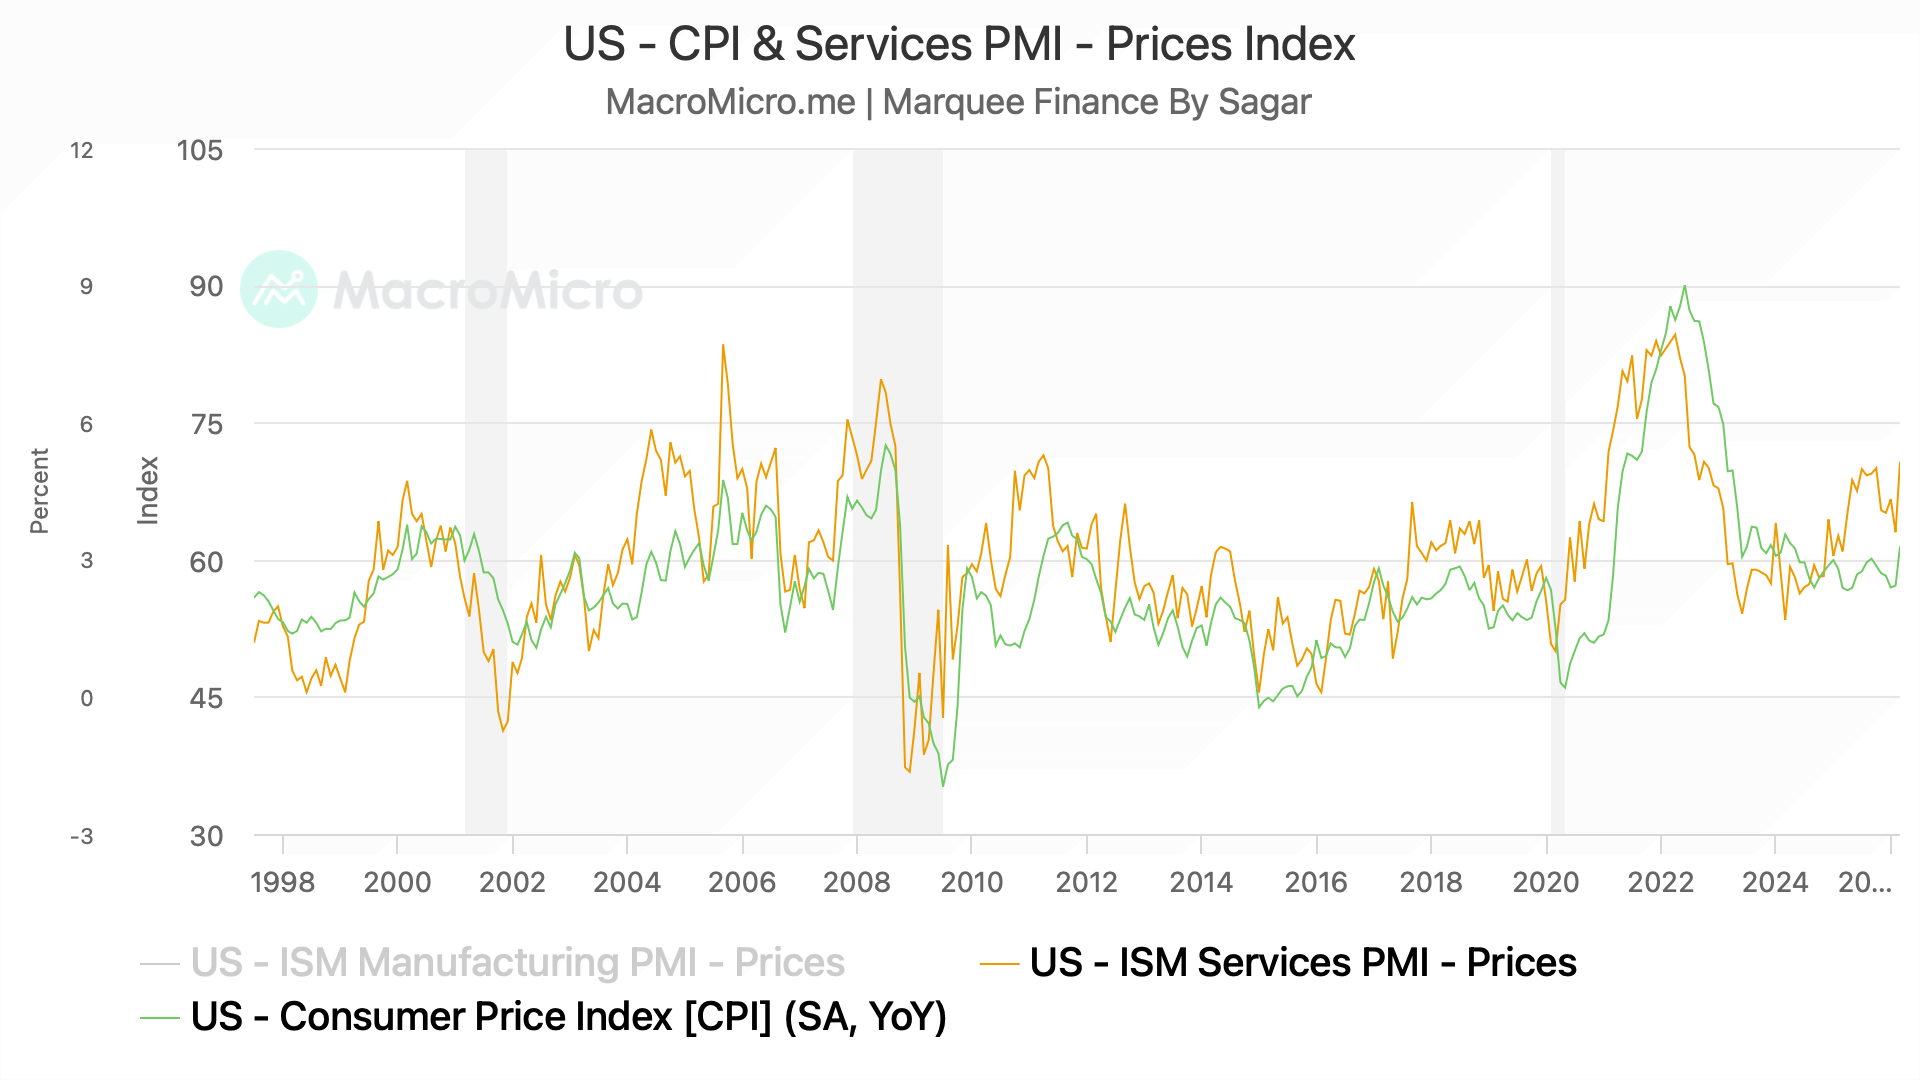
The rise in oil prices due to geopolitical conflict in the Middle East is driving prices significantly higher, as the US CPI came in at 3.3% YoY, the highest since 2024.
If ISM Services PMI is to be believed (it has a tight correlation with CPI), we are heading toward 4% in the next few months.
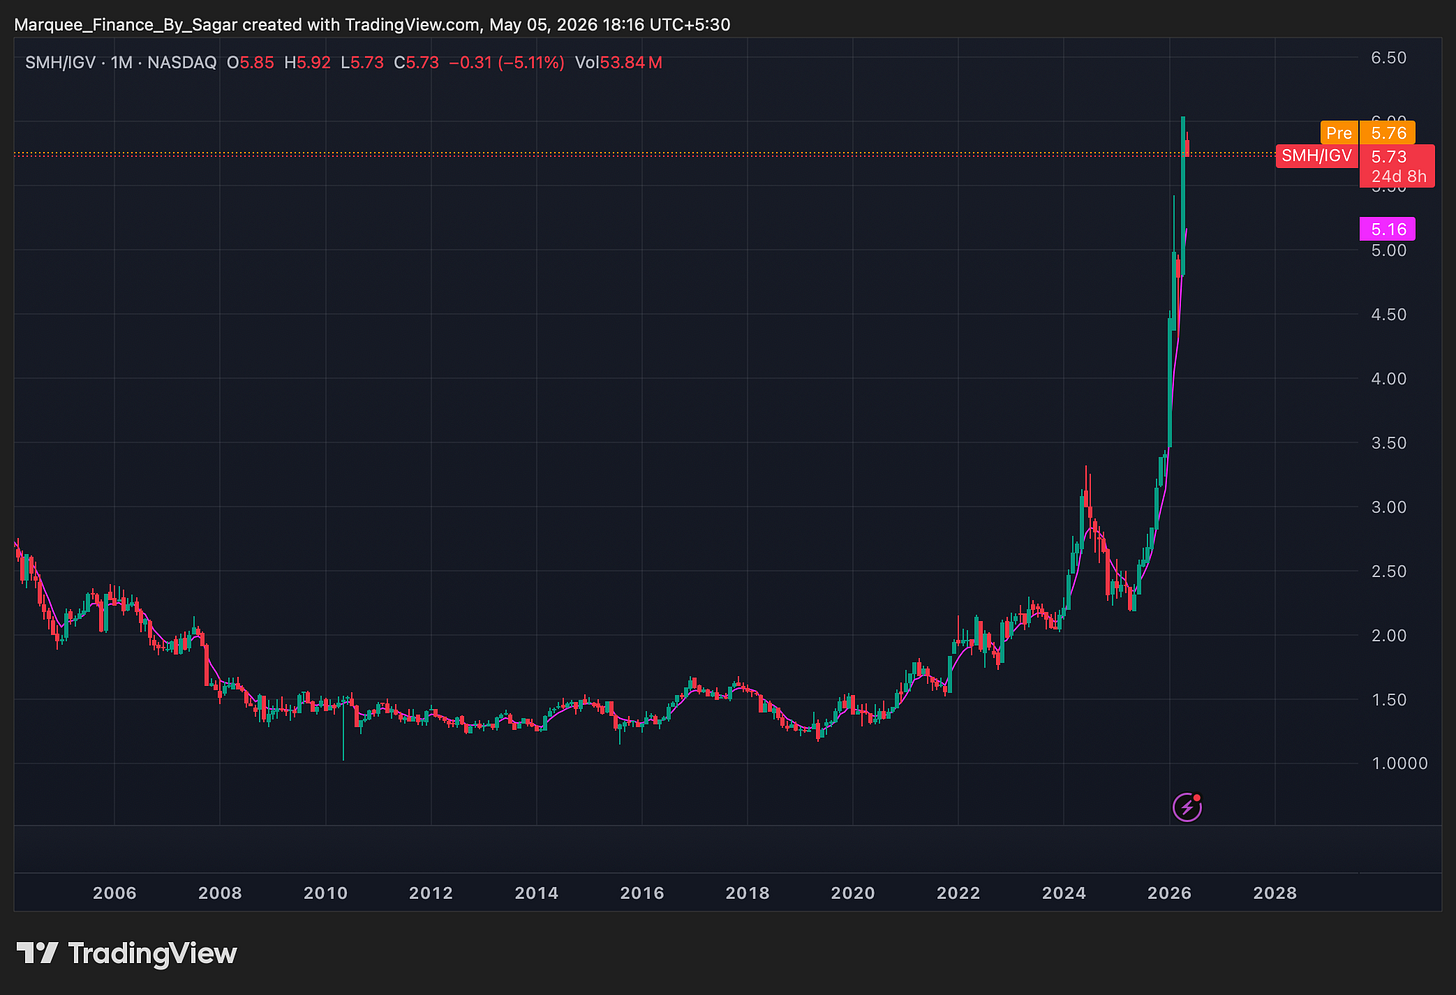
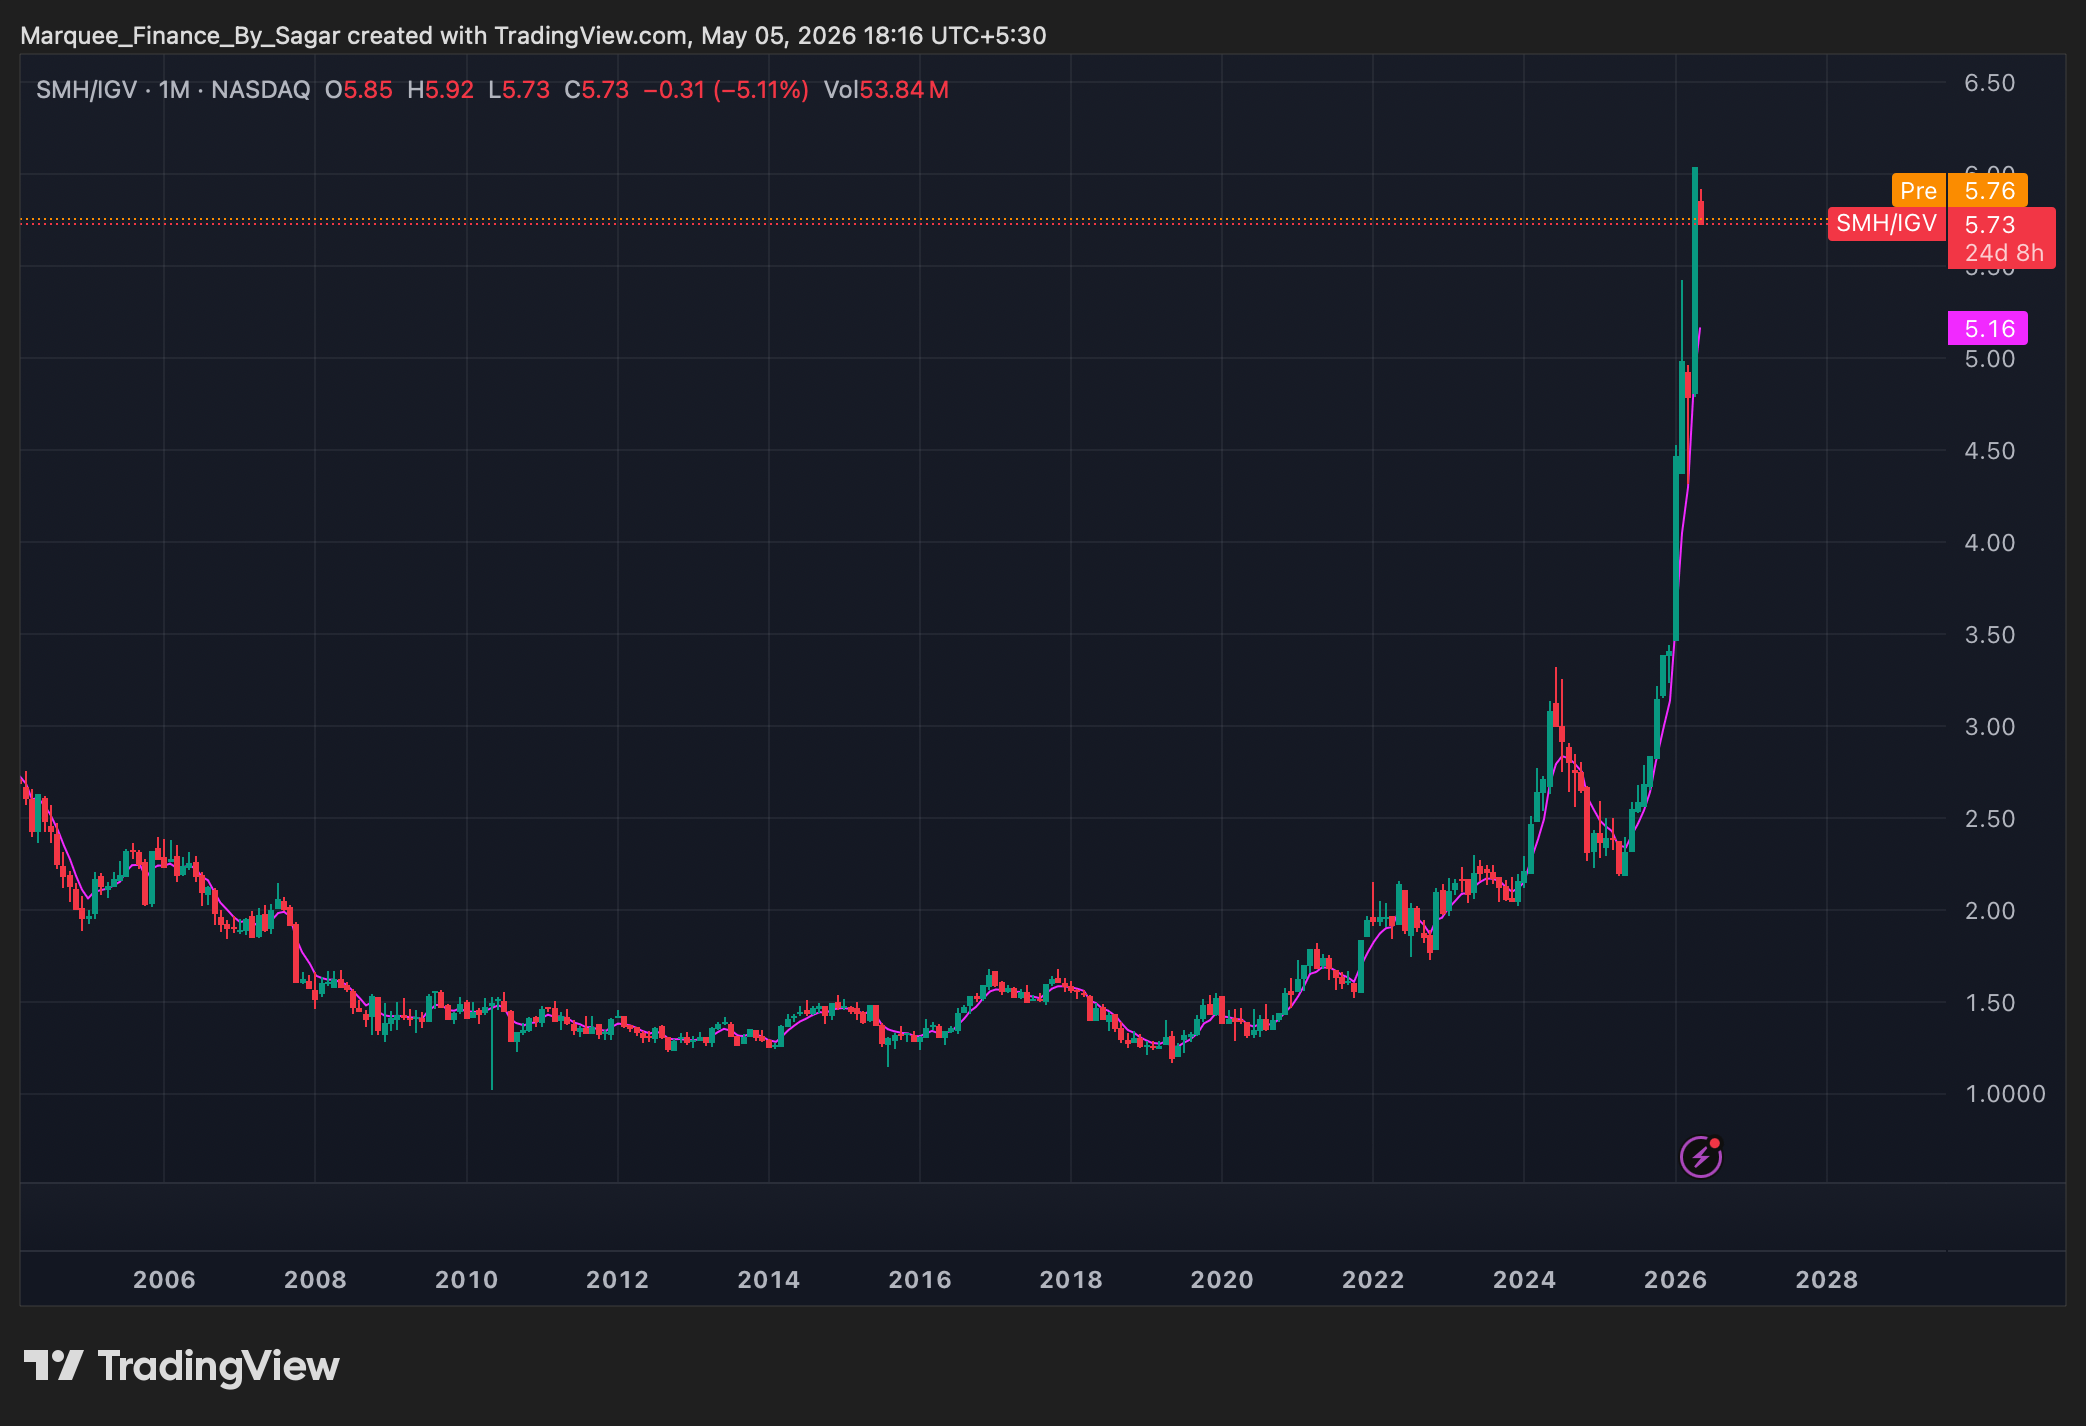
We are witnessing a historic trade in the financial markets as market participants go all in on a Long Semis/Short Software trade.
The relative strength of the Semis, as measured by SMH/IGV, has reached mind-boggling levels.
Nobody can predict the top, but one thing is certain: parabolas "always" end the same "painful" way.Did we see the peak last month, and is the Hardware-to-Software rotation imminent?
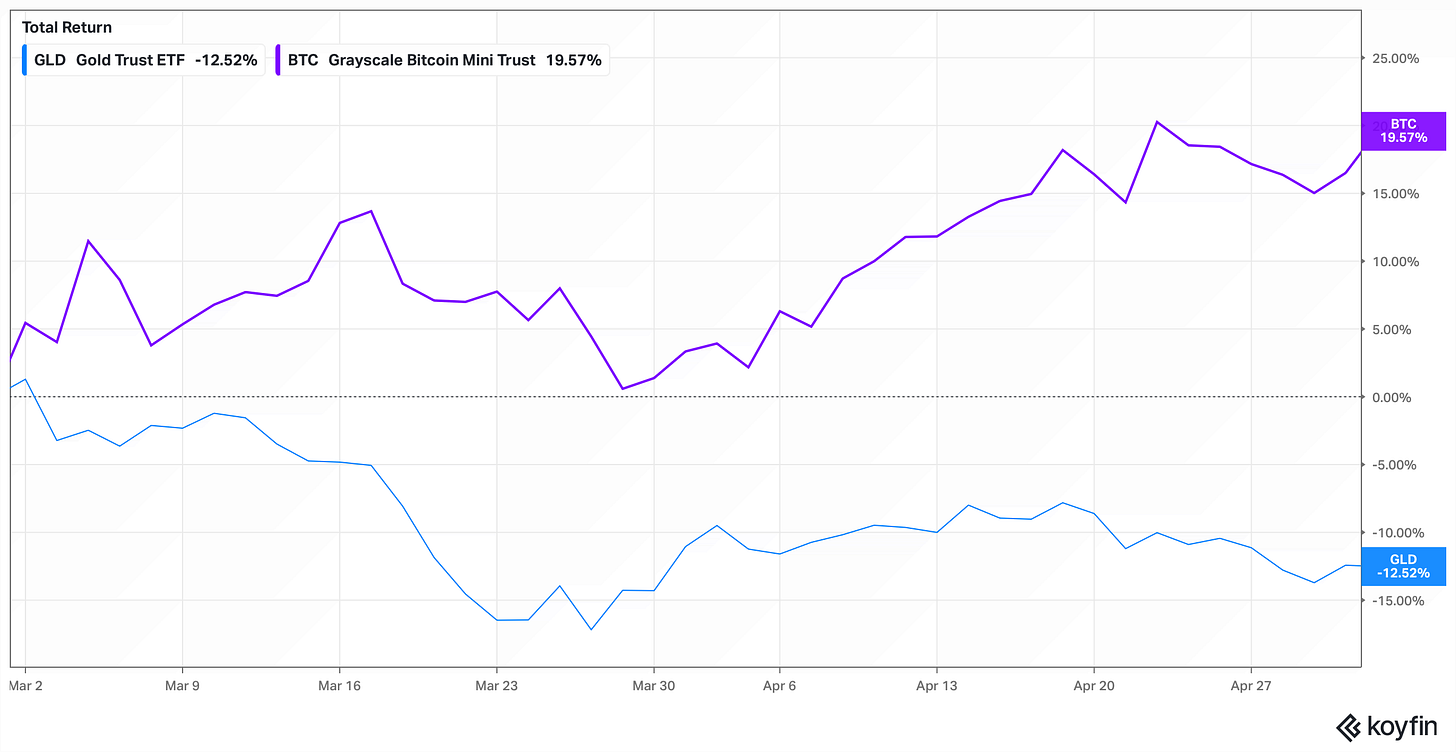
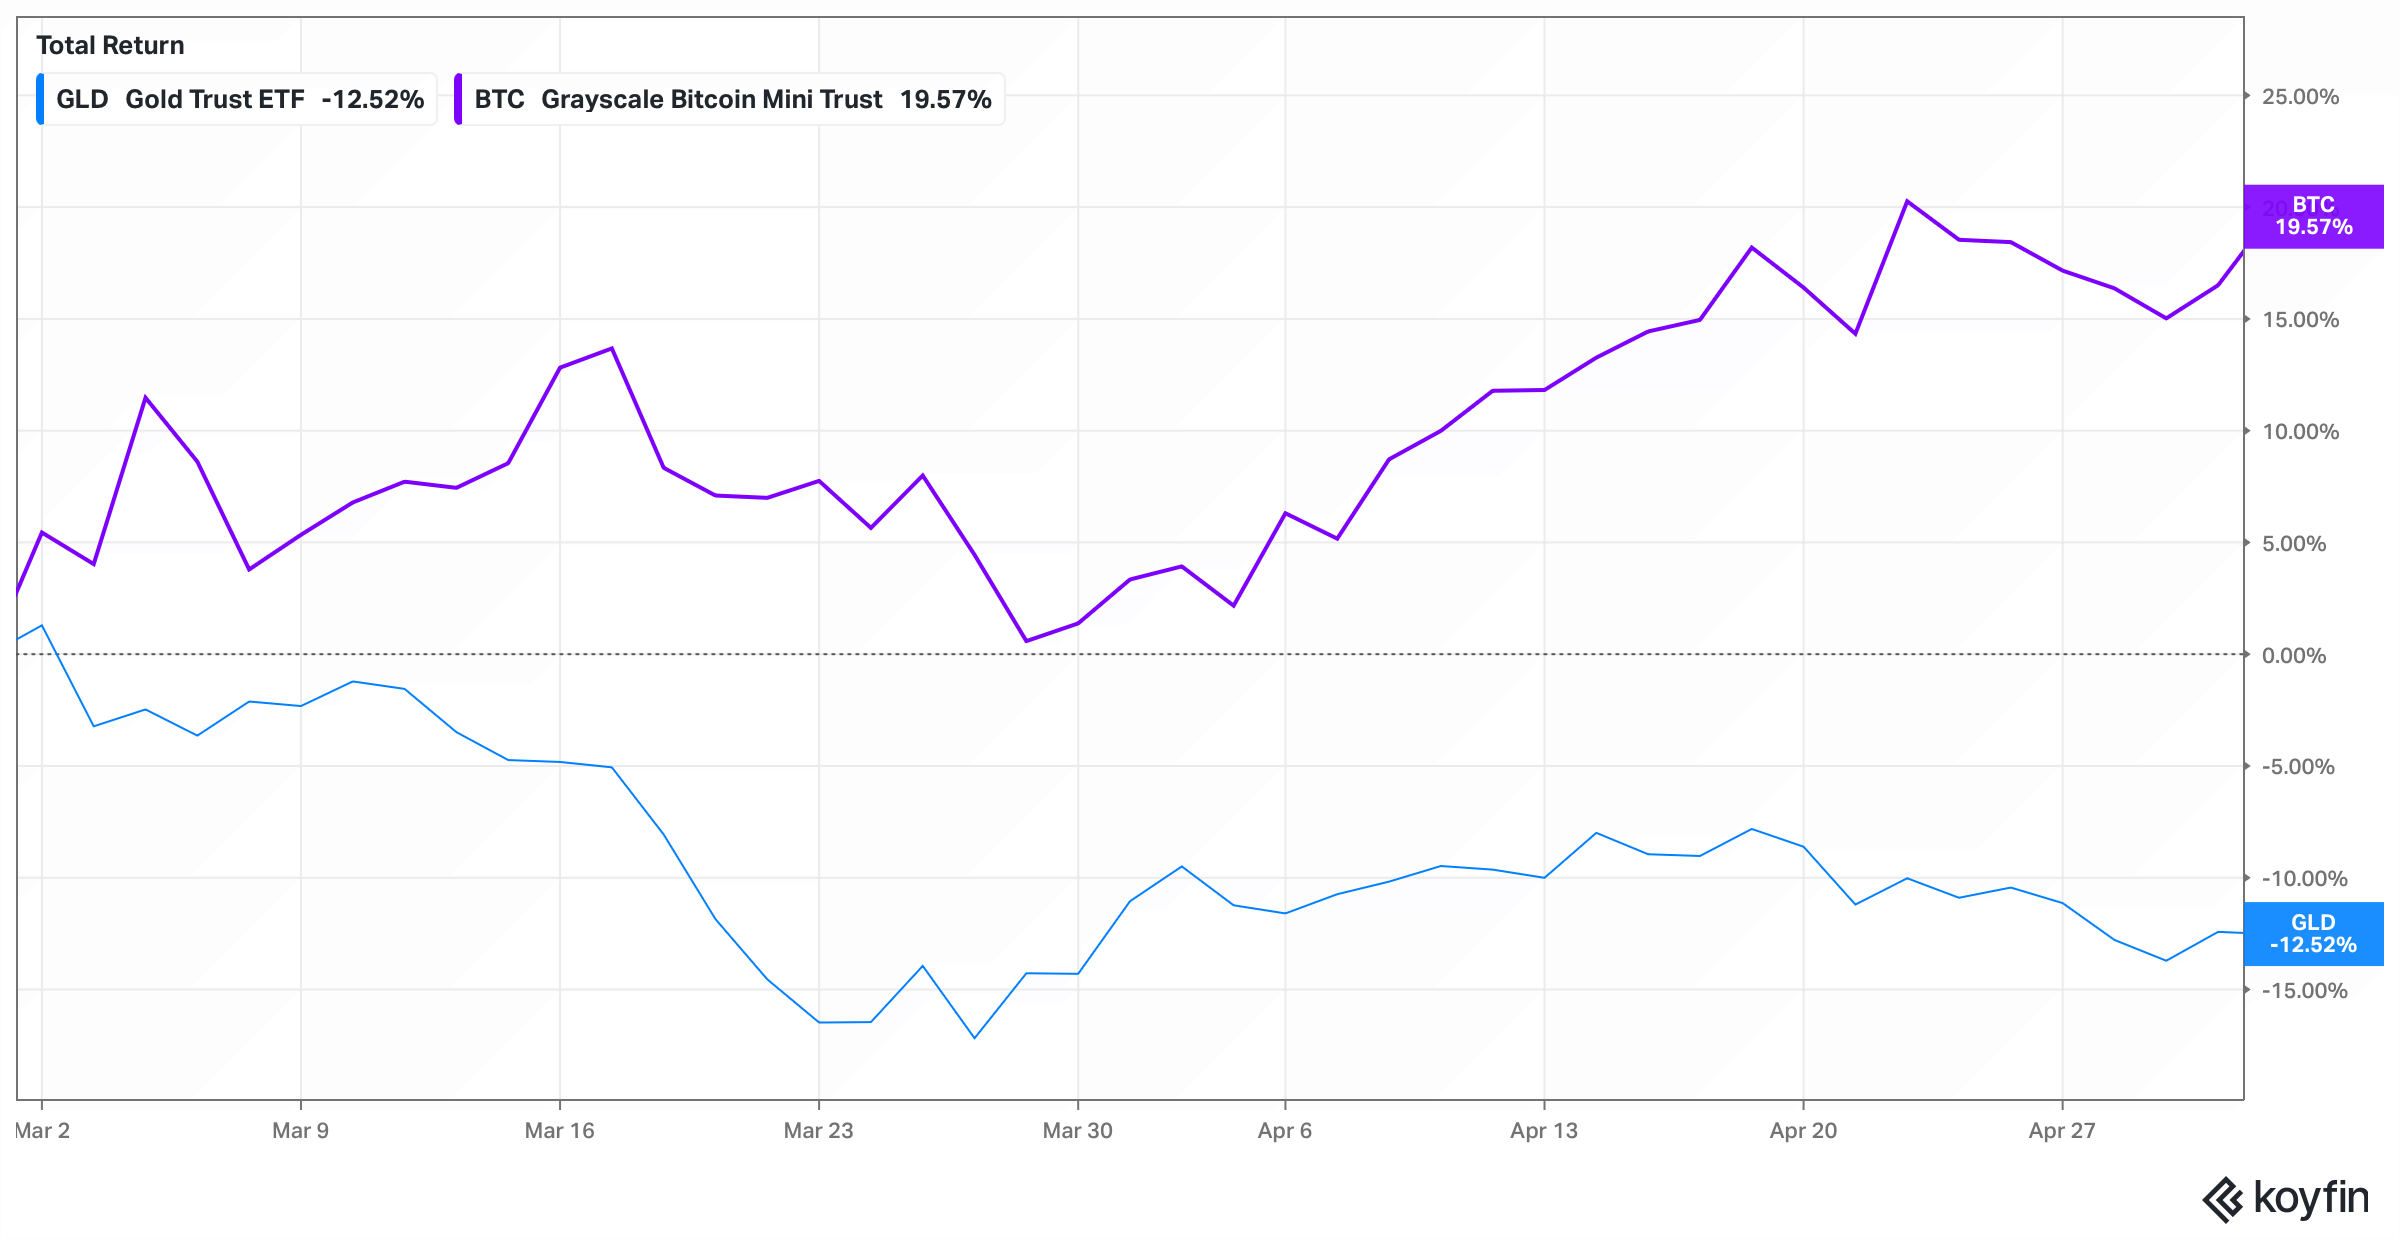
Since the war began, there has been a massive rotation from Gold to BTC.
In fact, we have seen a 30%+ delta, and it has been a rewarding trade for those who sold Gold at the top in late January and bought BTC as it hit key technical support levels in February.
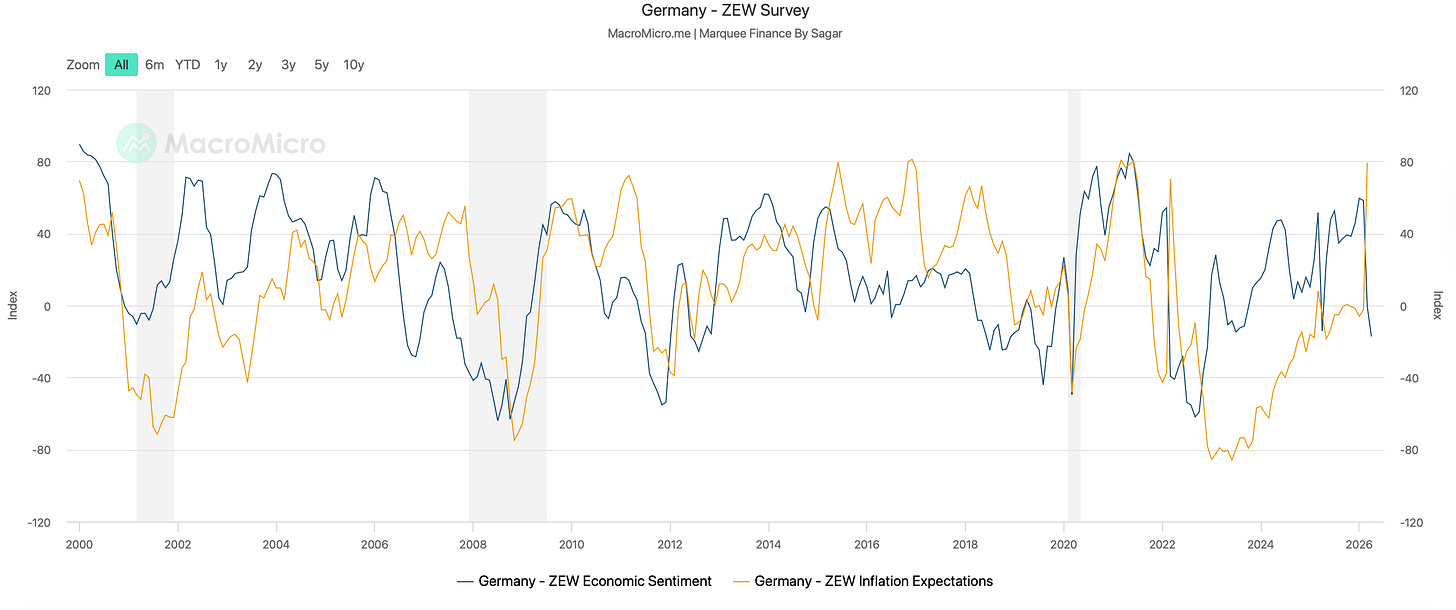
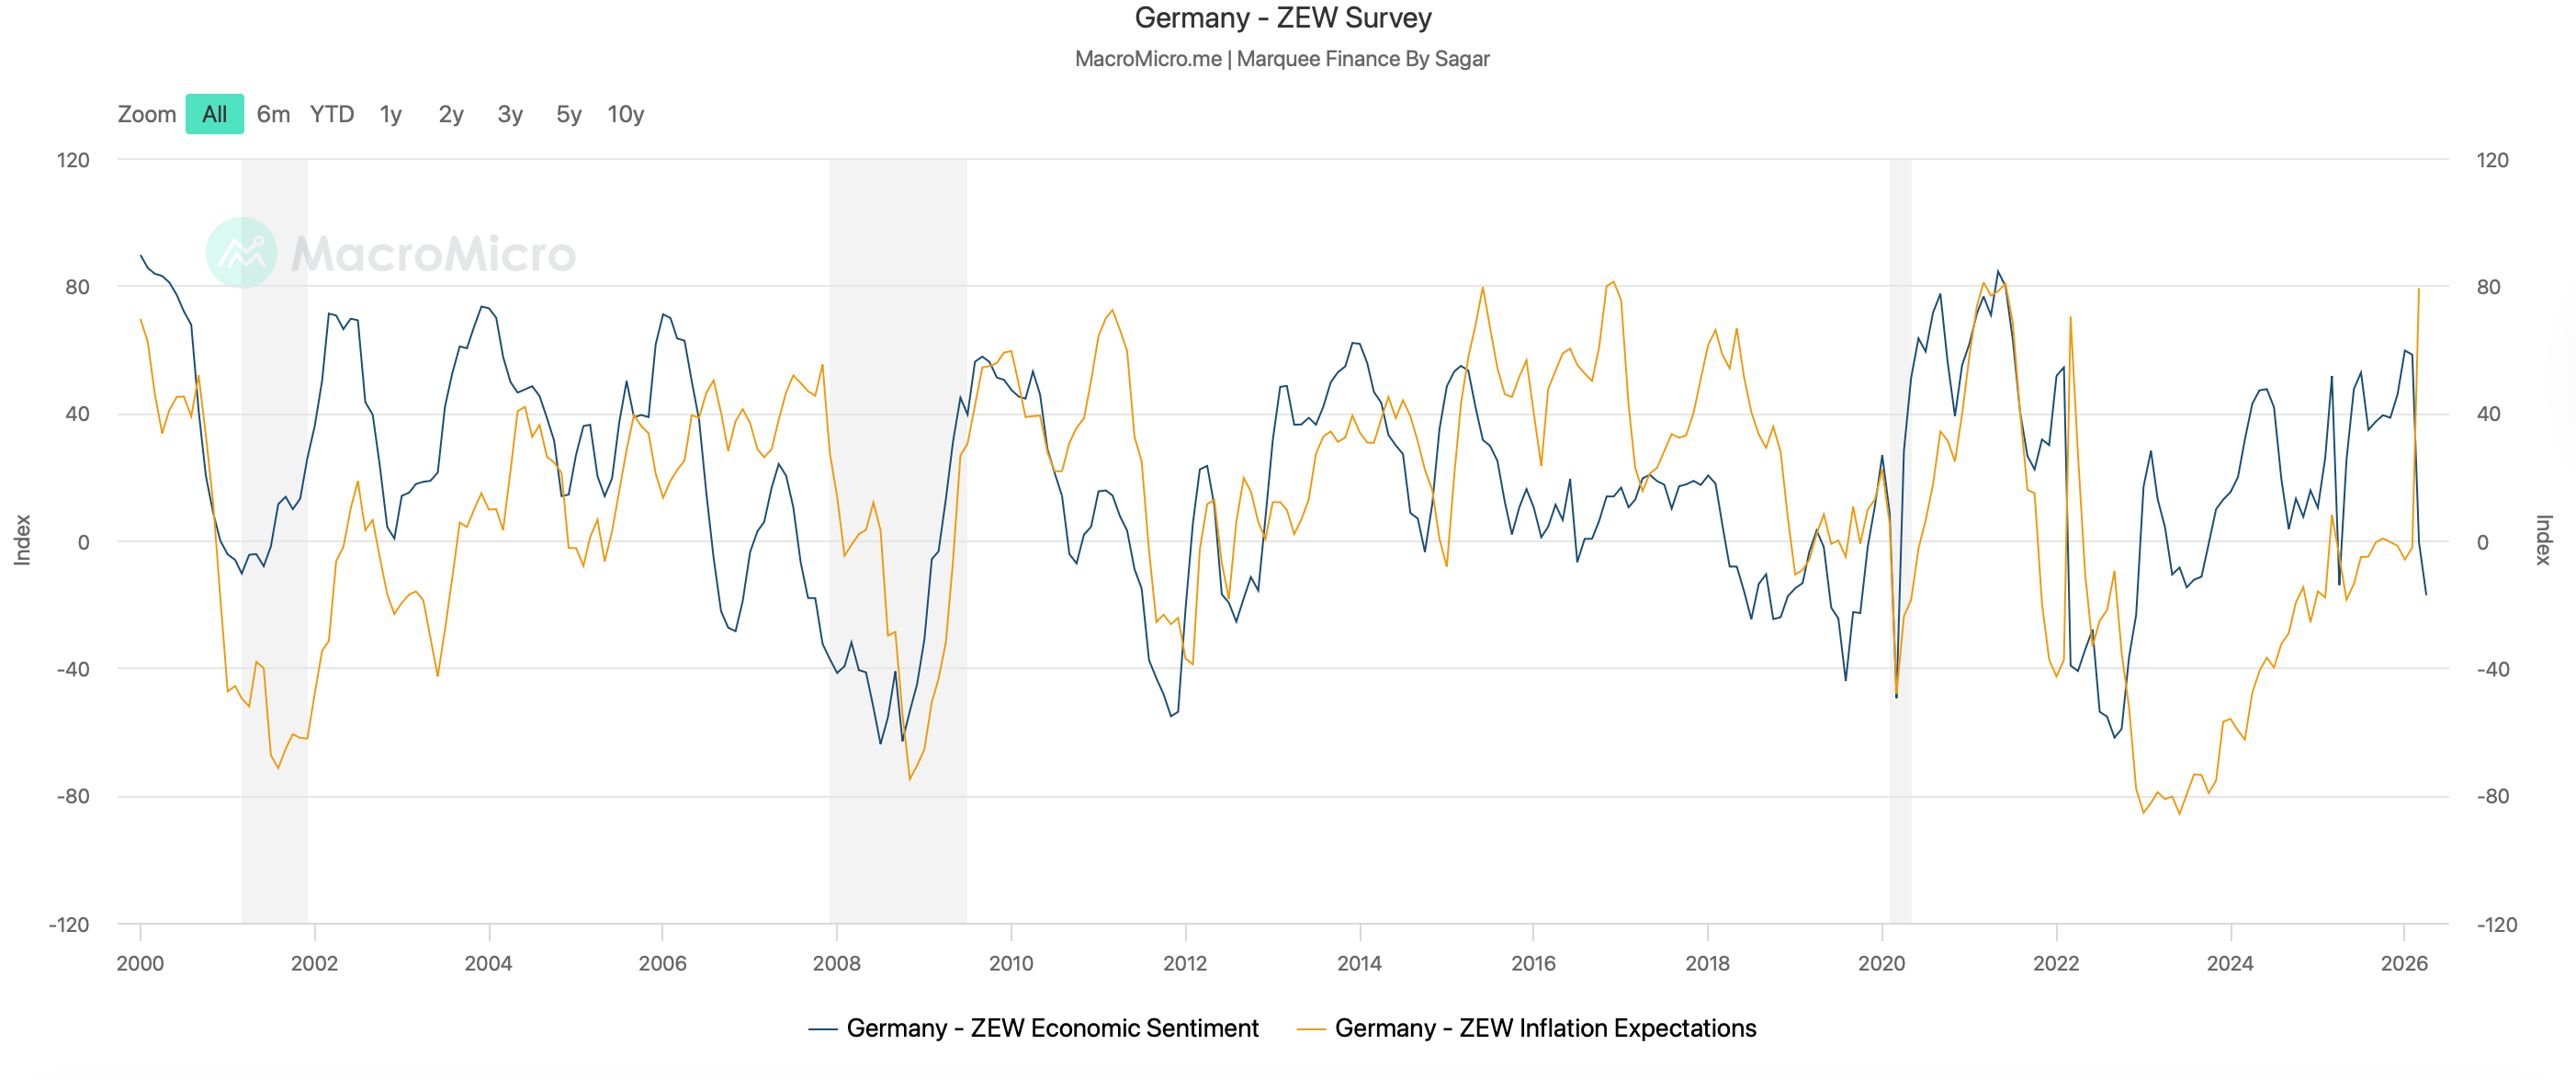
Sentiment across European corporations has cratered, while inflation expectations have even surpassed levels seen after the 2022 Russia-Ukraine war.
While the ZEW Economic sentiment has plunged to -17.2, the lowest since 2022, the inflation expectations have zoomed to 79.2, the highest since June 2021.
Stagflation or a temporary shock?
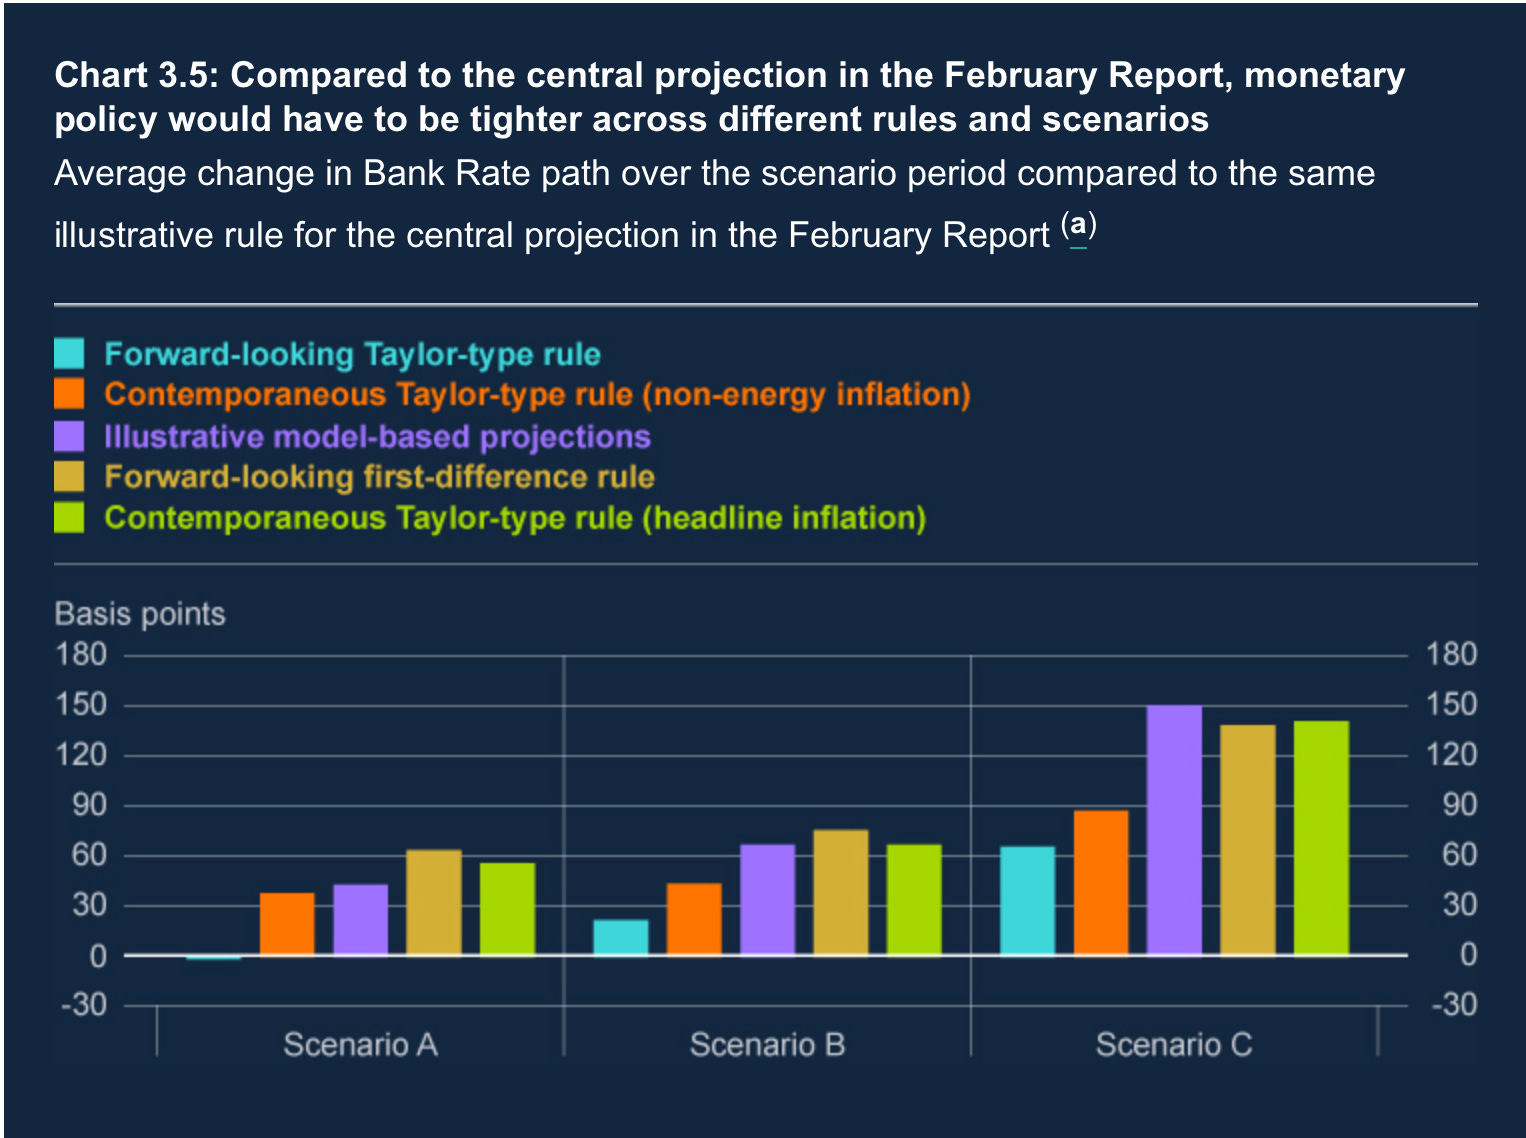
Last week, BOE stated three likely scenarios.
The first scenario entails a temporary spike in inflation with no second-order effects; the second scenario entails modest second-order effects; and the third scenario entails stronger second-round effects due to a prolonged energy shock.
The response to the three scenarios is in the chart.

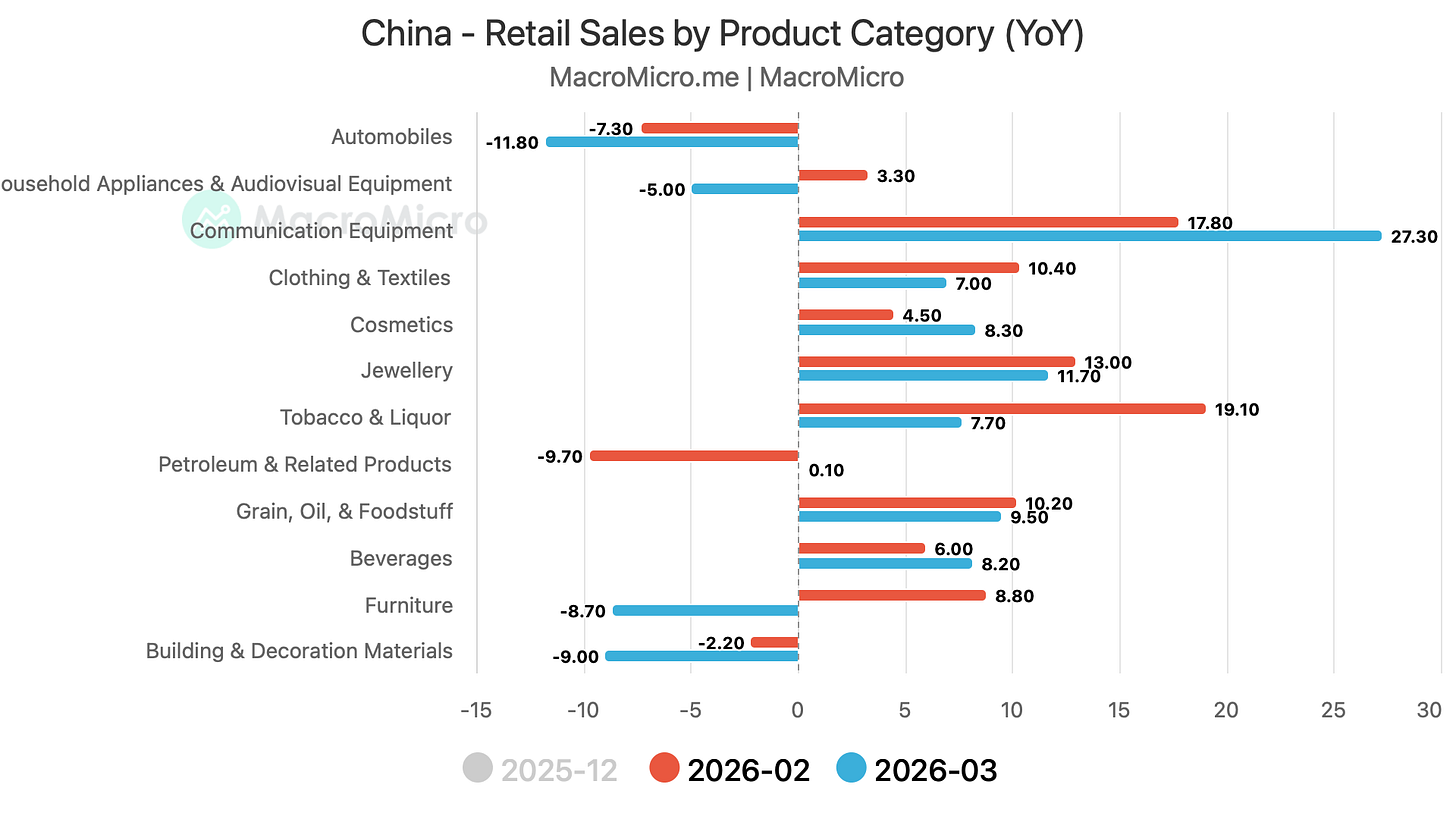
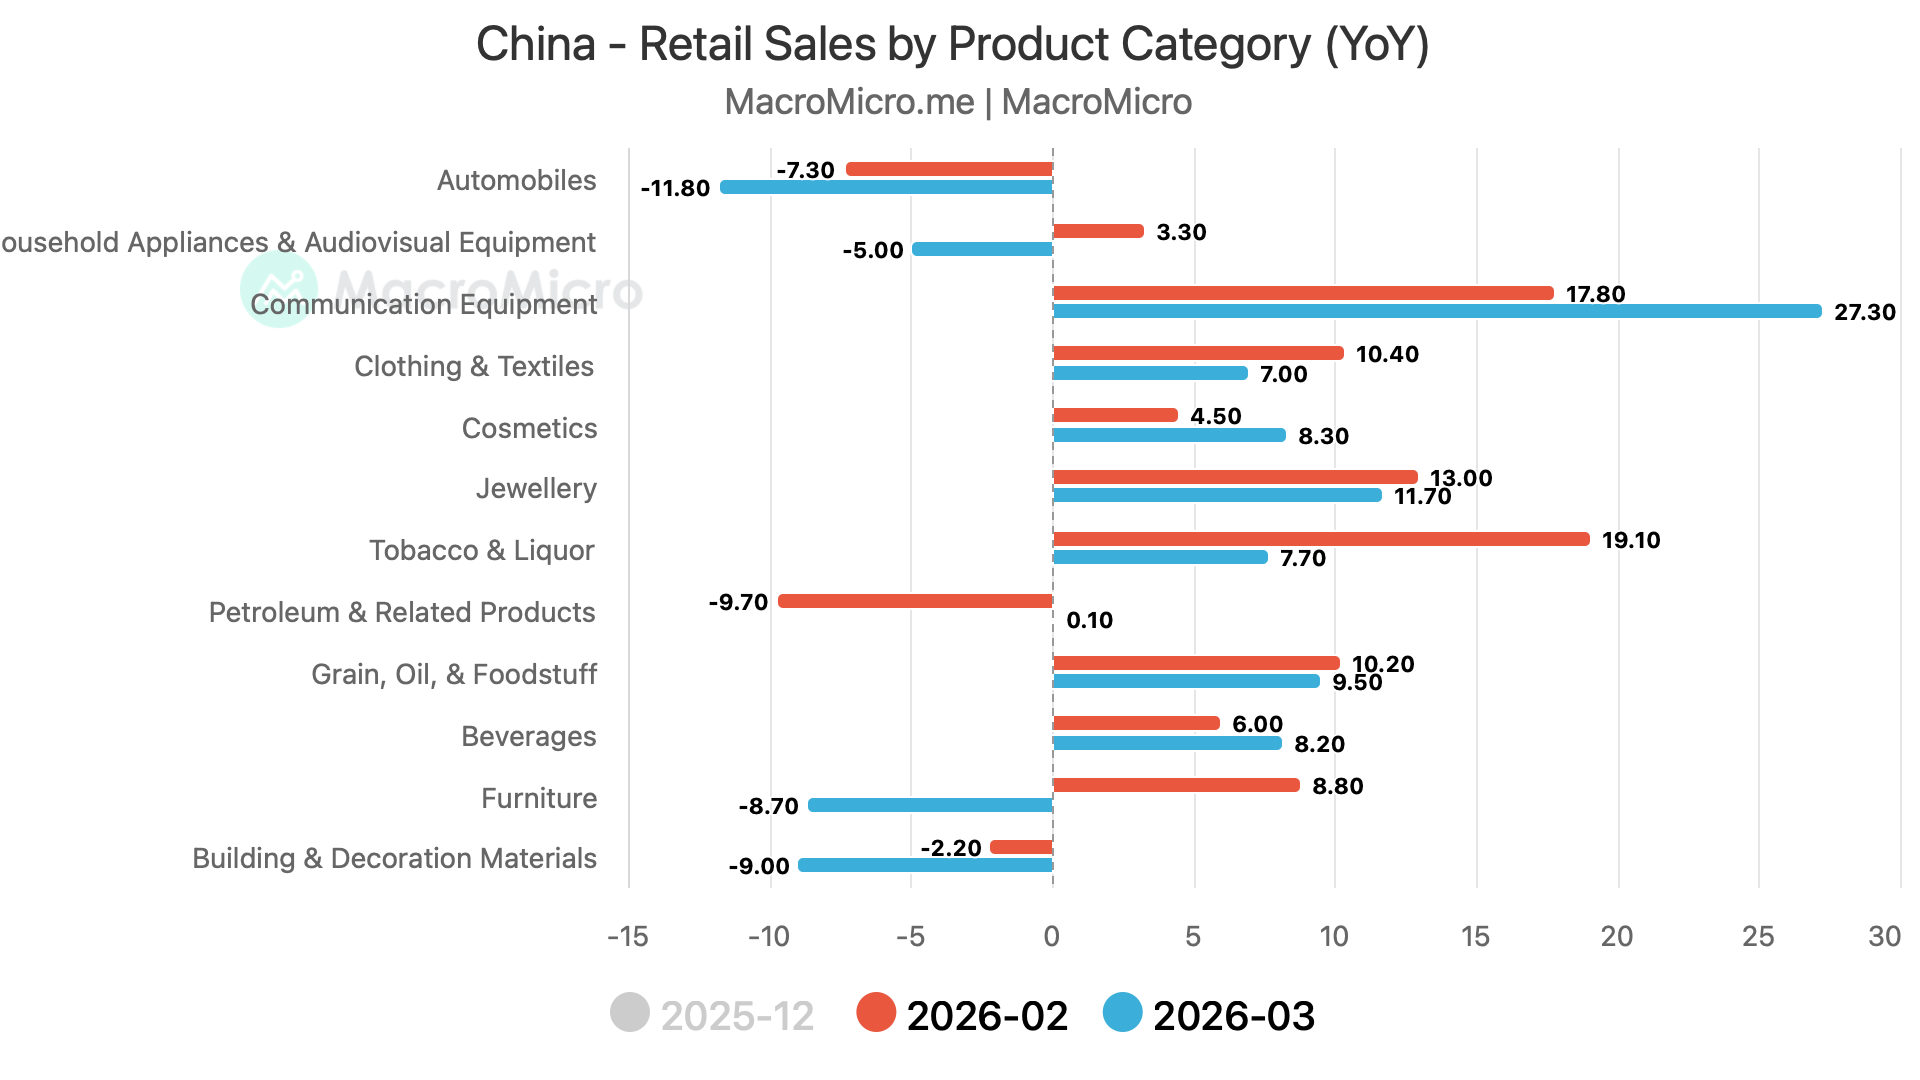
Retail sales were also tepid, growing 1.7% in March vs an expected 2.3% rise.
Auto and housing-related sales (furniture and building materials) were a drag. Note that the trend in these sectors has been down (housing recession).
On the flip side, “communication equipment” has seen a meteoric rise and has been on a significant uptrend. Good for AAPL?
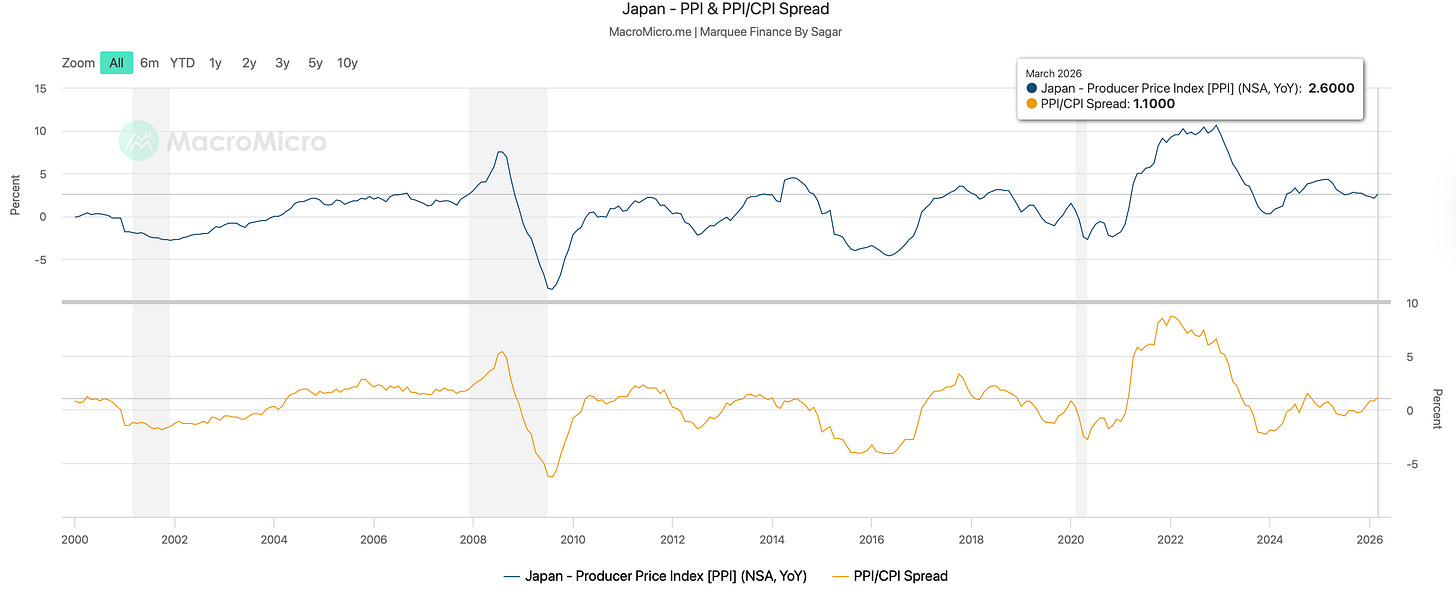
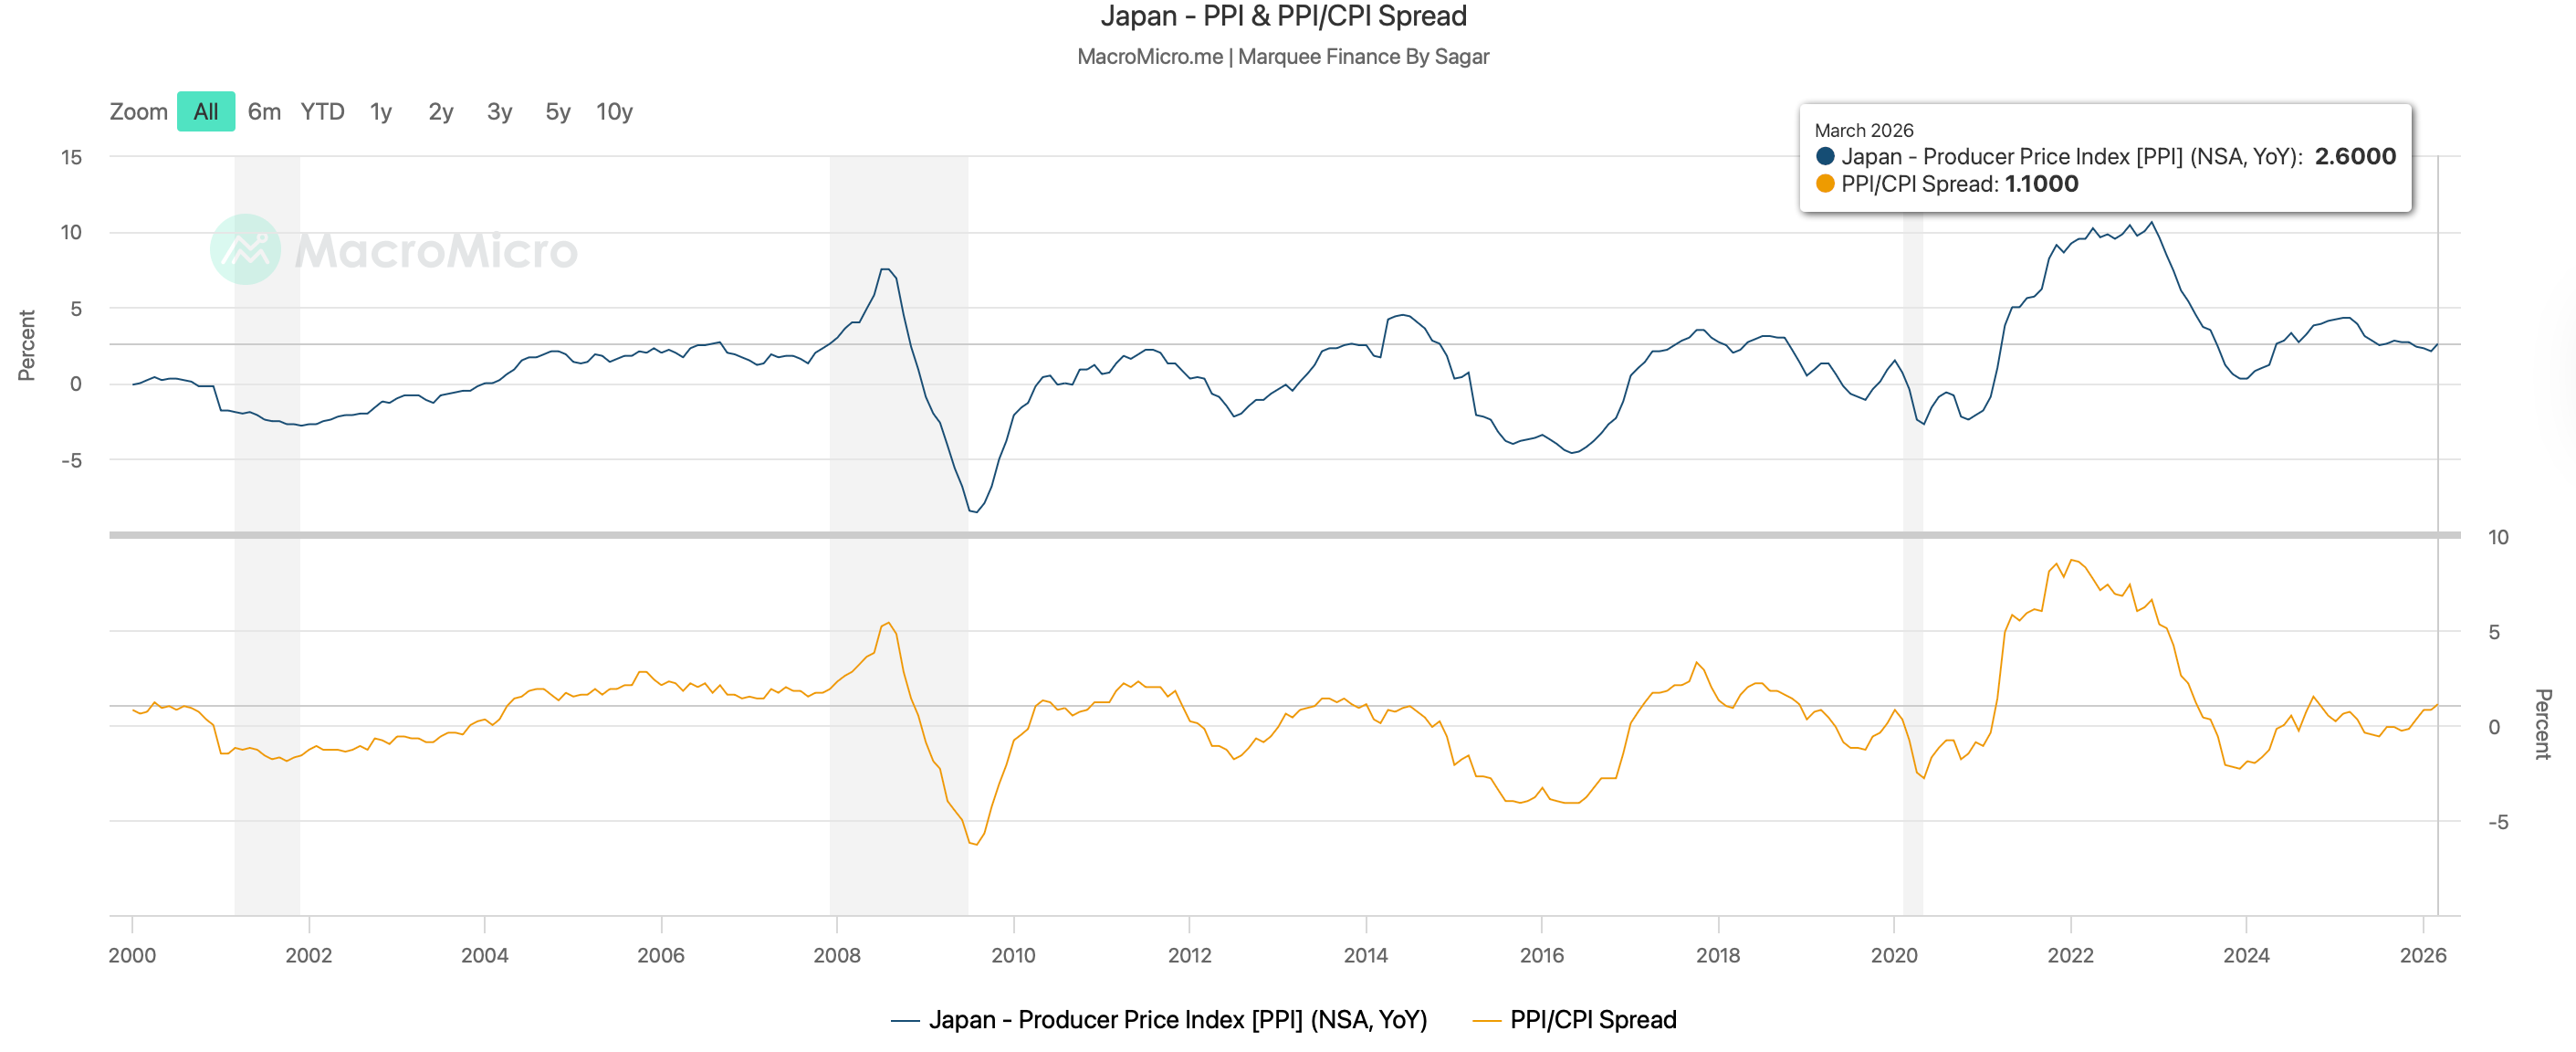
In the land of the rising sun, PPI came in higher than expected at 2.6% YoY.
We will see further upward pressure as rising energy prices drive higher input costs for firms.
As a result, we have also seen a wider PPI/CPI spread, which, in the medium term, bodes well for corporate profitability.
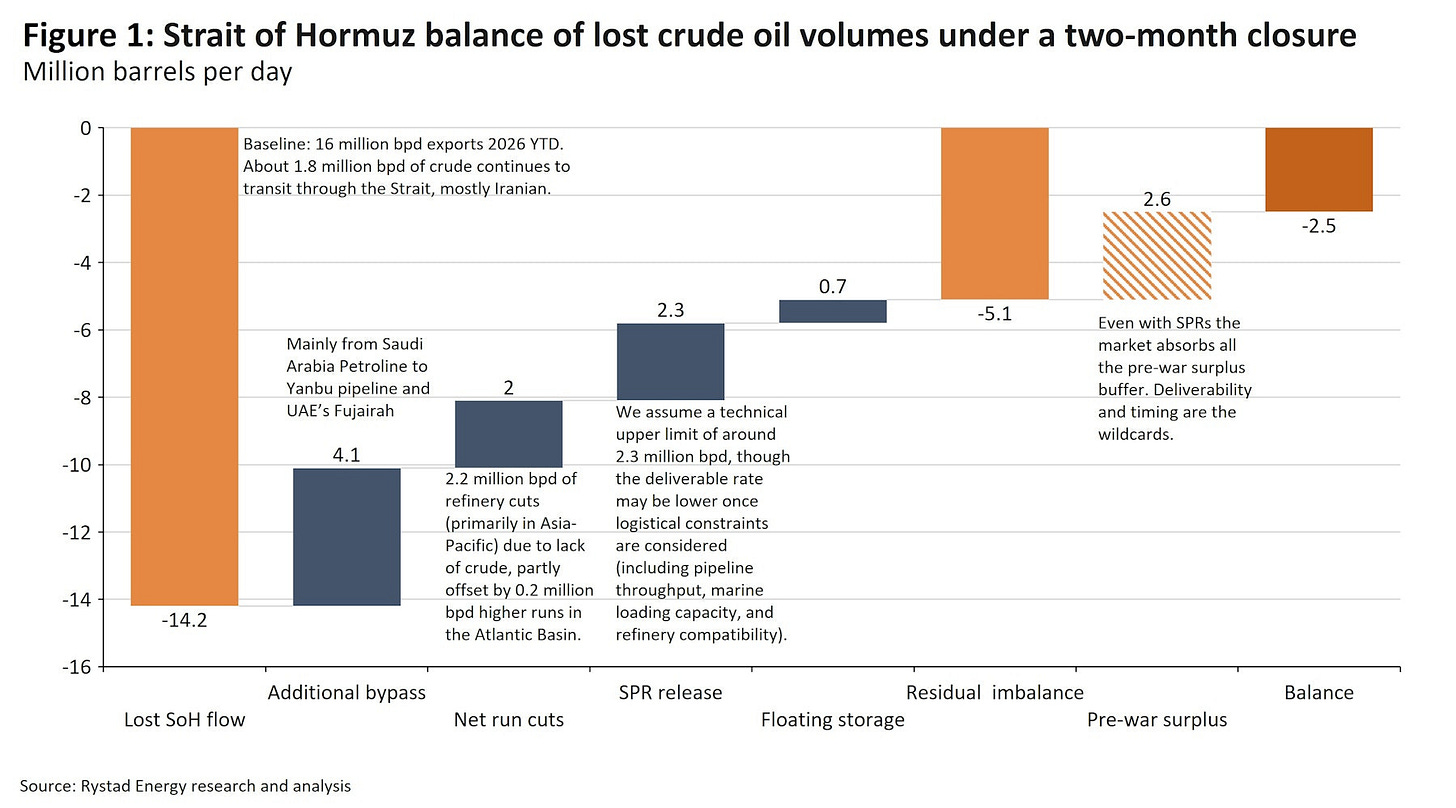
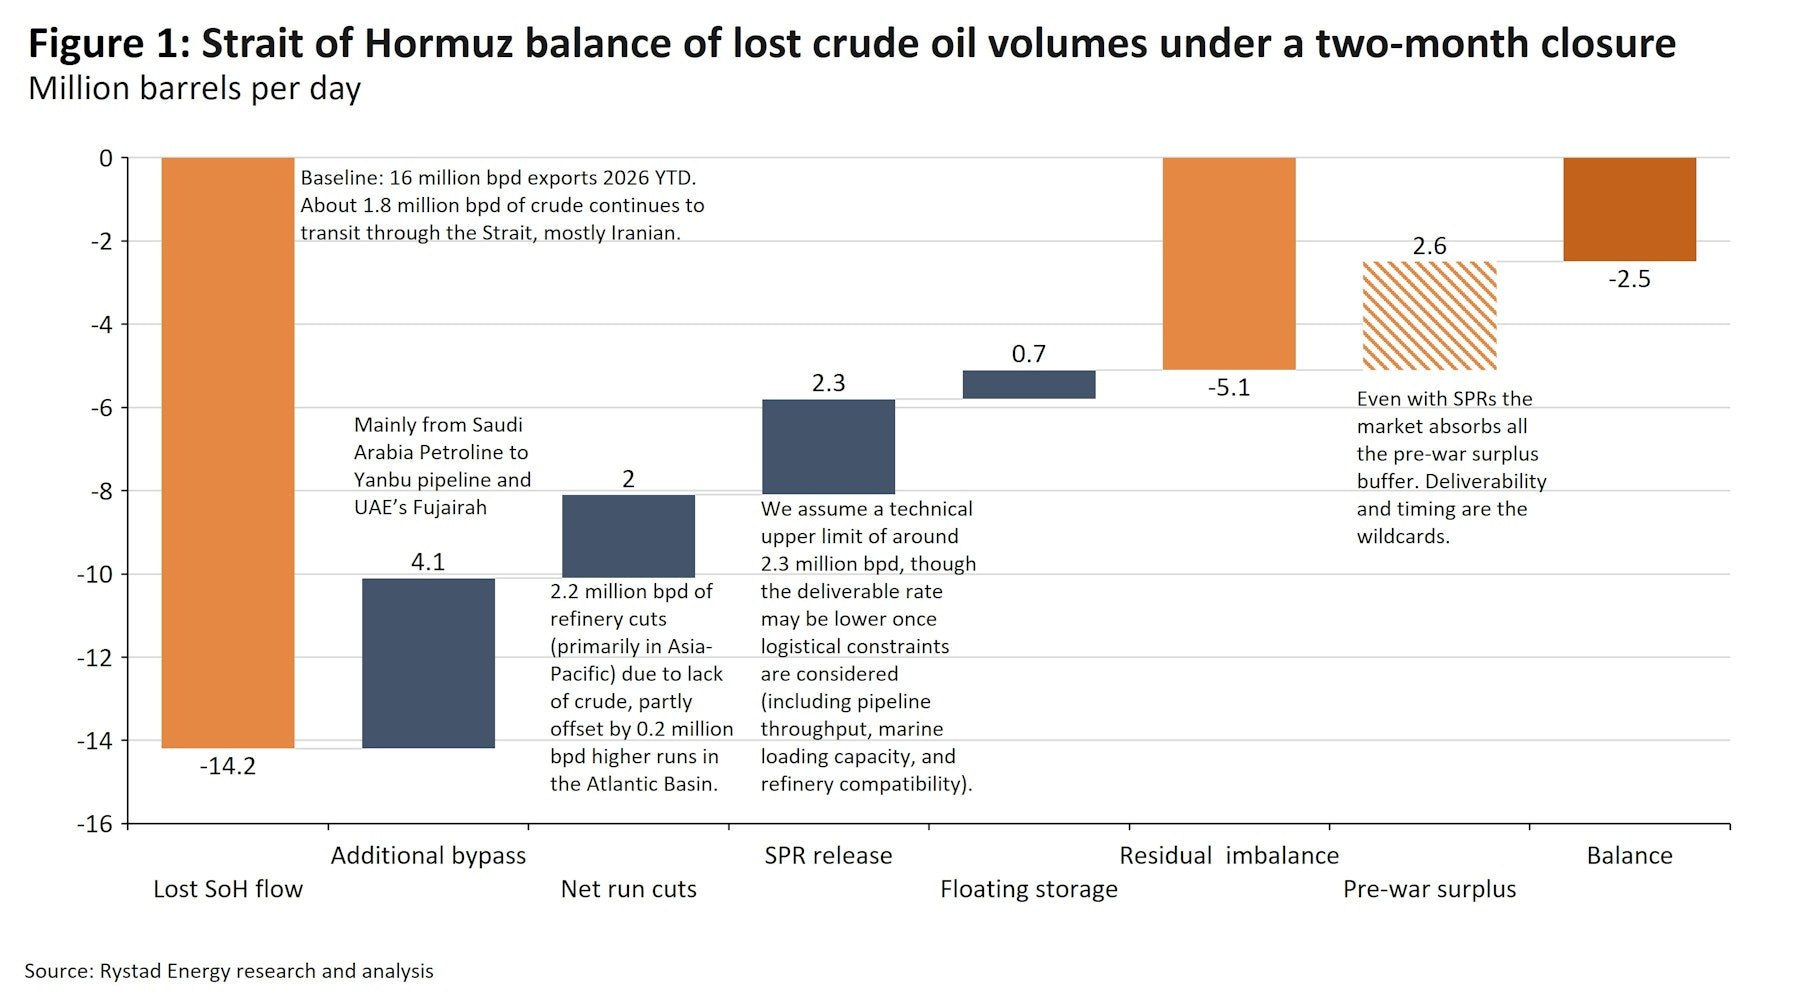
The closure of the Strait of Hormuz (SOH) has resulted in a loss of more than 14 mbpd in oil flow.
Considering the alternative routes (UAE’s Fujairah) and the Saudi Yanbu pipeline, along with SPR releases, floating storage, and refinery cuts, we have seen a deficit of 5.1 mbpd over the last two months.
The oil inventories have now depleted, and if we don’t get a resolution in the next few weeks, oil markets will enter a state of panic.
BONUS CHART: AI was supposed to kill software, but it turns out, at least with regards to software engineers, there appears to be a major revival.
The hiring trends are extremely encouraging, and we might see the opposite of what market participants have been advocating over the past few months.
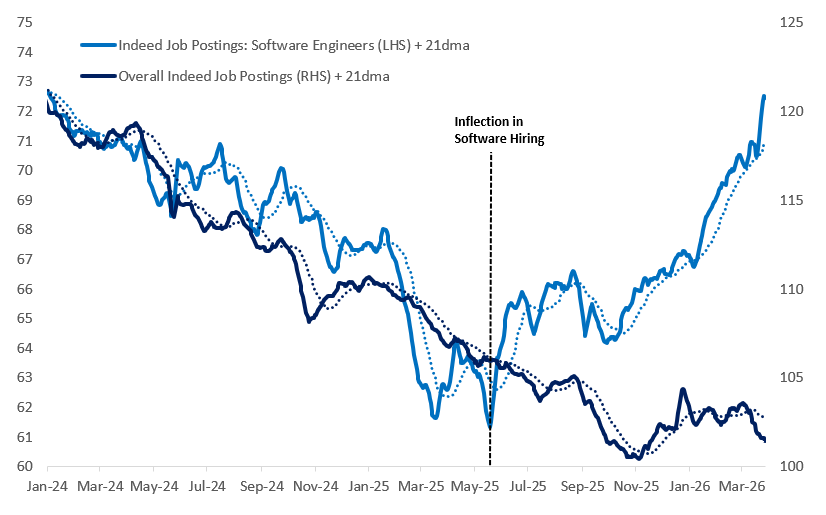
Source: Citadel Securities

Disclaimer
This publication and its author are not licensed investment professionals. The author & any other individuals associated with this newsletter are NOT registered as Securities broker-dealers or financial investment advisors with the U.S. Securities and Exchange Commission, Commodity Futures Trading Commission, or any other securities/regulatory authority. Nothing produced under Marquee Finance by Sagar should be construed as investment advice. Do your research and consult with your certified financial planner or other dedicated professional before making any investment decisions. Investments carry risk and may lose value; Marquee Finance By Sagar LLC, Marqueefinancebysagar.substack.com or Sagar Singh Setia is not responsible for loss of value; all investment decisions you make are yours alone