

After a hiatus of three months, we are back with a brand new edition of “Month In Charts”.
2026 has been one of the toughest years for investors and traders, as global financial markets have tested patience, long-term correlations have broken down, and governments have intervened in financial markets to protect hegemony.
In the past few months, we have seen a relentless rise in Credit Default Swaps (CDS) for hyperscaler and chip companies.
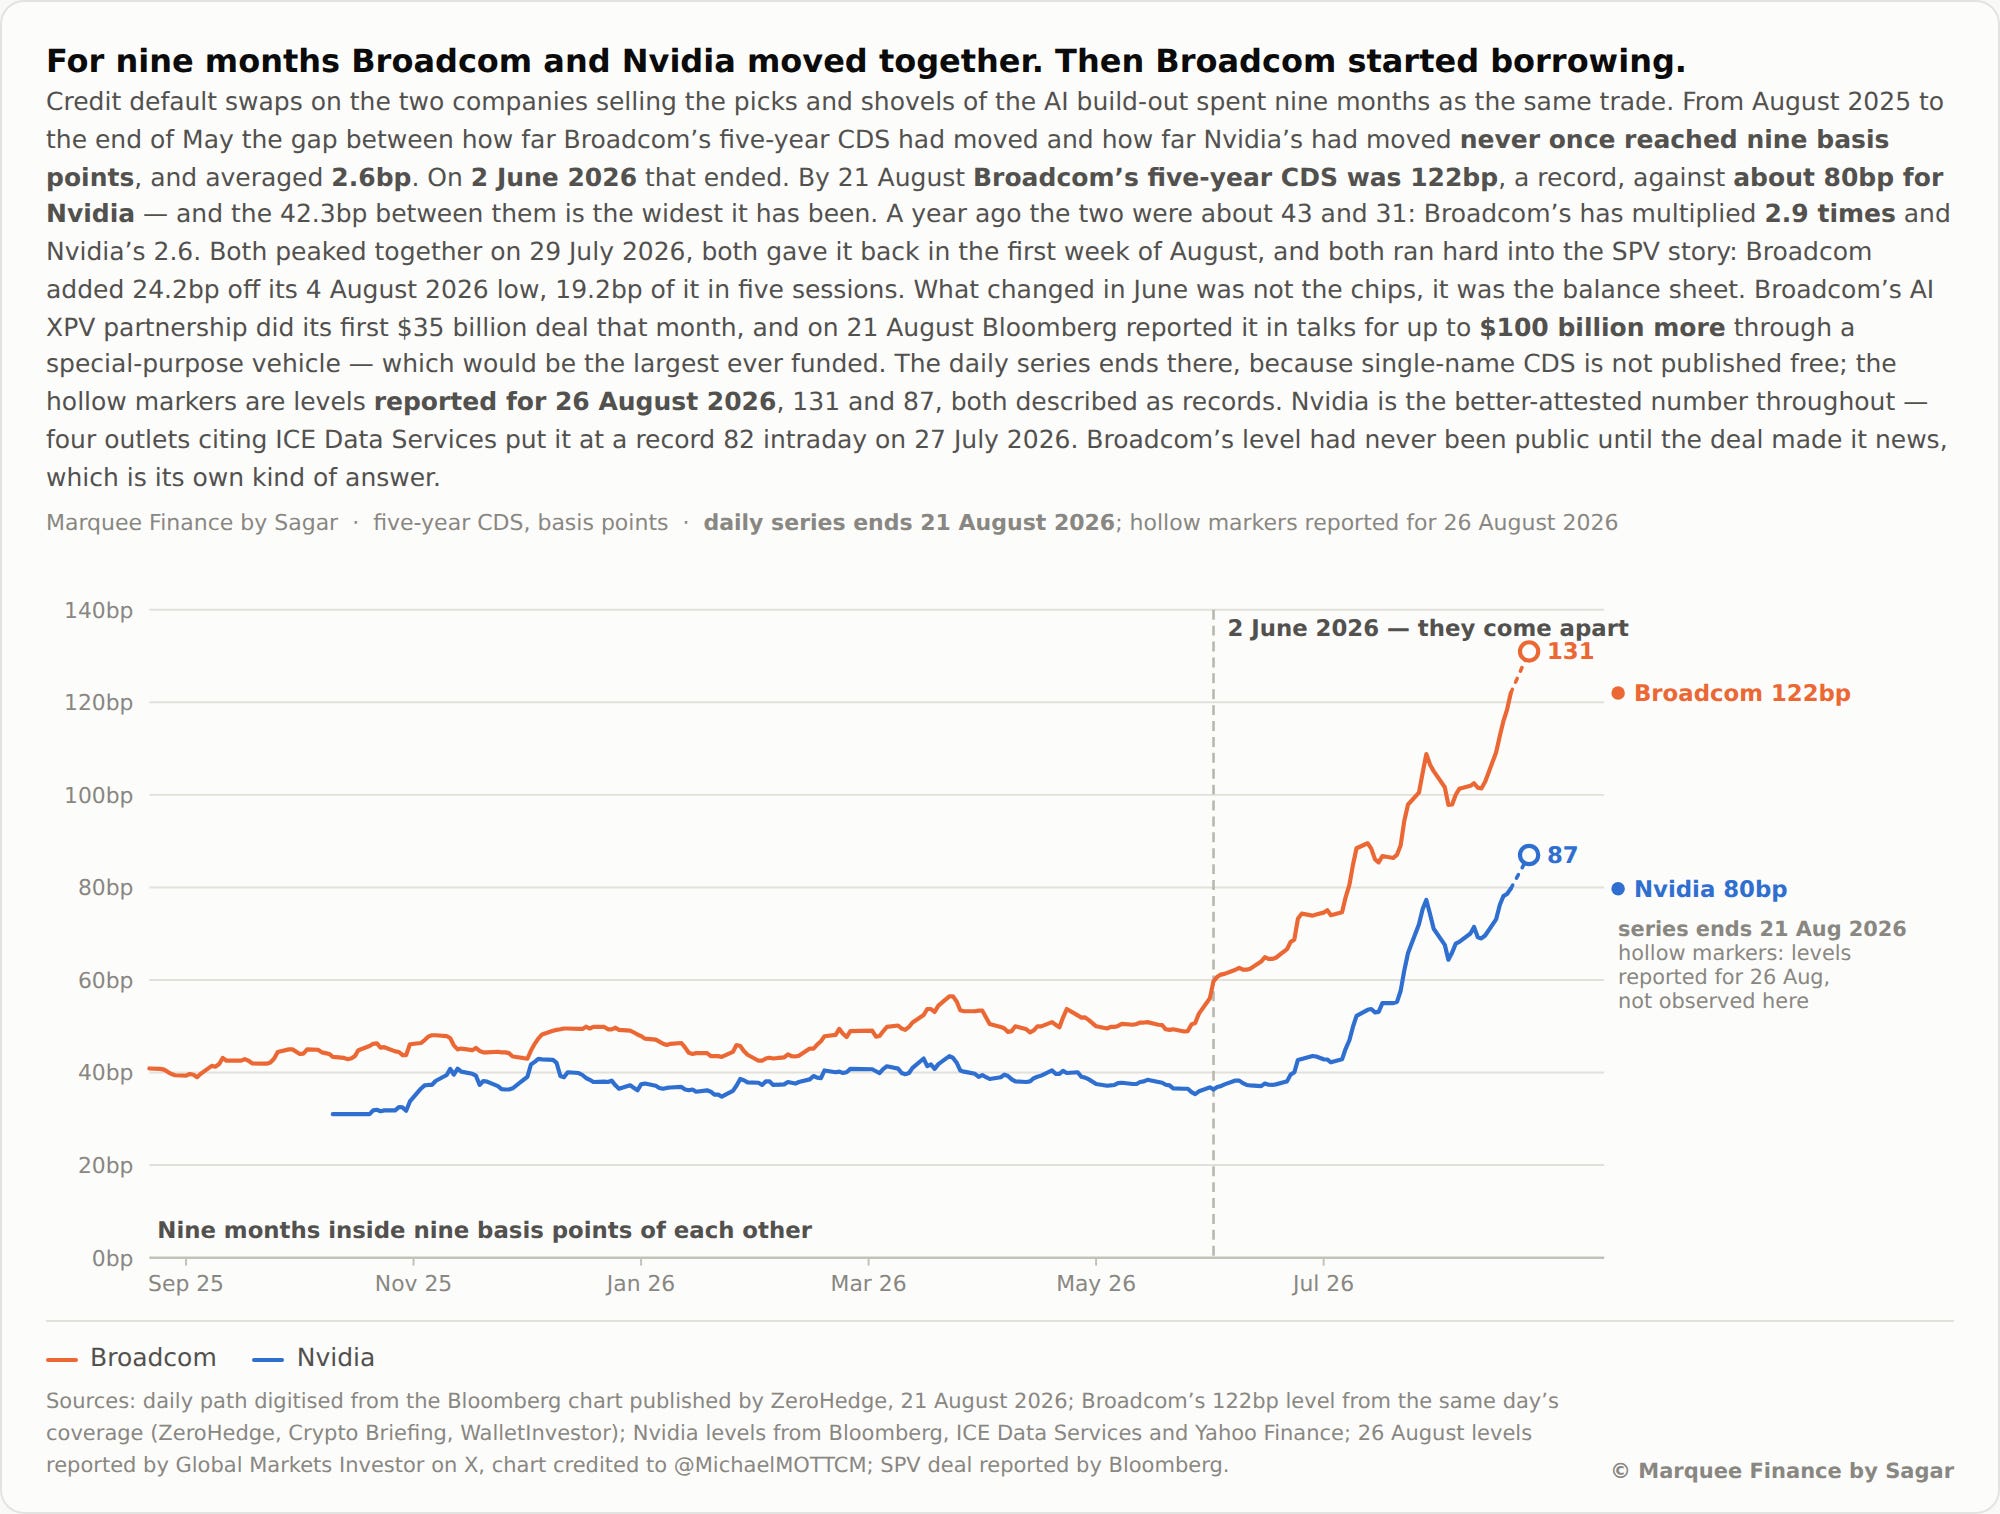
Undoubtedly, markets are worried by the circular financing of the whole AI ecosystem.
Let’s examine 14 charts to analyse the global macro and internals of financial markets!
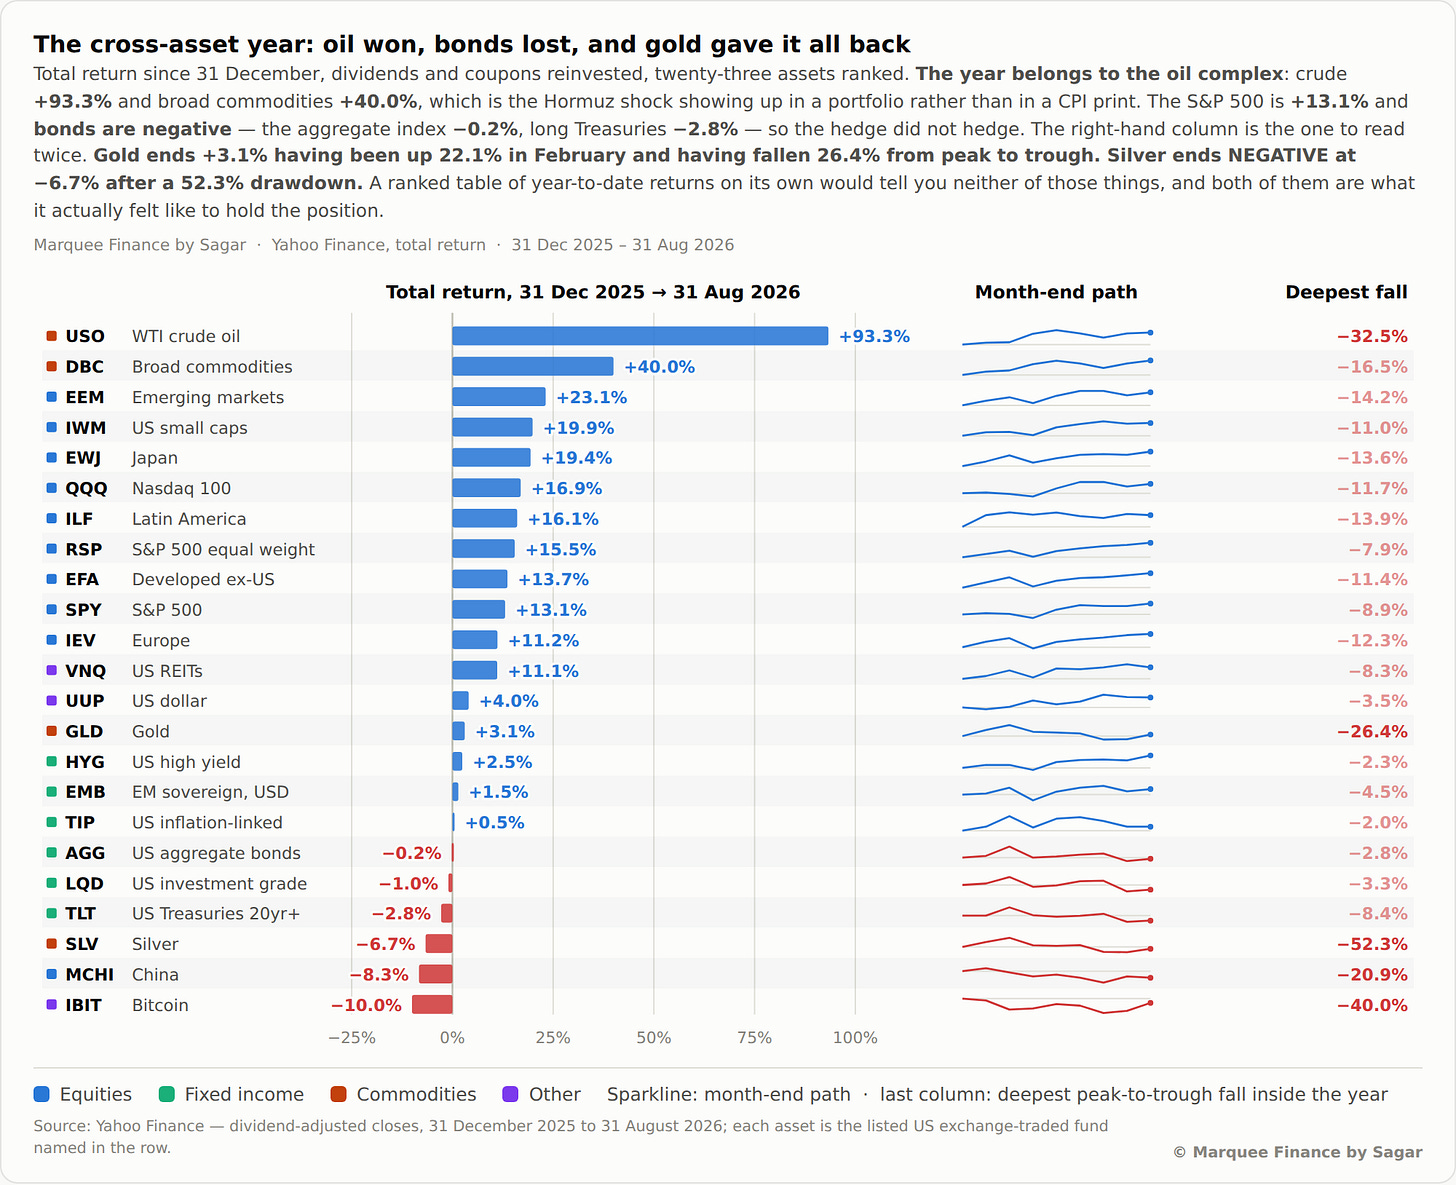
Led by a nearly 93.3% rise in crude oil prices YTD, DBC is the top-performing ETF this year with a return of 40%.
Led by semiconductor stocks, the emerging market ETF (EEM) was the top-performing equity ETF.
Gold lost its sheen after a stellar rally in January and is up less than 3%, as sentiment turned bearish due to crowded positioning.
Thanks to semis, NDX has outperformed both SPX and the equal-weight index. Despite no AI story, Latam is up 16% YTD thanks to the commodity rally. The MSCI European ETF IEV is up 11.12%
China and long-term bonds have been the stark underperformers.
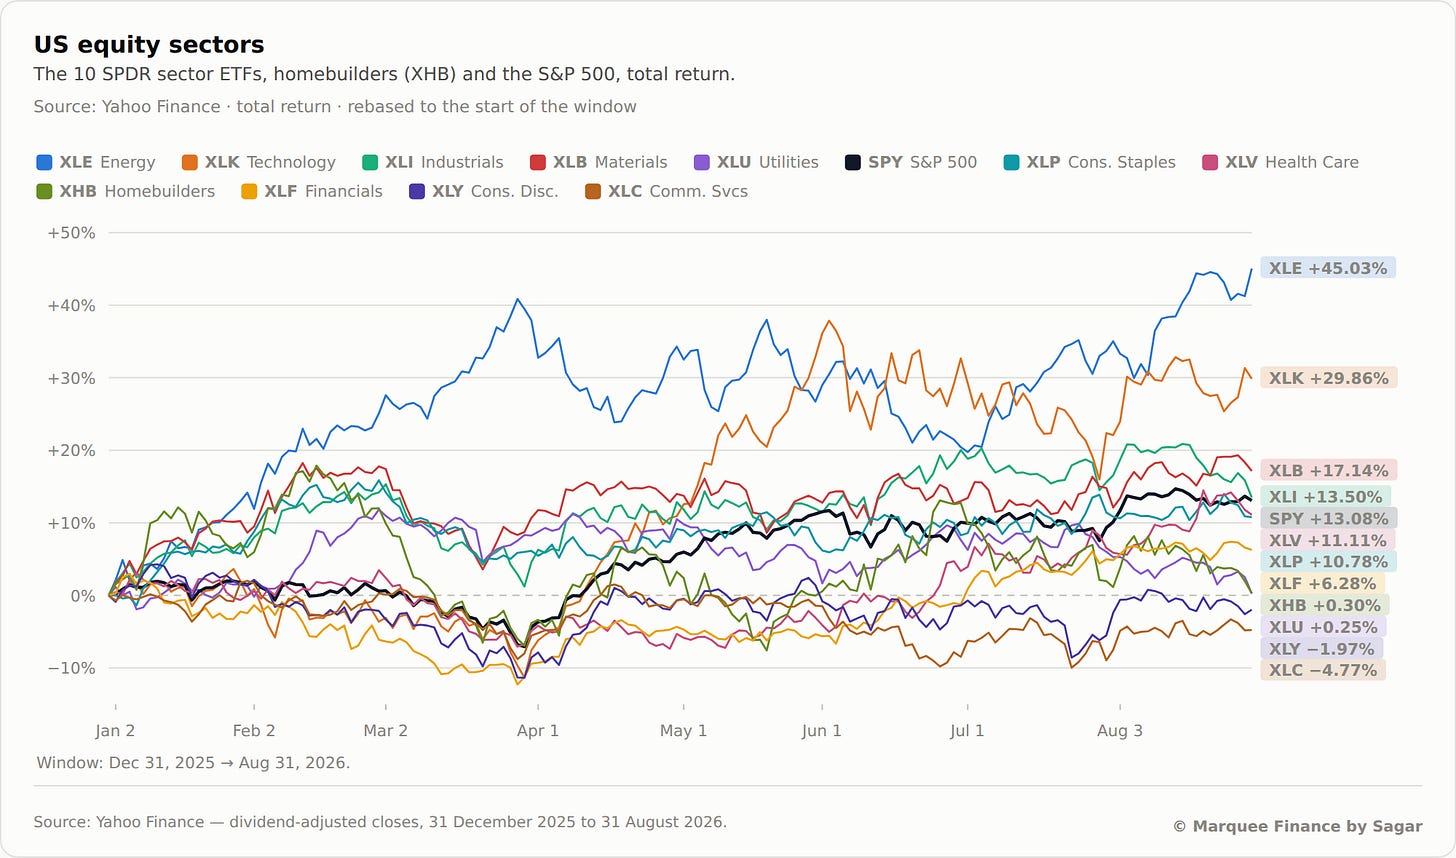
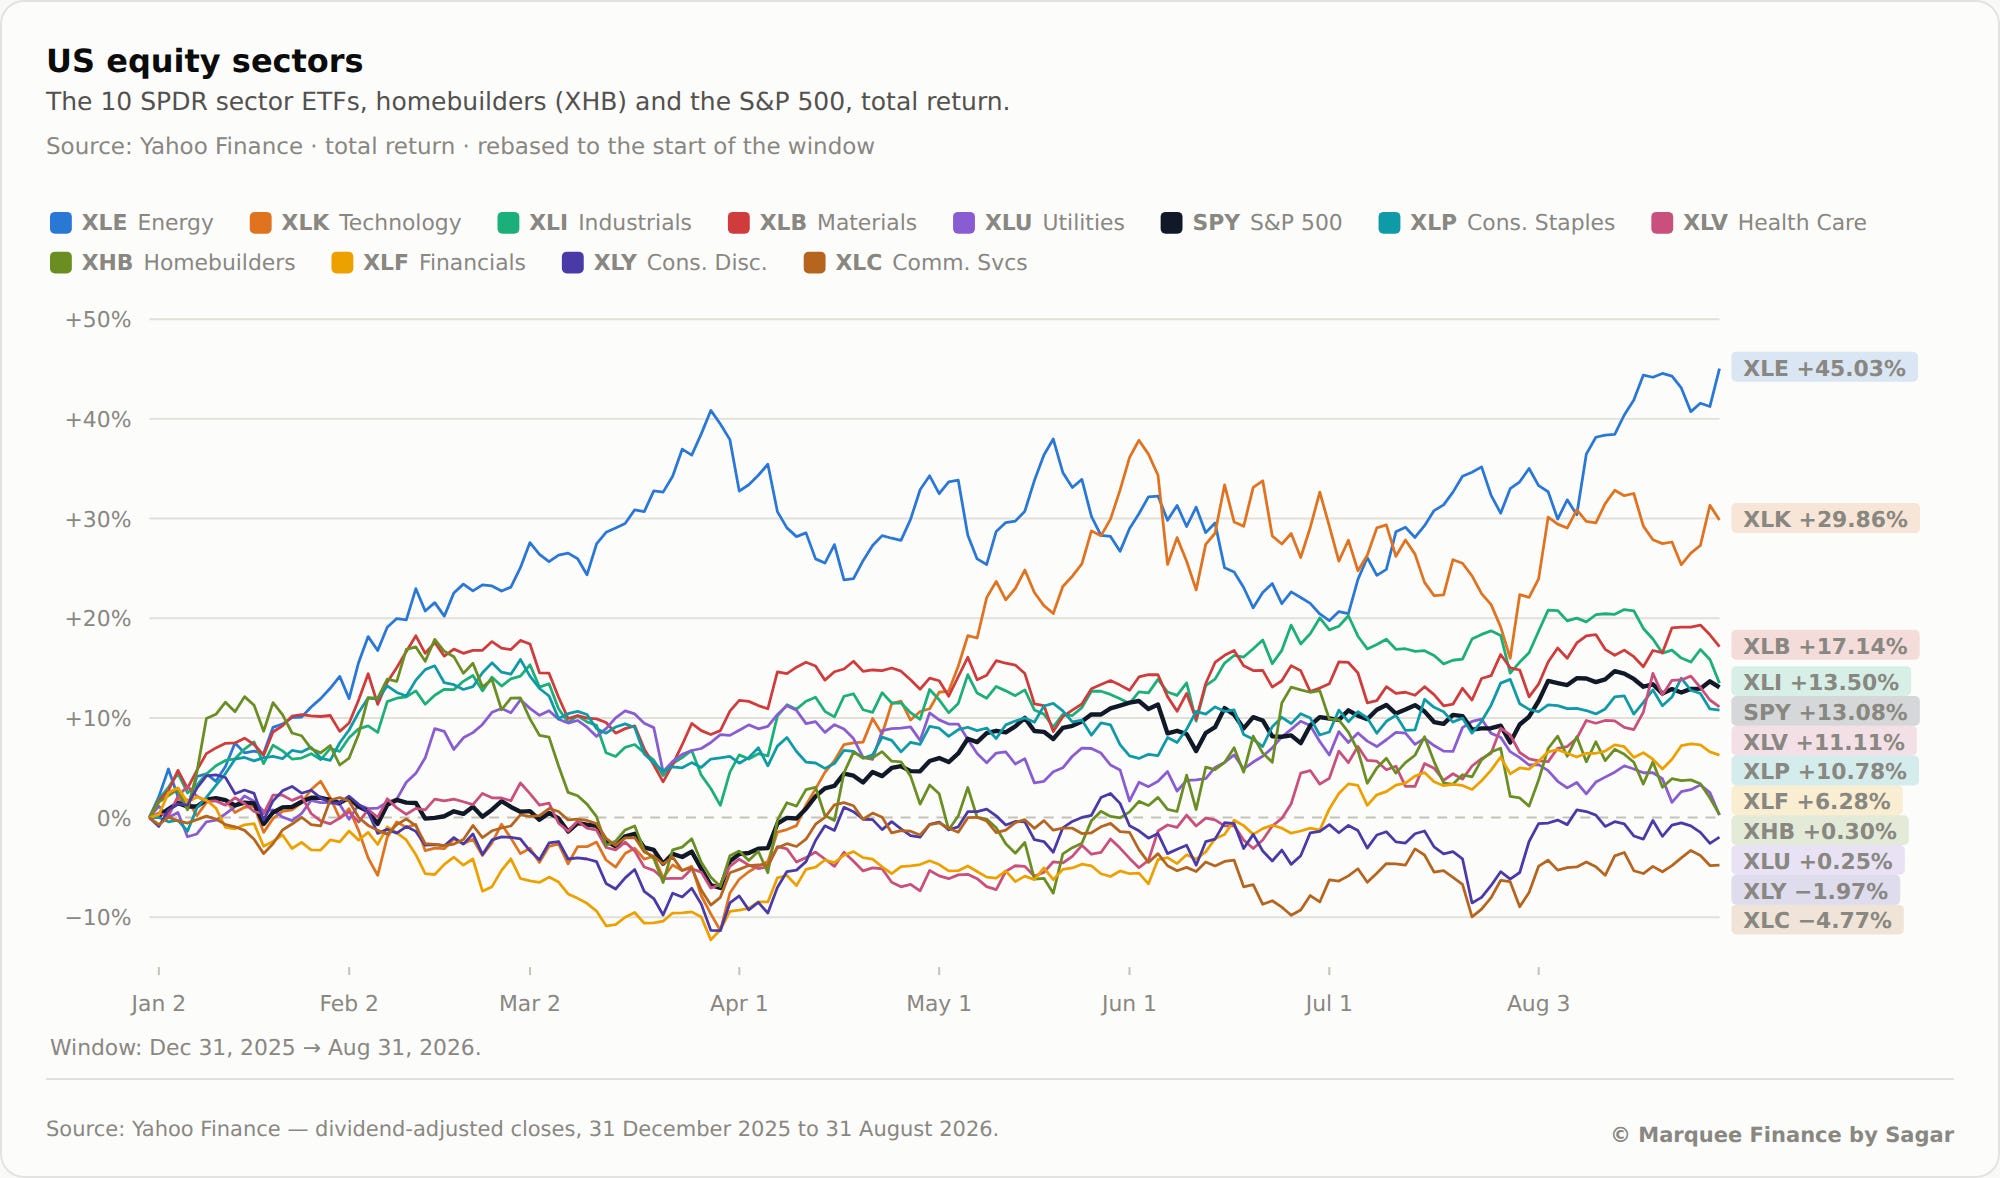
No prize for guessing, as XLE remains the biggest gainer YTD thanks to an explosion in refining margins and product prices. Furthermore, crude continues to hover around $90.
XLK has been the second-best performer, thanks to massive gains in Semis.
The laggards have been XLC and XLY along with XLU.
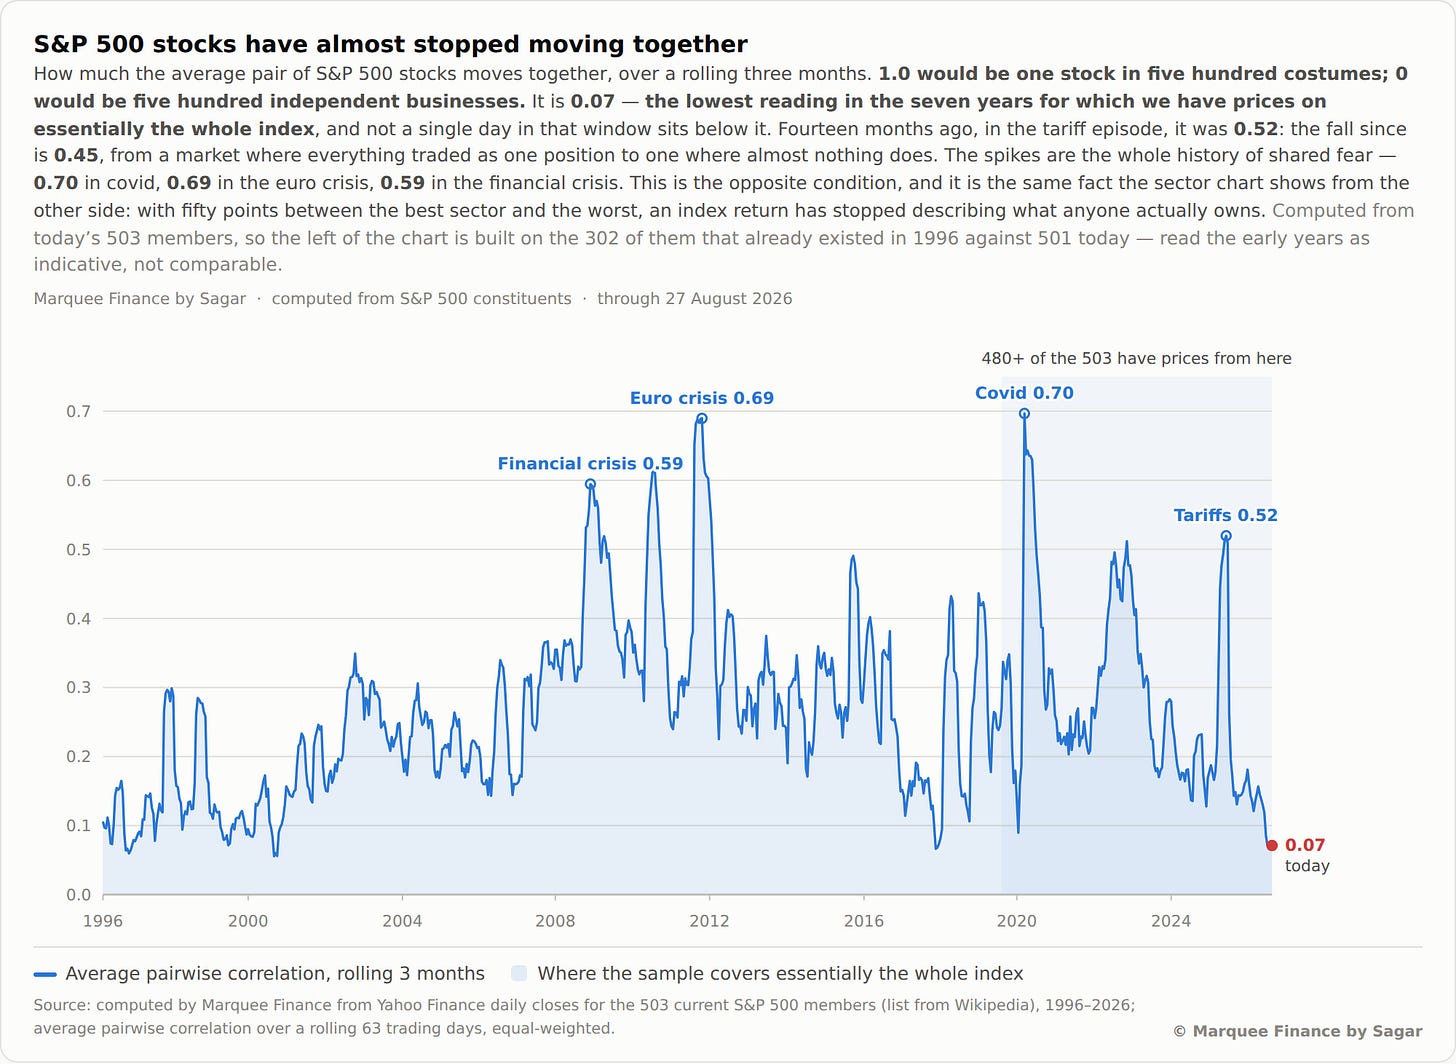
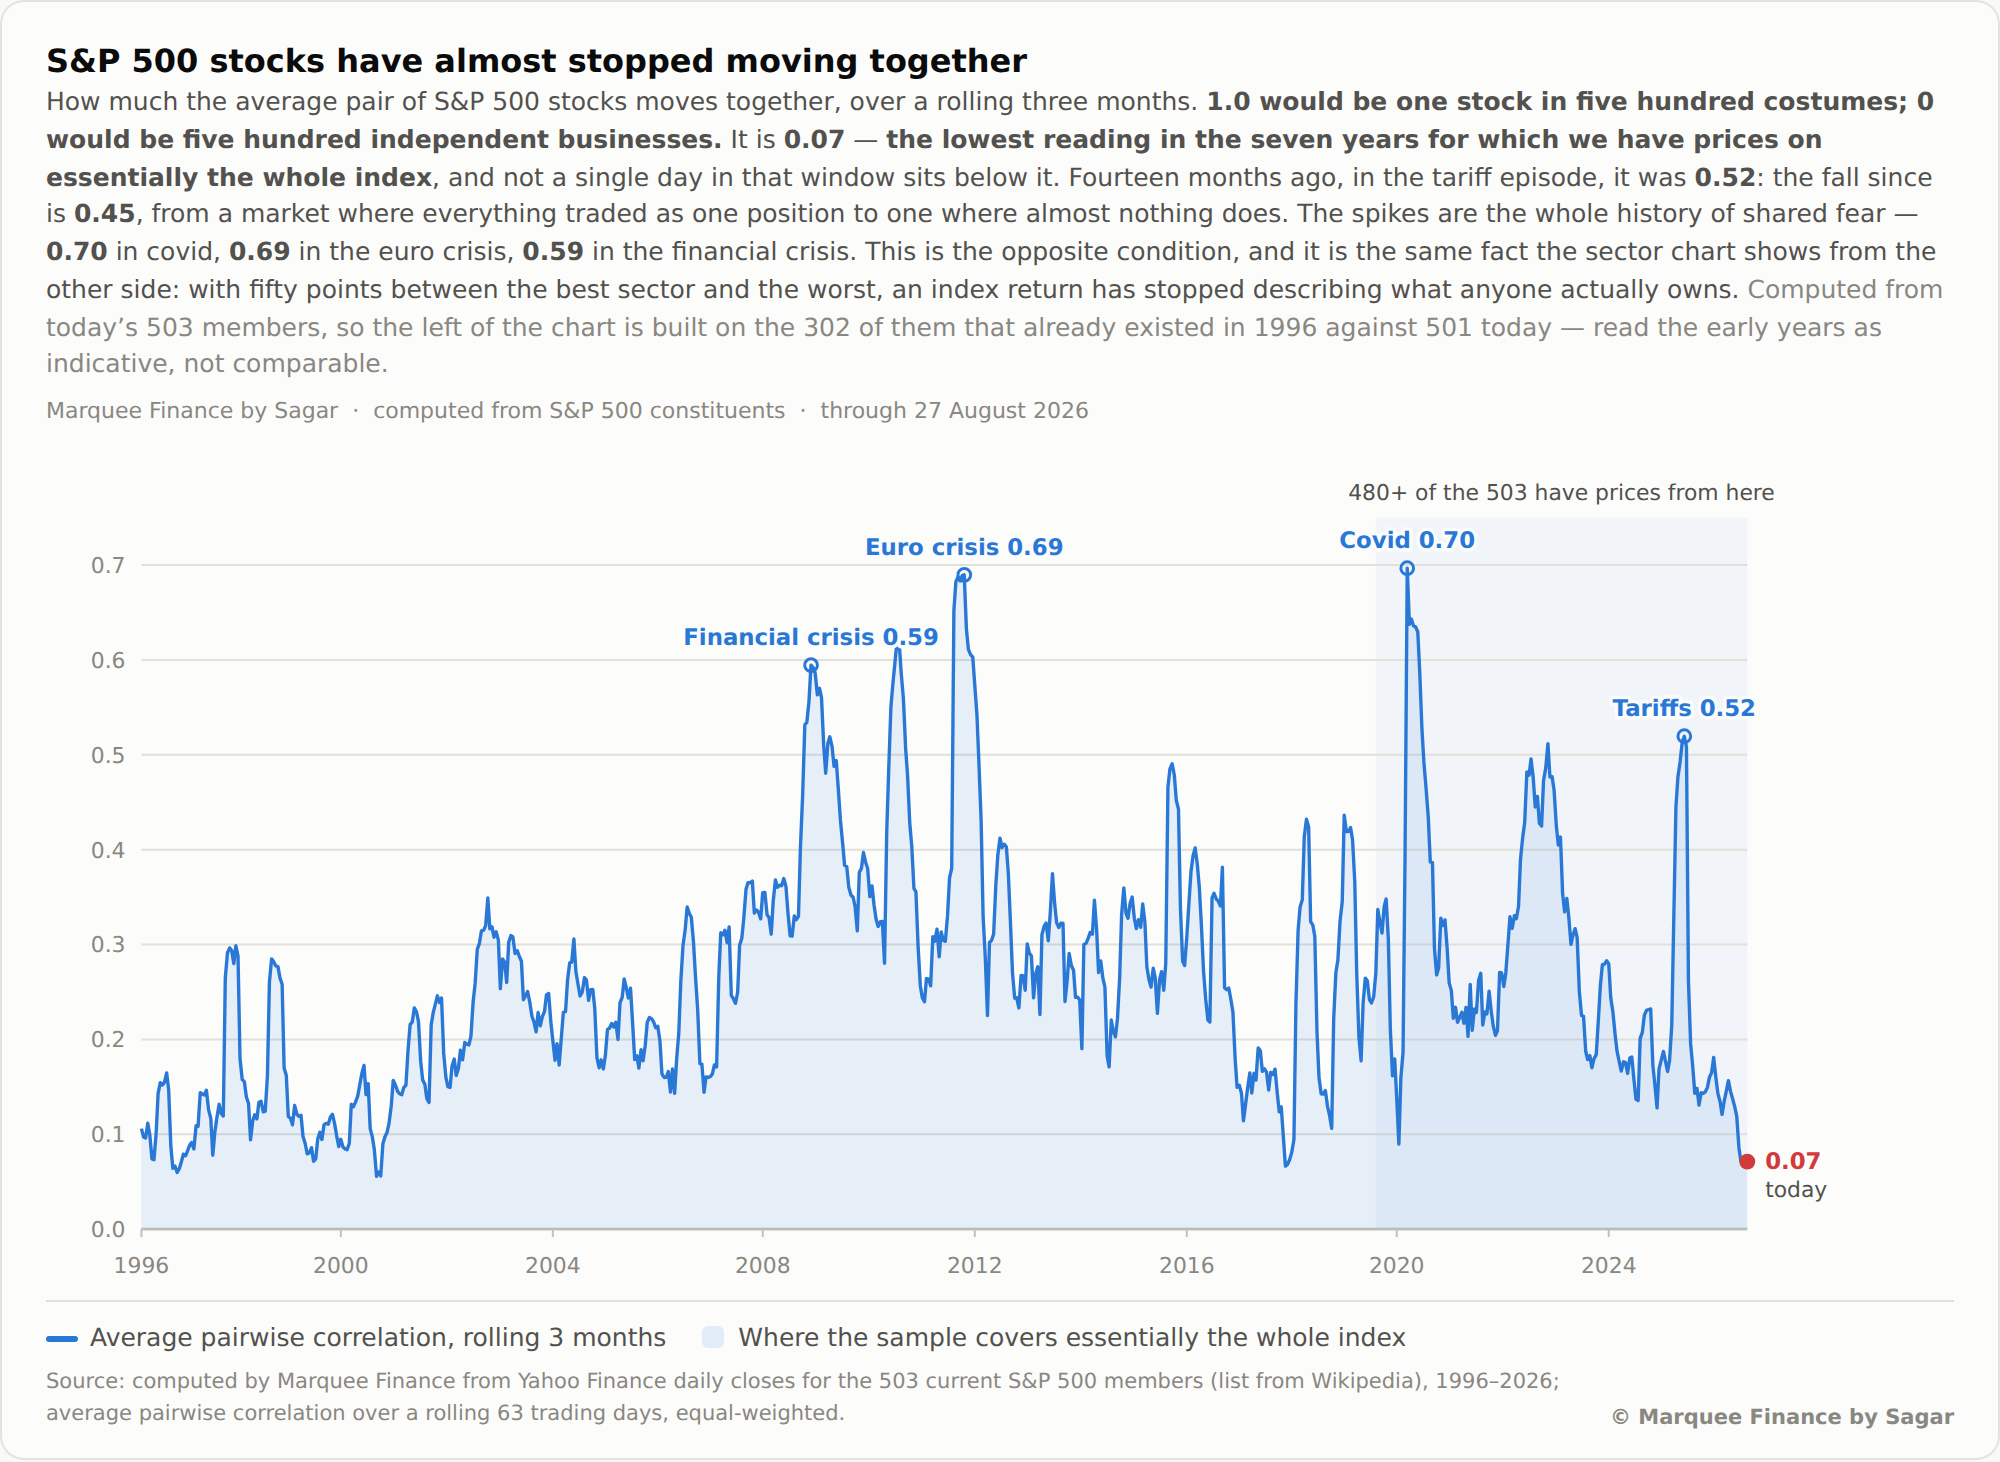
You are not alone if you have been wondering about the “weird” market moves.
The average pairwise correlation among stocks (rolling 3 months) has crashed to the lowest since 2000 (only lower for a brief period in 2017).
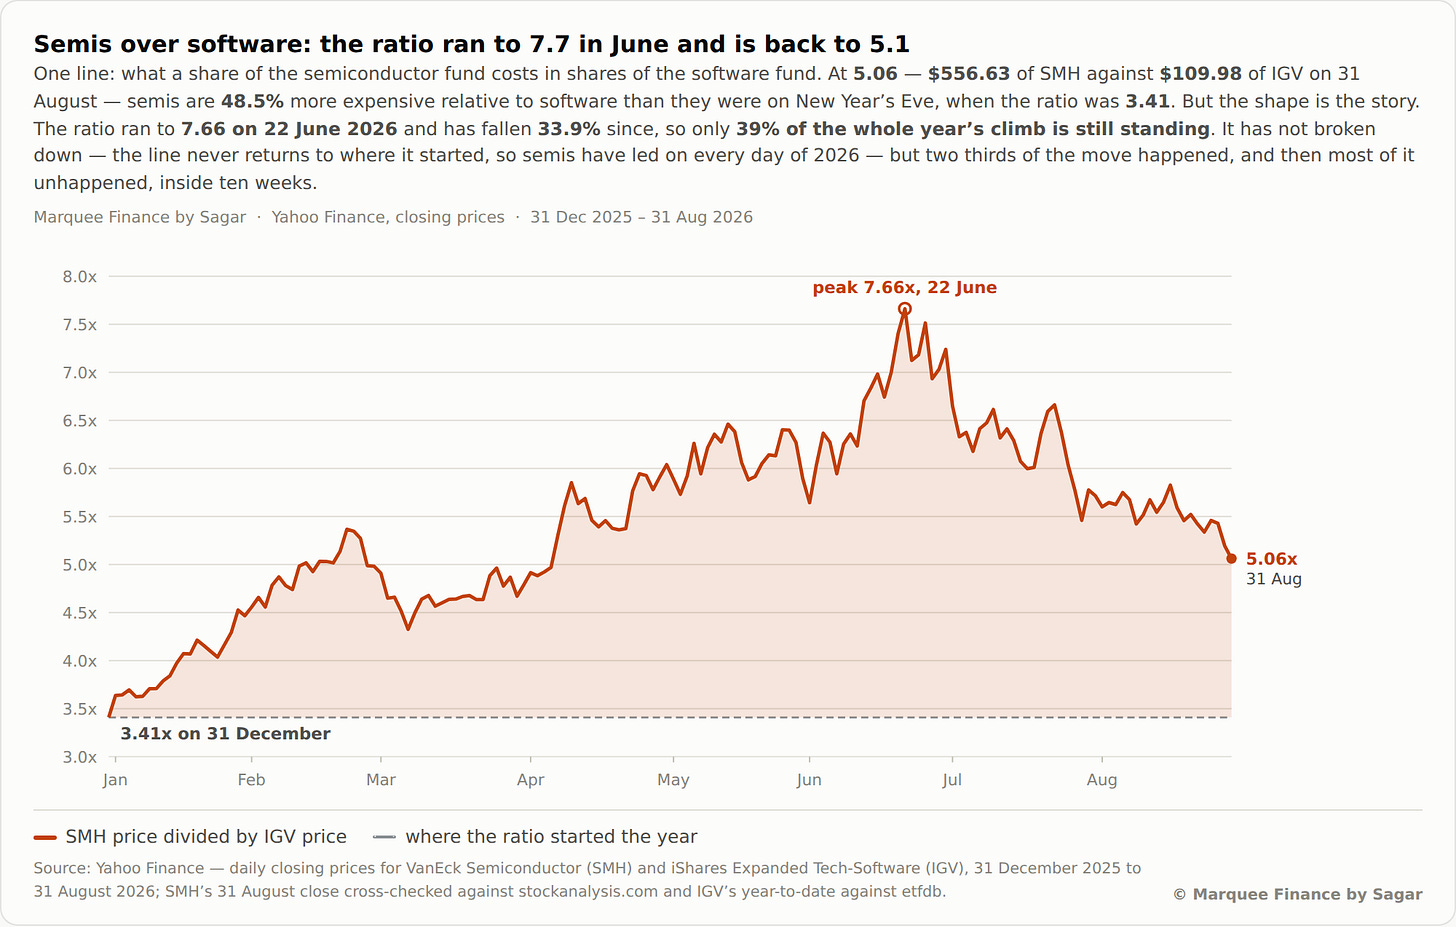
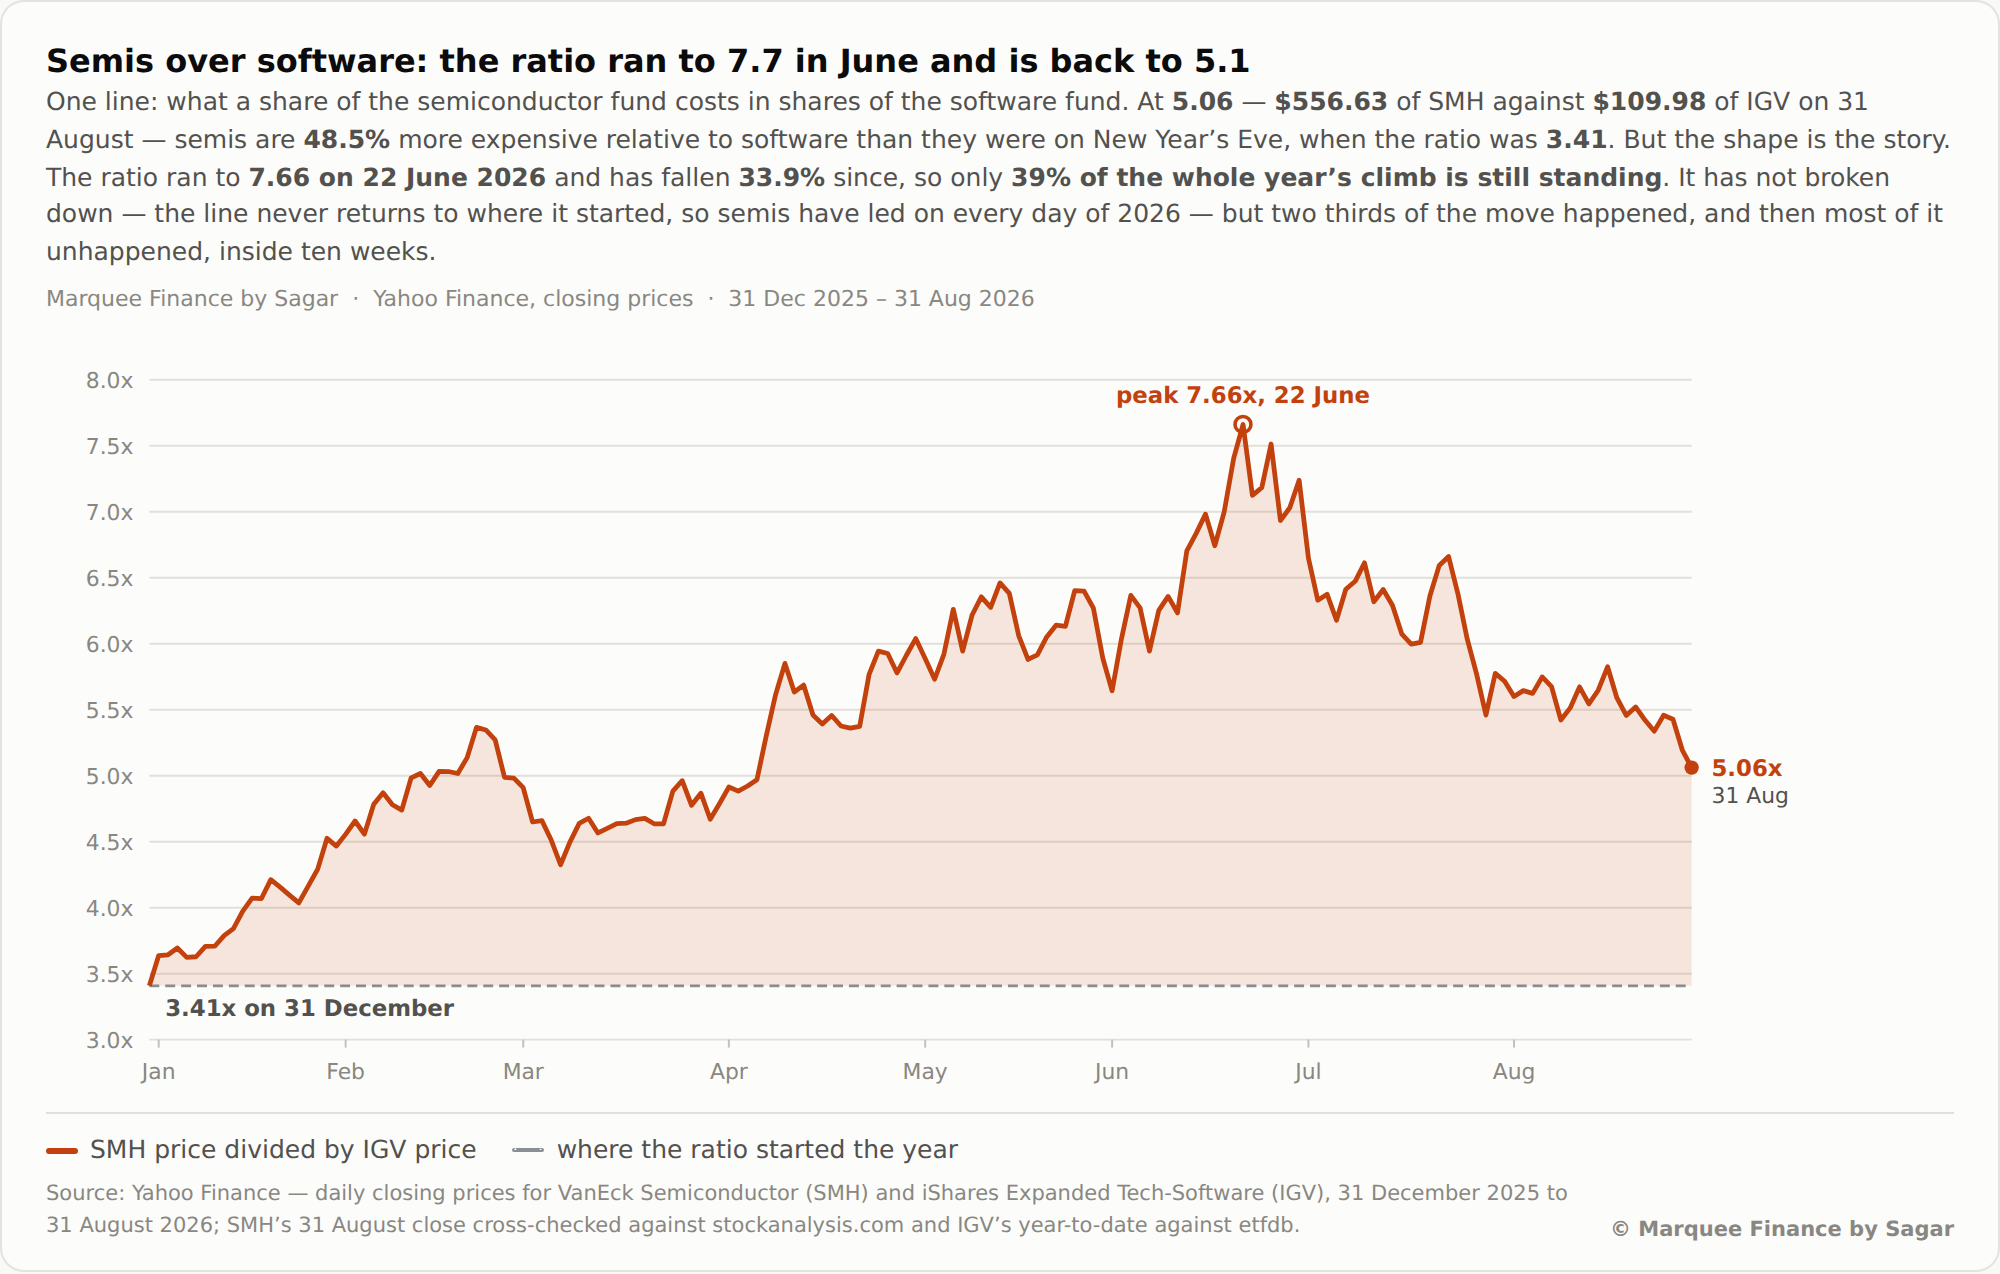
The predominant narrative at the beginning of the year, post the tsunami of agentic AI, was that software is dead, and the gold rush is only in the Semis.
While SMH is down 20% from the peak (still up 50% YTD), the relative performance of IGV (software) has caught the semis bulls by surprise.
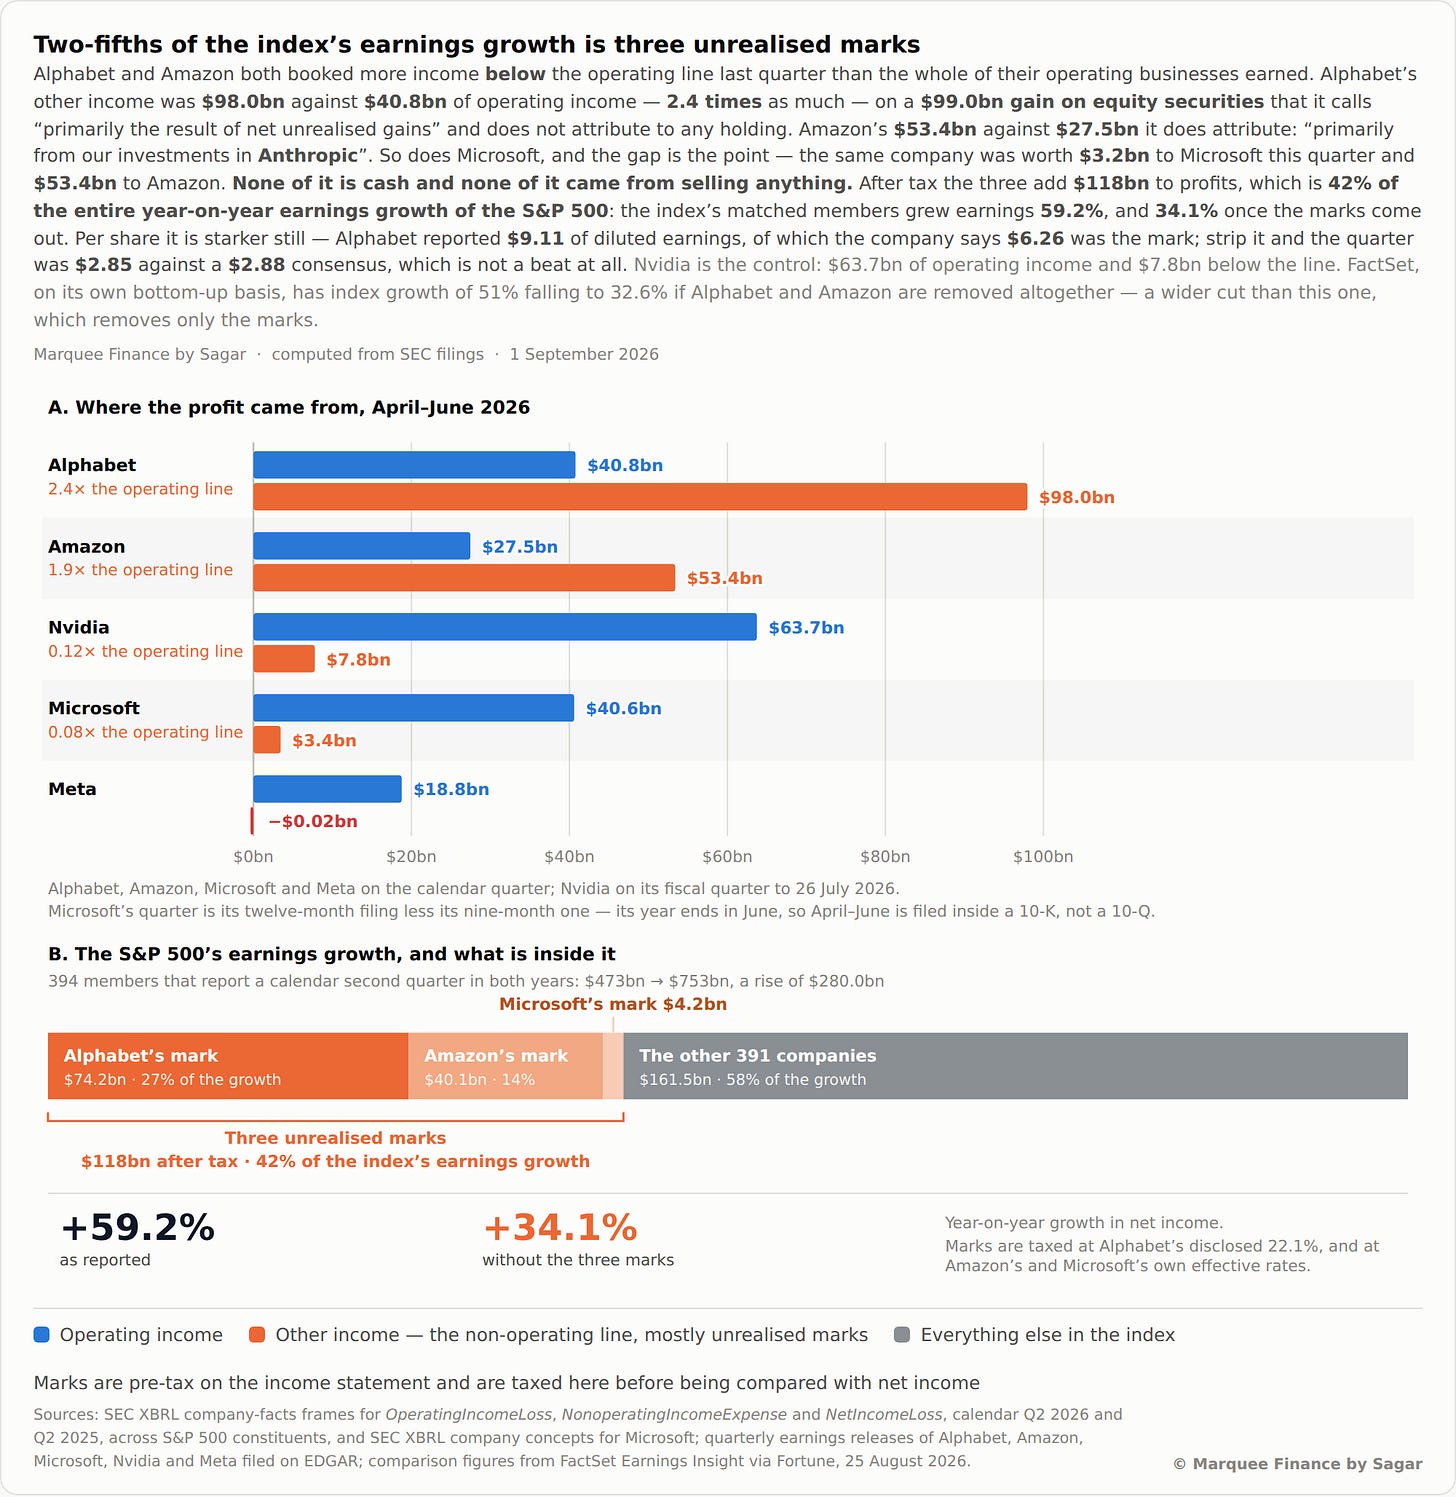
Digging deeper into the equity markets, an alarming trend emerged in the recently concluded earnings season.
The “unrealised gains” in Anthropic, SpaceX, and other private companies accounted for 42% of the S&P 500's YoY earnings growth.
Furthermore, bloated semi margins have driven all-time-high operating margins for the S&P 500.
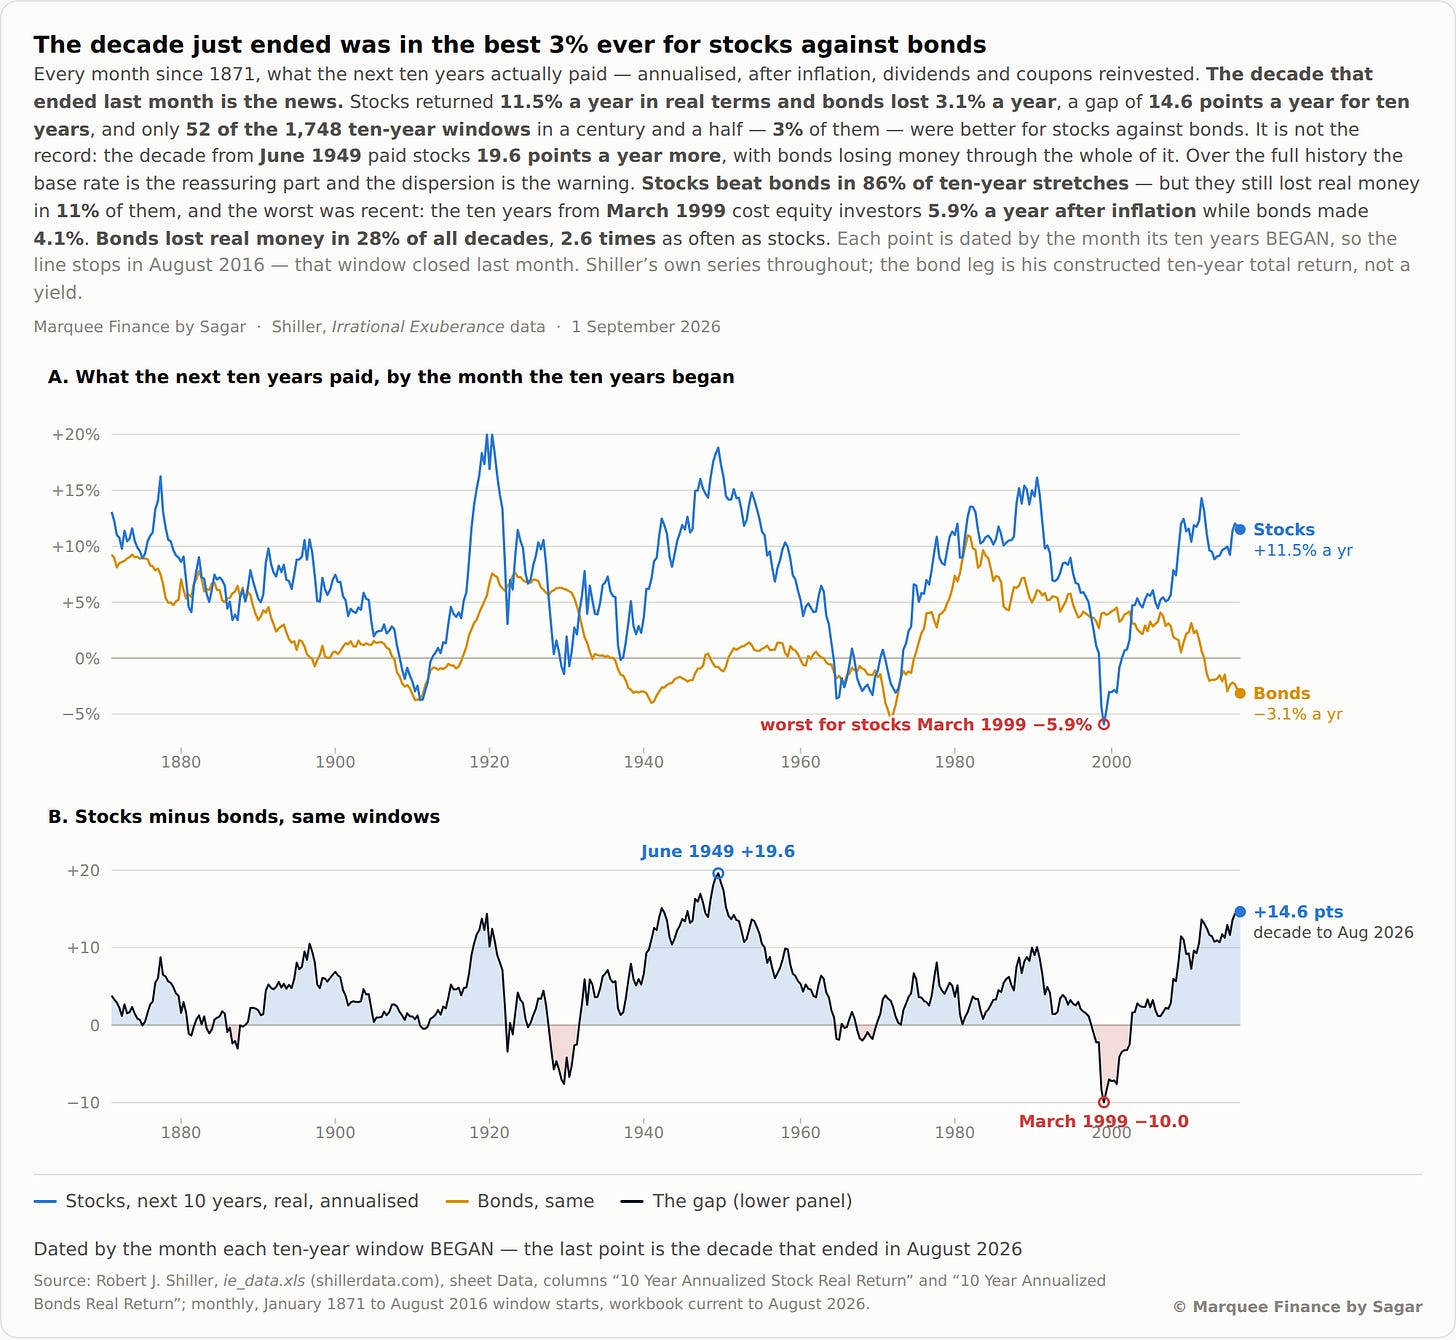
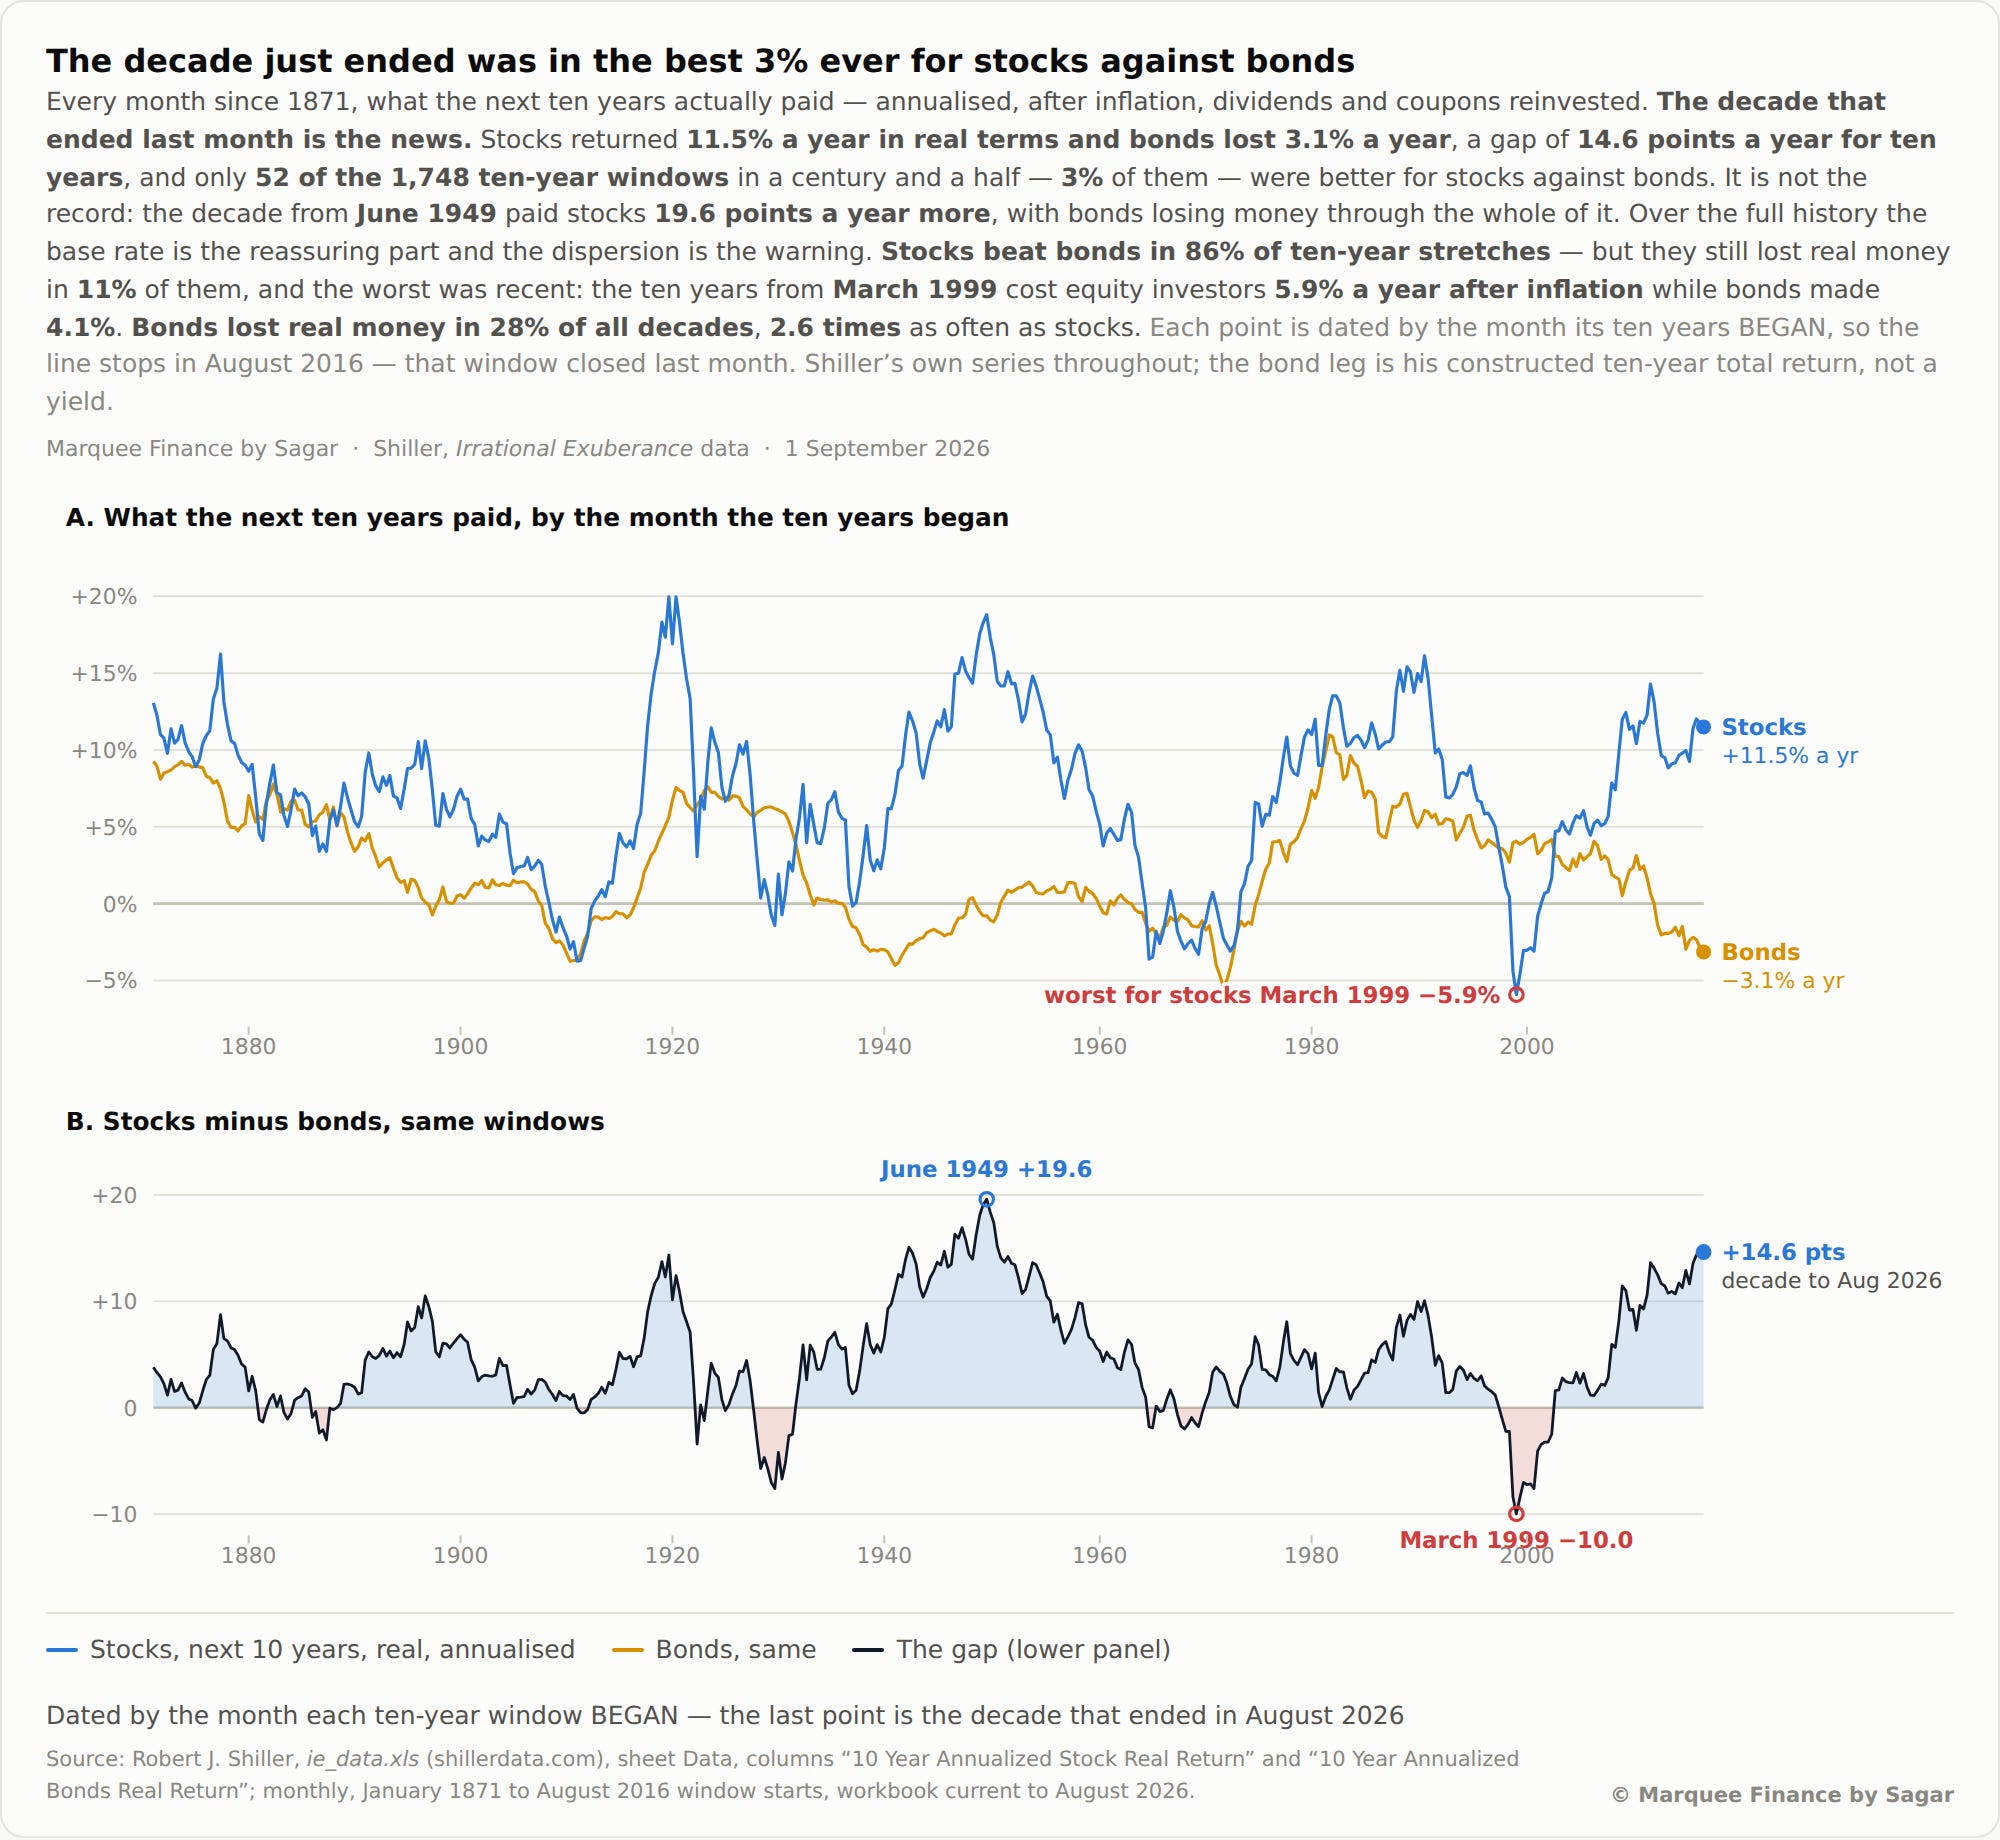
Pre-COVID bonds were a natural hedge against stock volatility, so 60:40 portfolios were introduced.
However, bonds have failed to provide a cushion, as they have been in a bear market post-COVID due to the inflation of the 2020s.
Thus, stocks less bonds have returned a whopping 14.6% (a decade to August 2026), a rare feat.
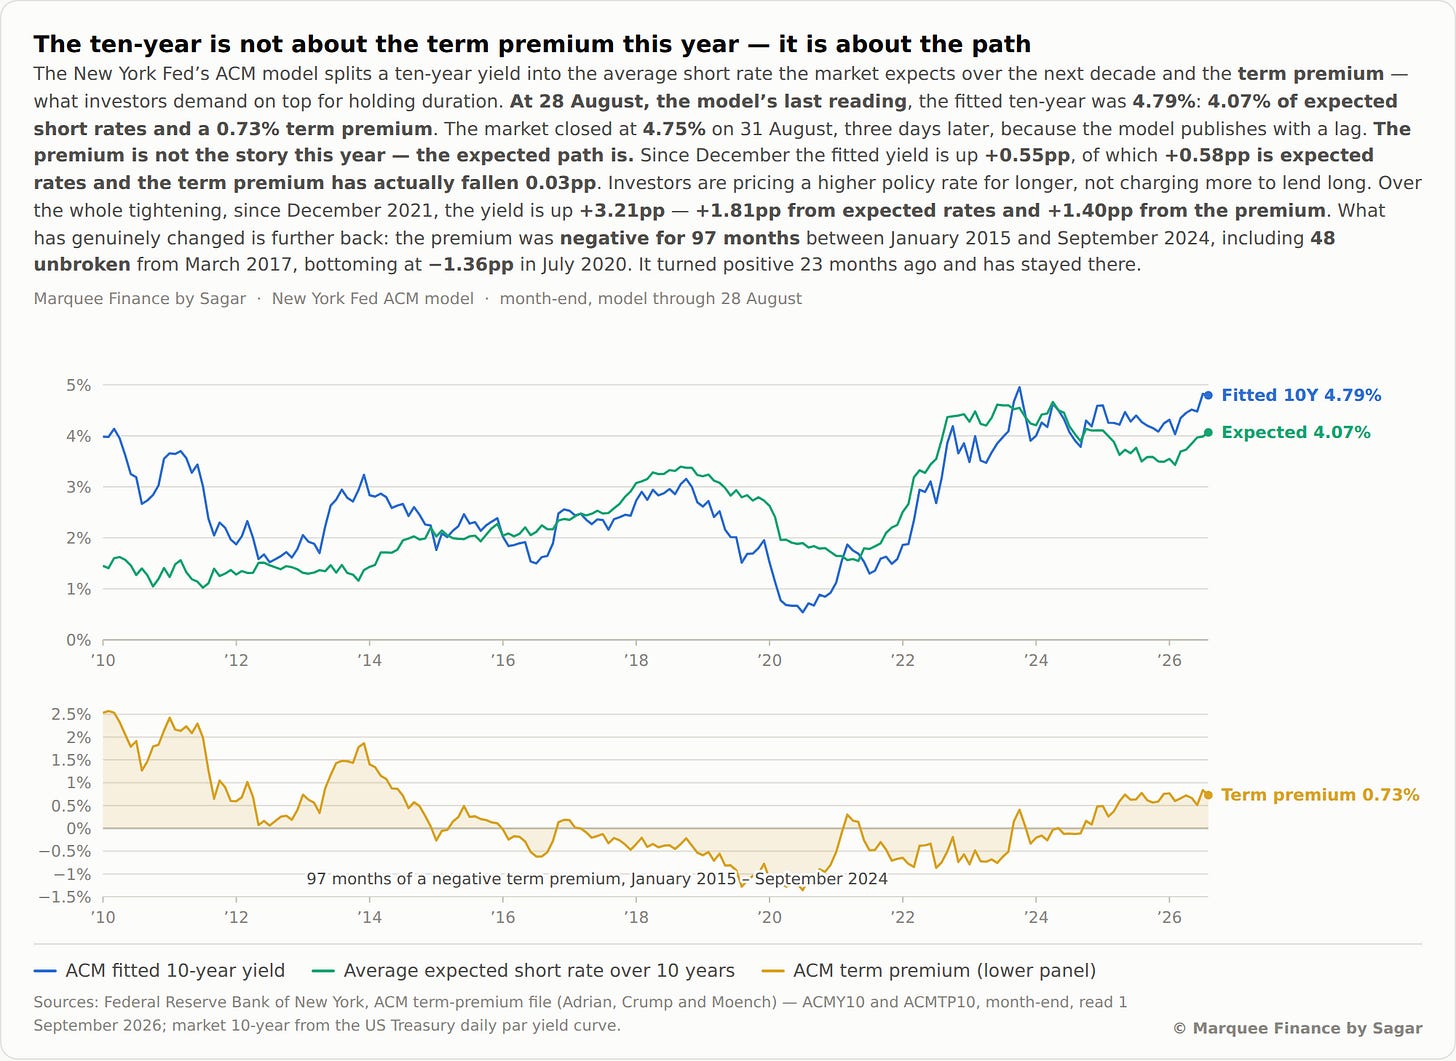
The chatter is all about bonds and duration in markets as the government intervention has failed to push down long-term yields.
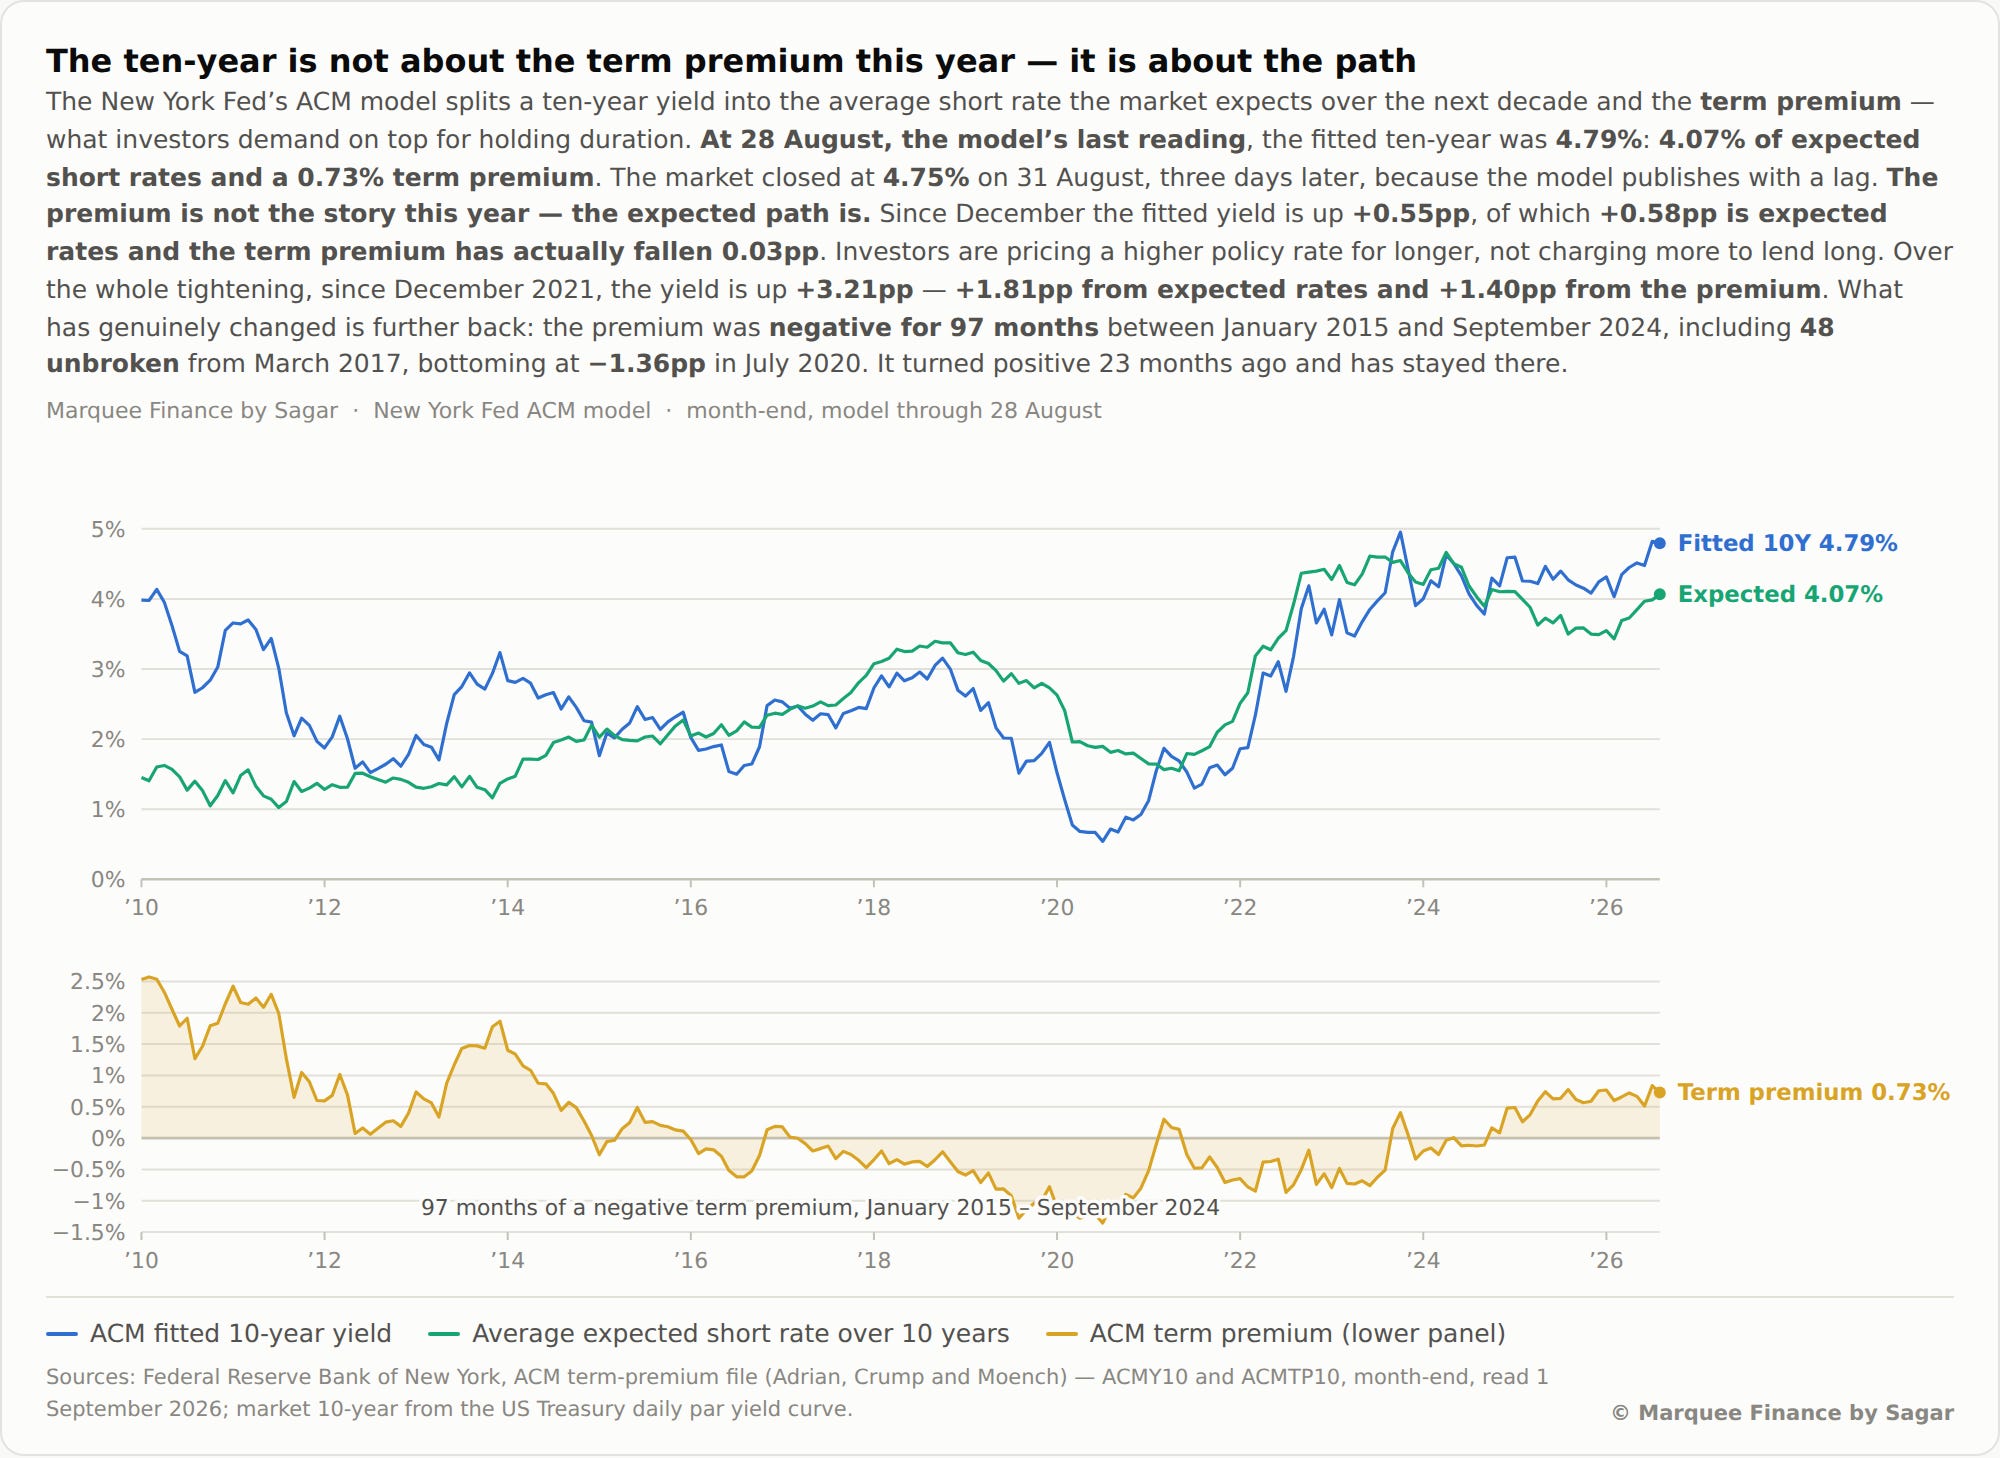
We call this “normalisation” as term premium has risen to 73 bps after 97 months of negative term premium (Jan 15- Sep 24).
The pre-GFC era had upwards of 150 bps of term premia; however, it also had a lower Debt/GDP ratio.
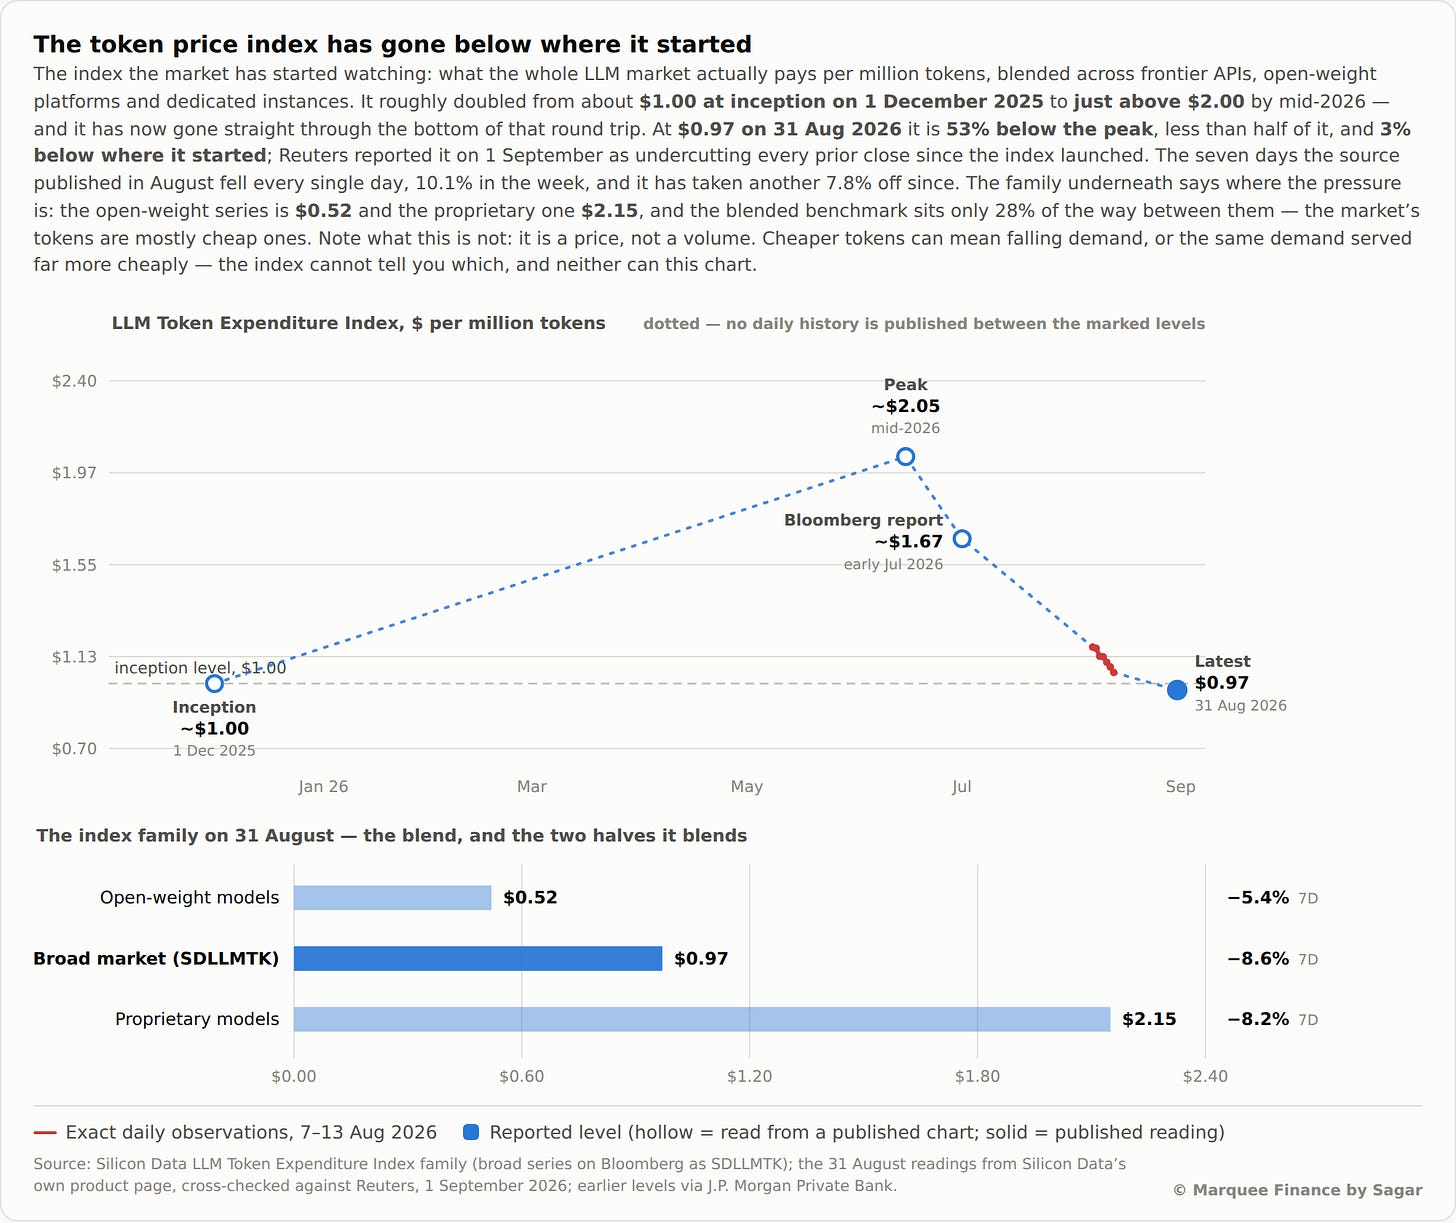
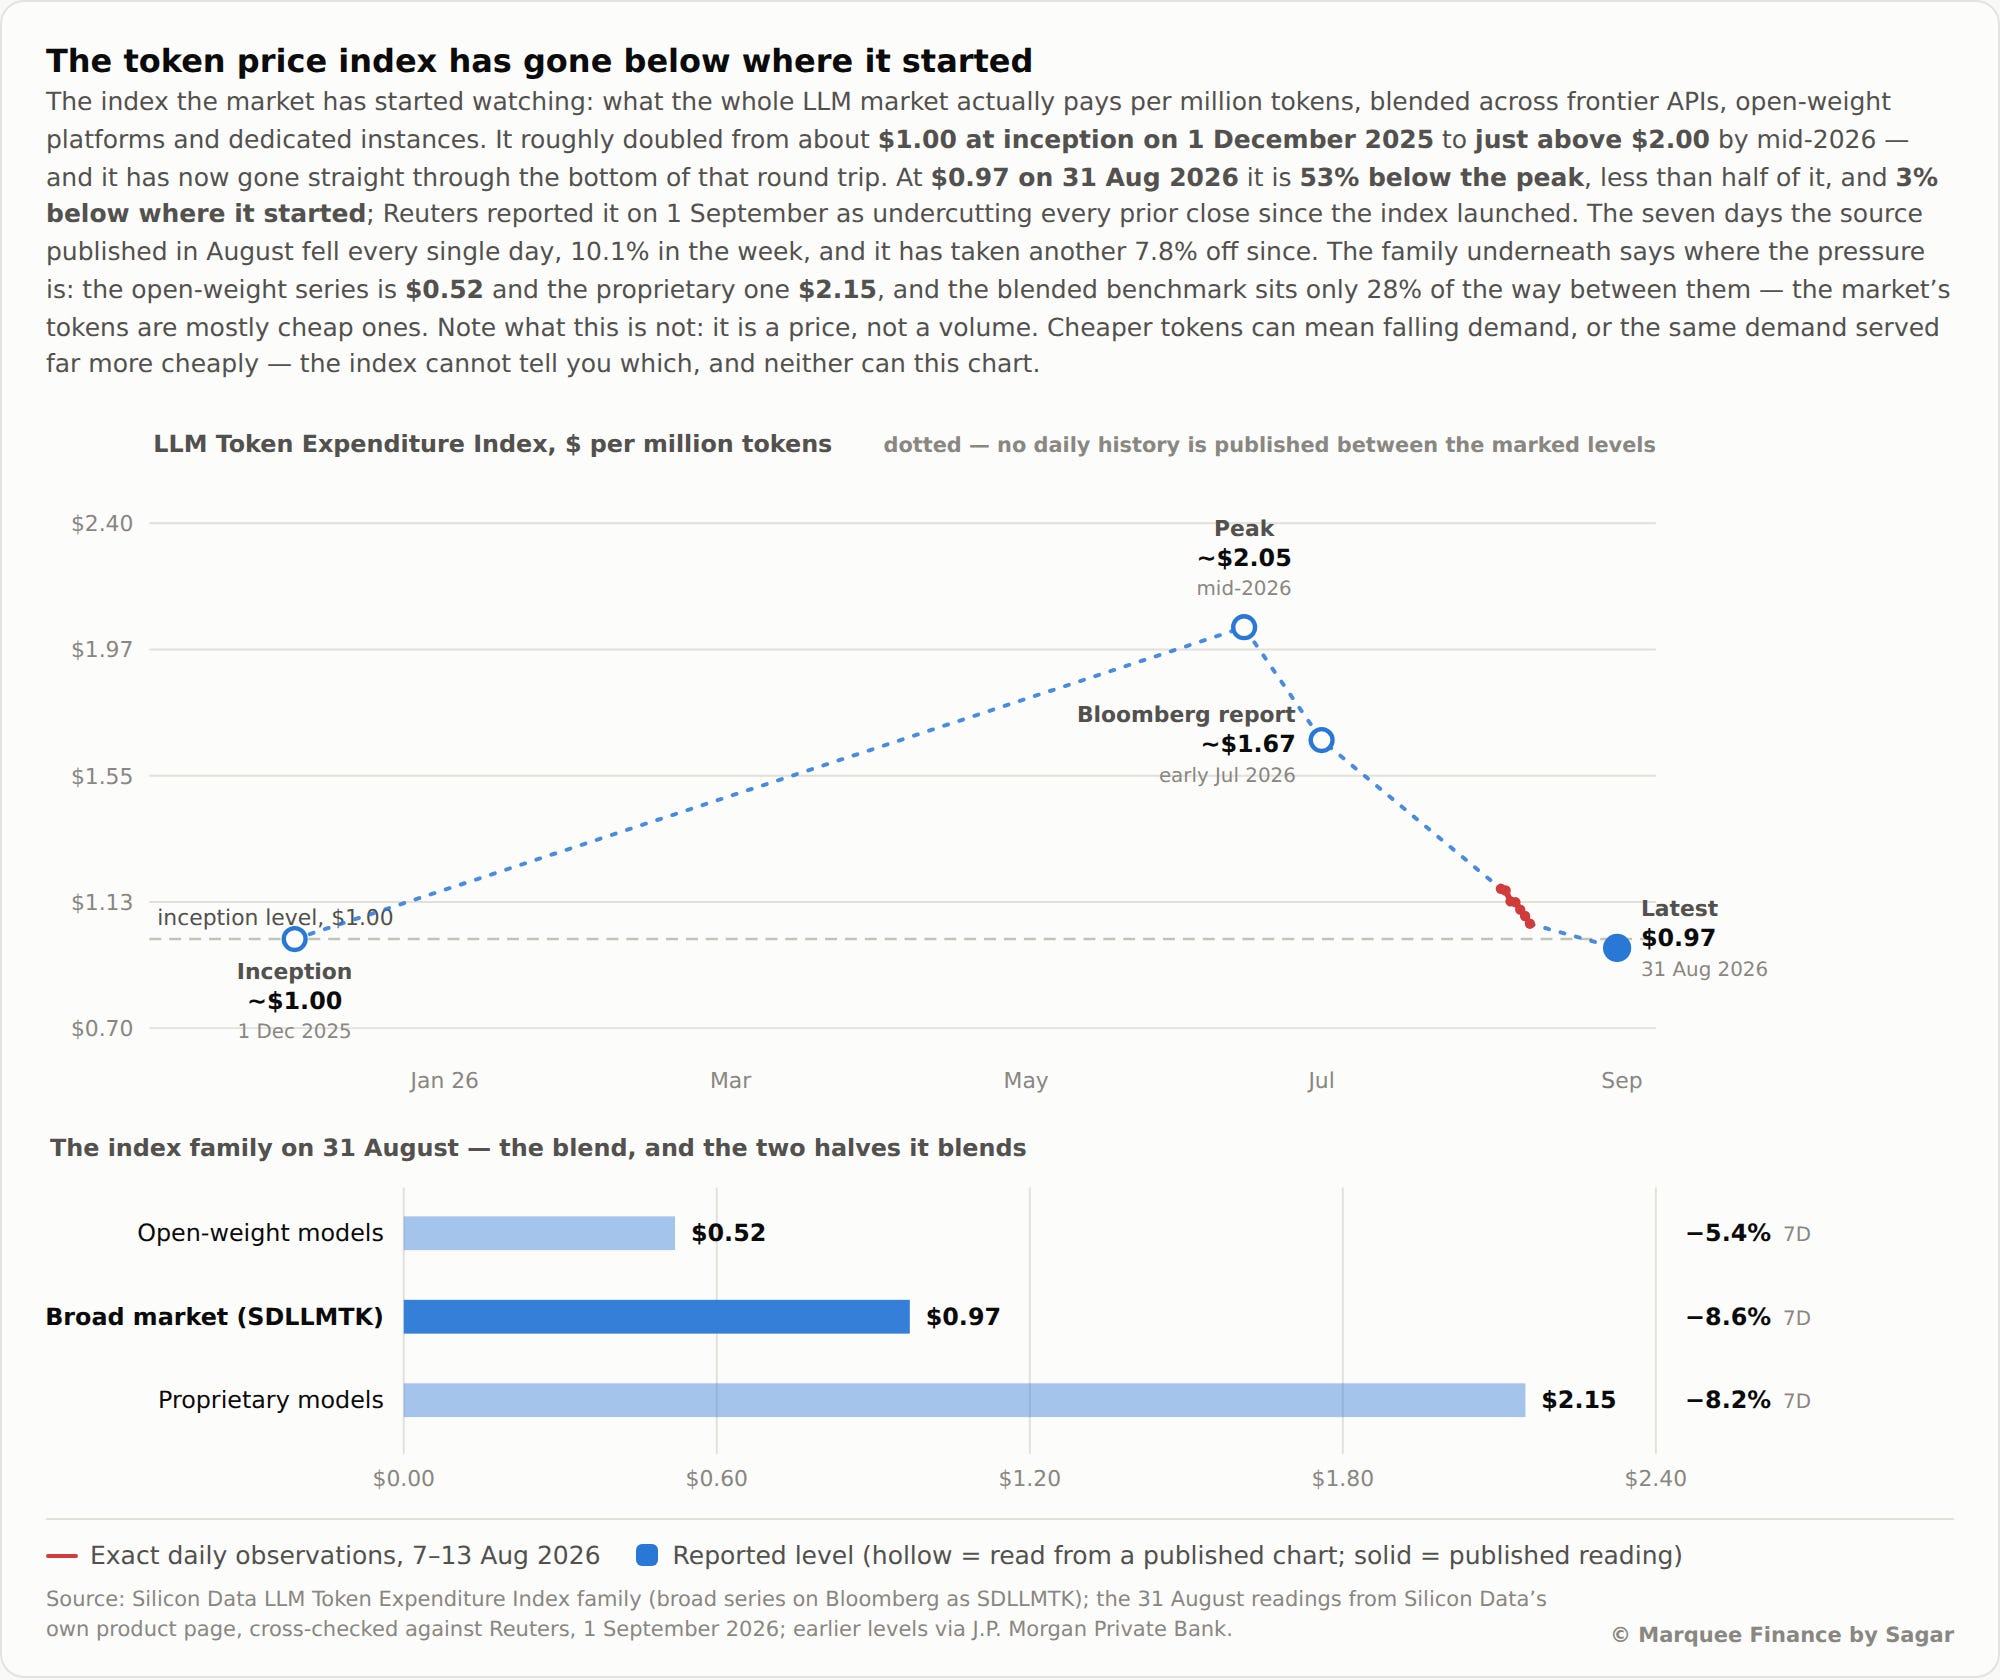
Before we end the US section, one chart that explains the rise and fall of the AI story.
The token price index peaked when semis peaked, and since then, the token prices have crashed by 50%.
Led by ultra-cheap Chinese open-weight models, token prices have taken a U-turn amid rising competition.
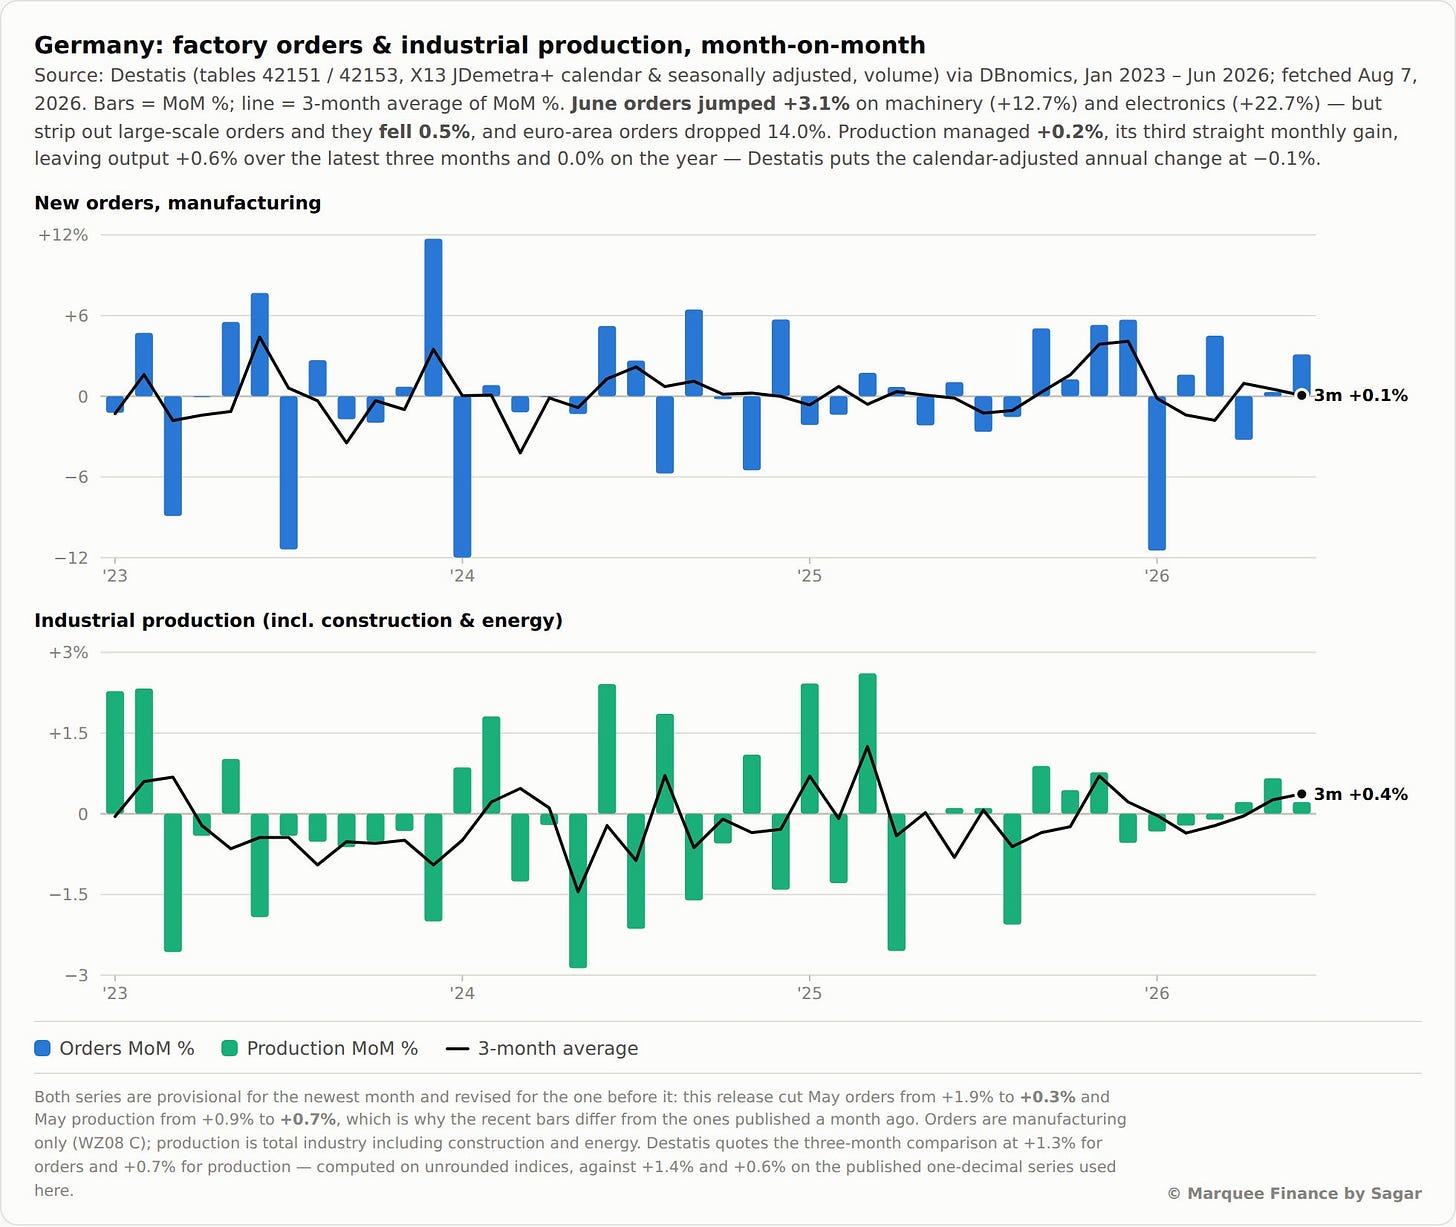
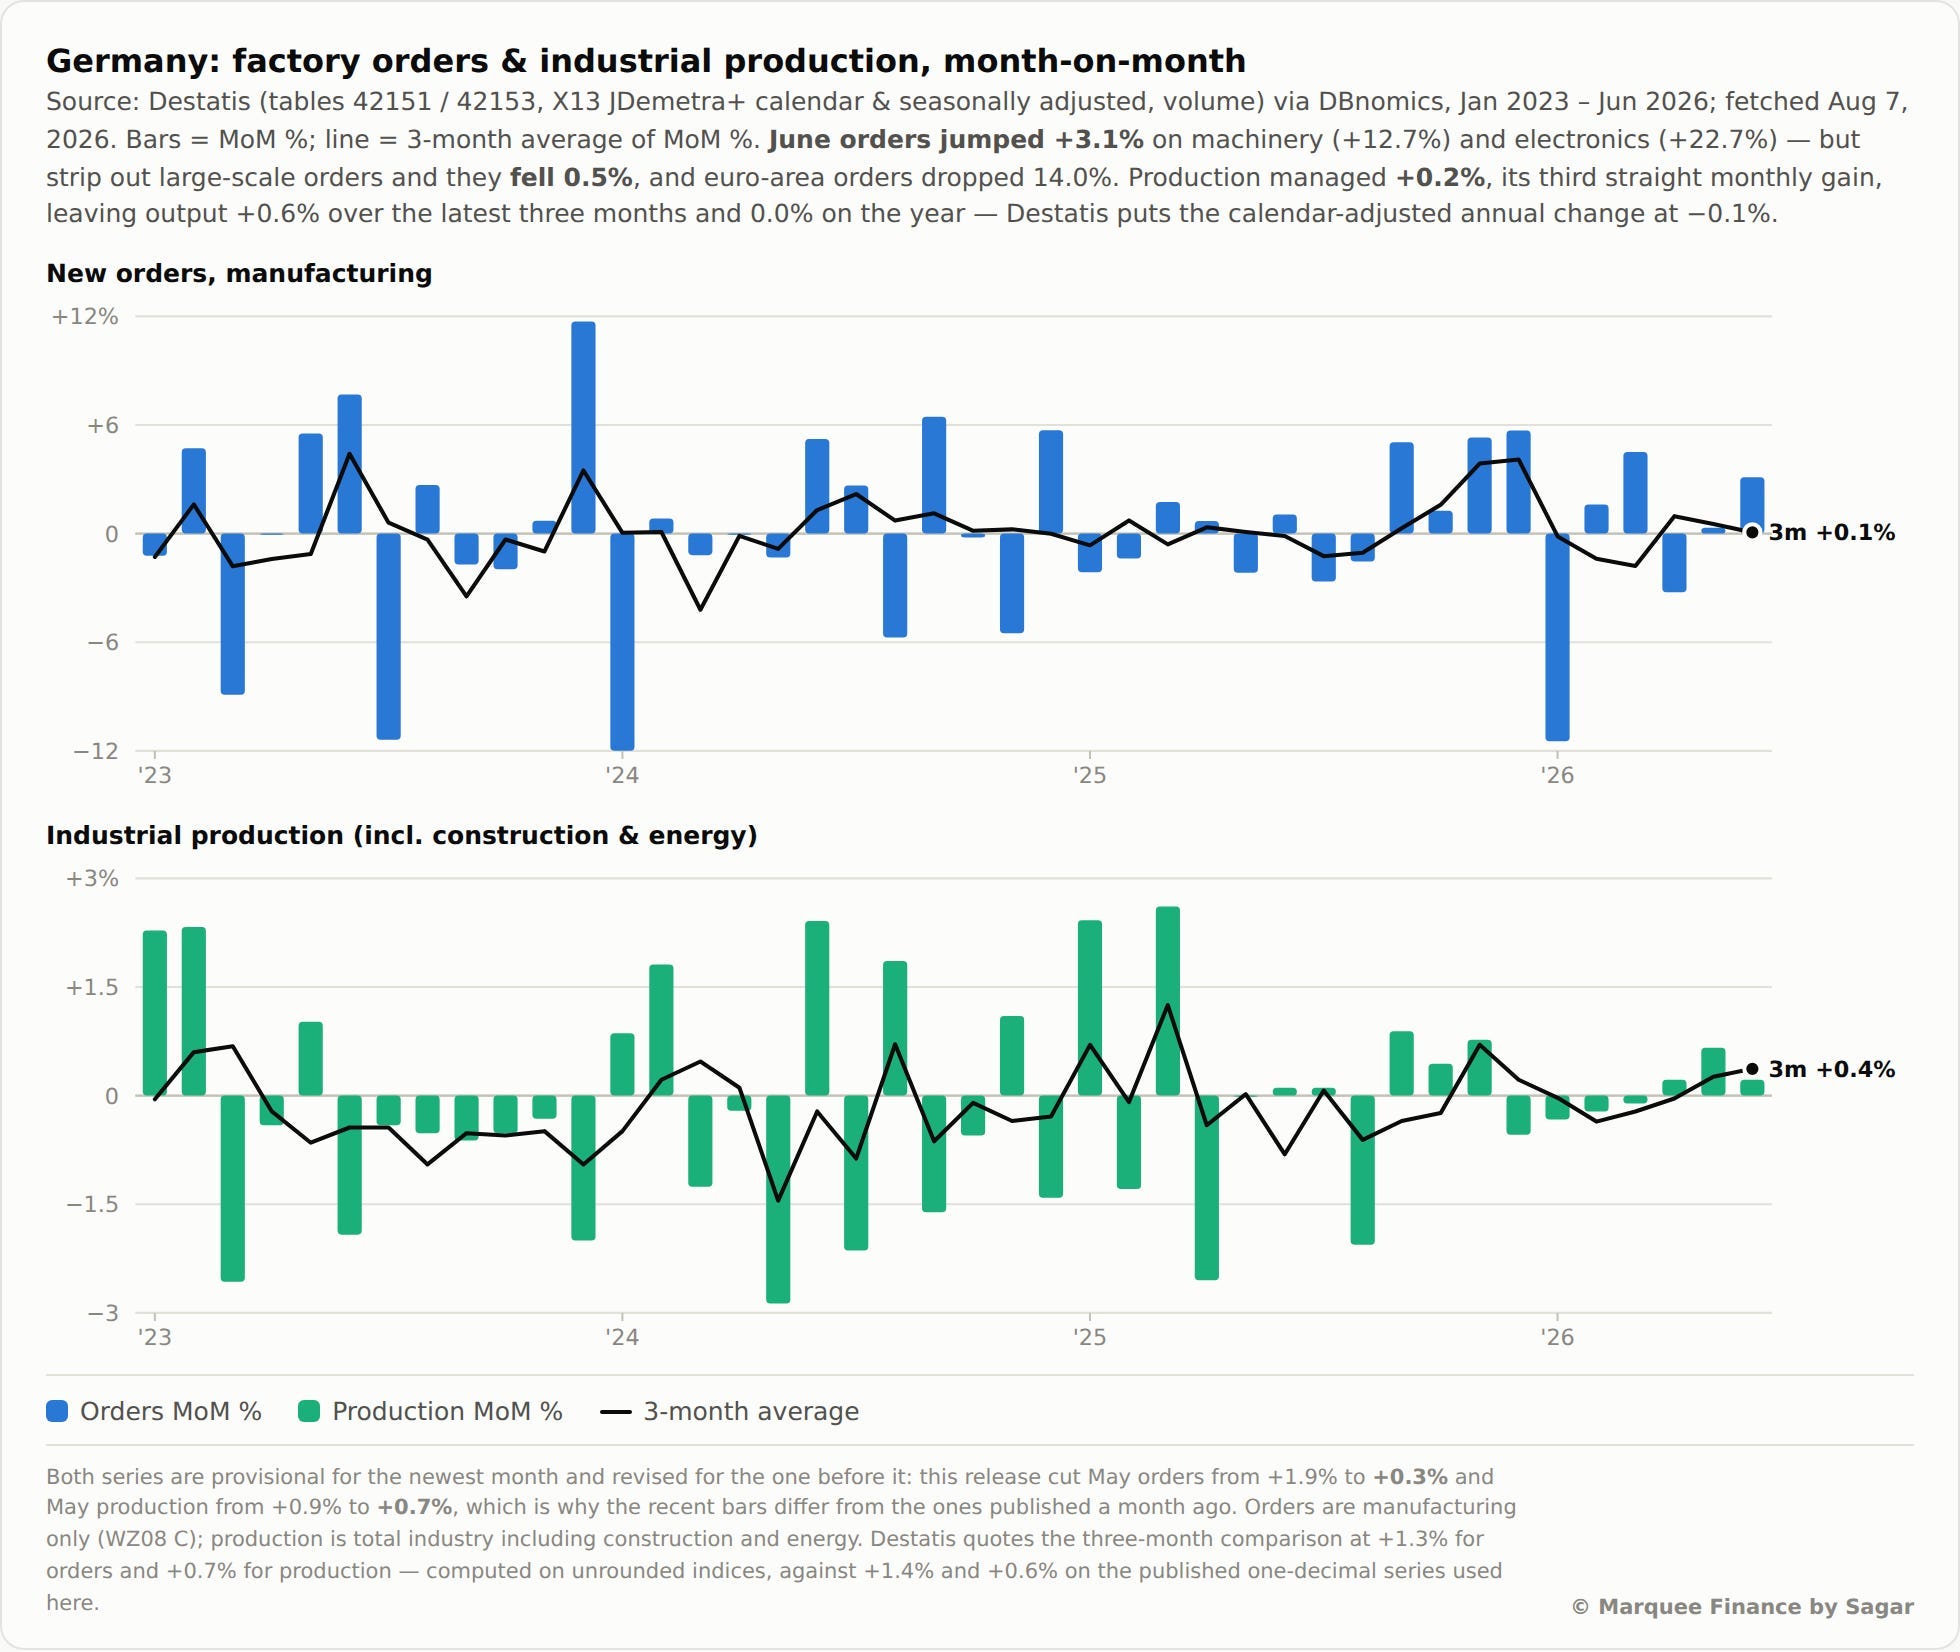
German industrial production rose 0.2% in June MoM, beating estimates (0.1% MoM).
Furthermore, June orders jumped 3.1% MoM, led by machinery and electronics.
Overall, the rebound after the March dip continues, and the recovery has been swift.
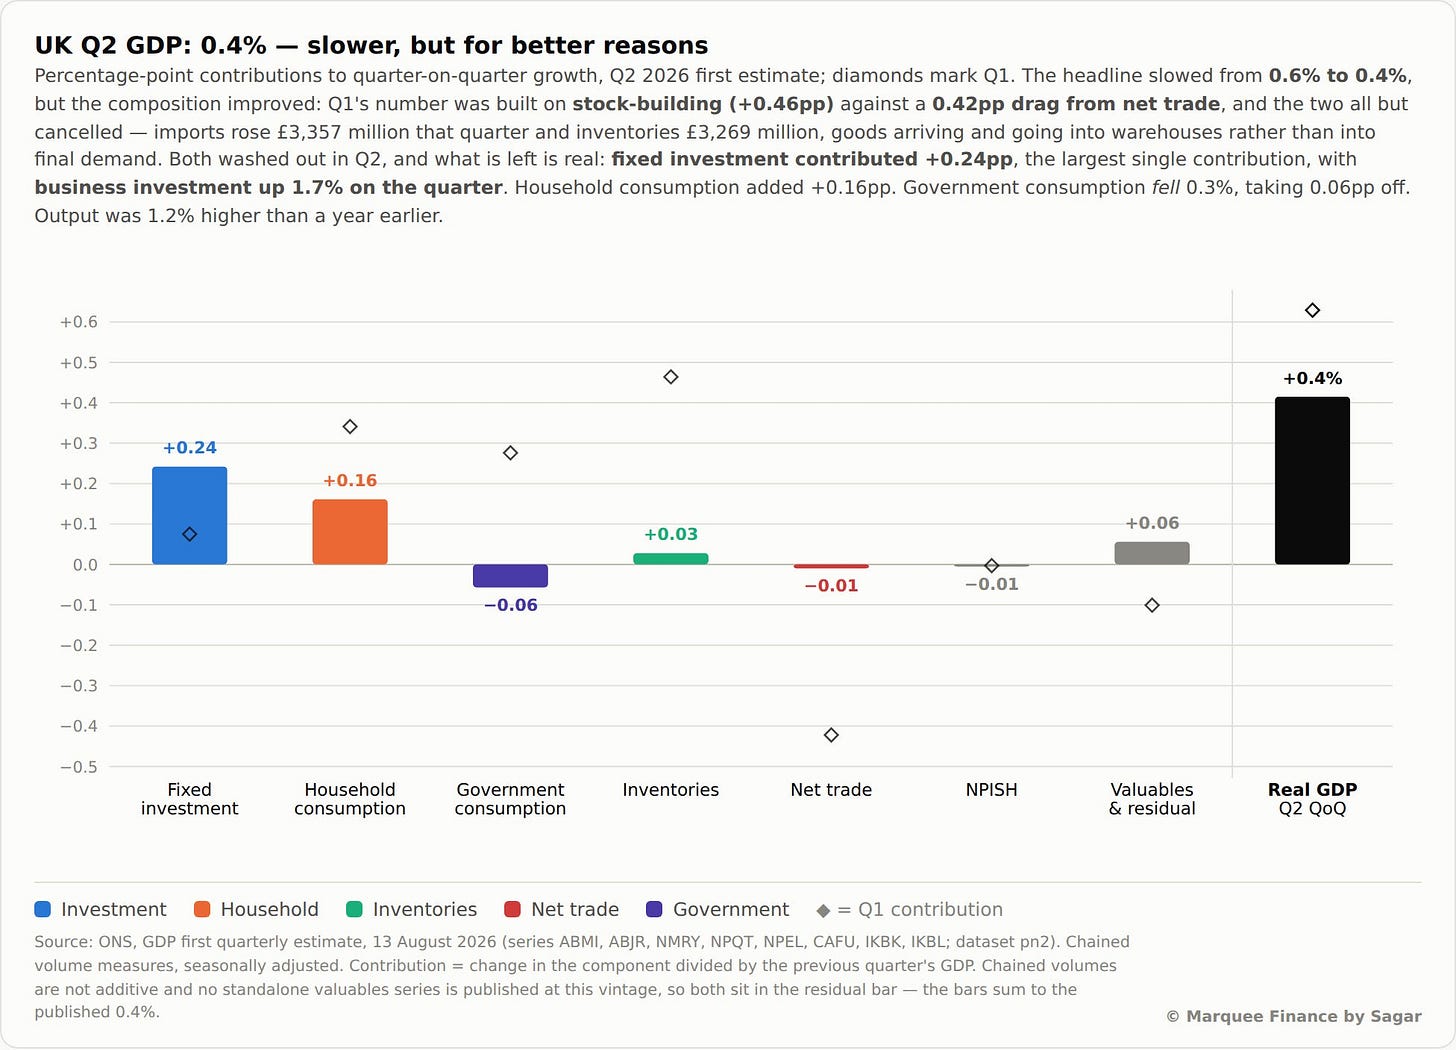
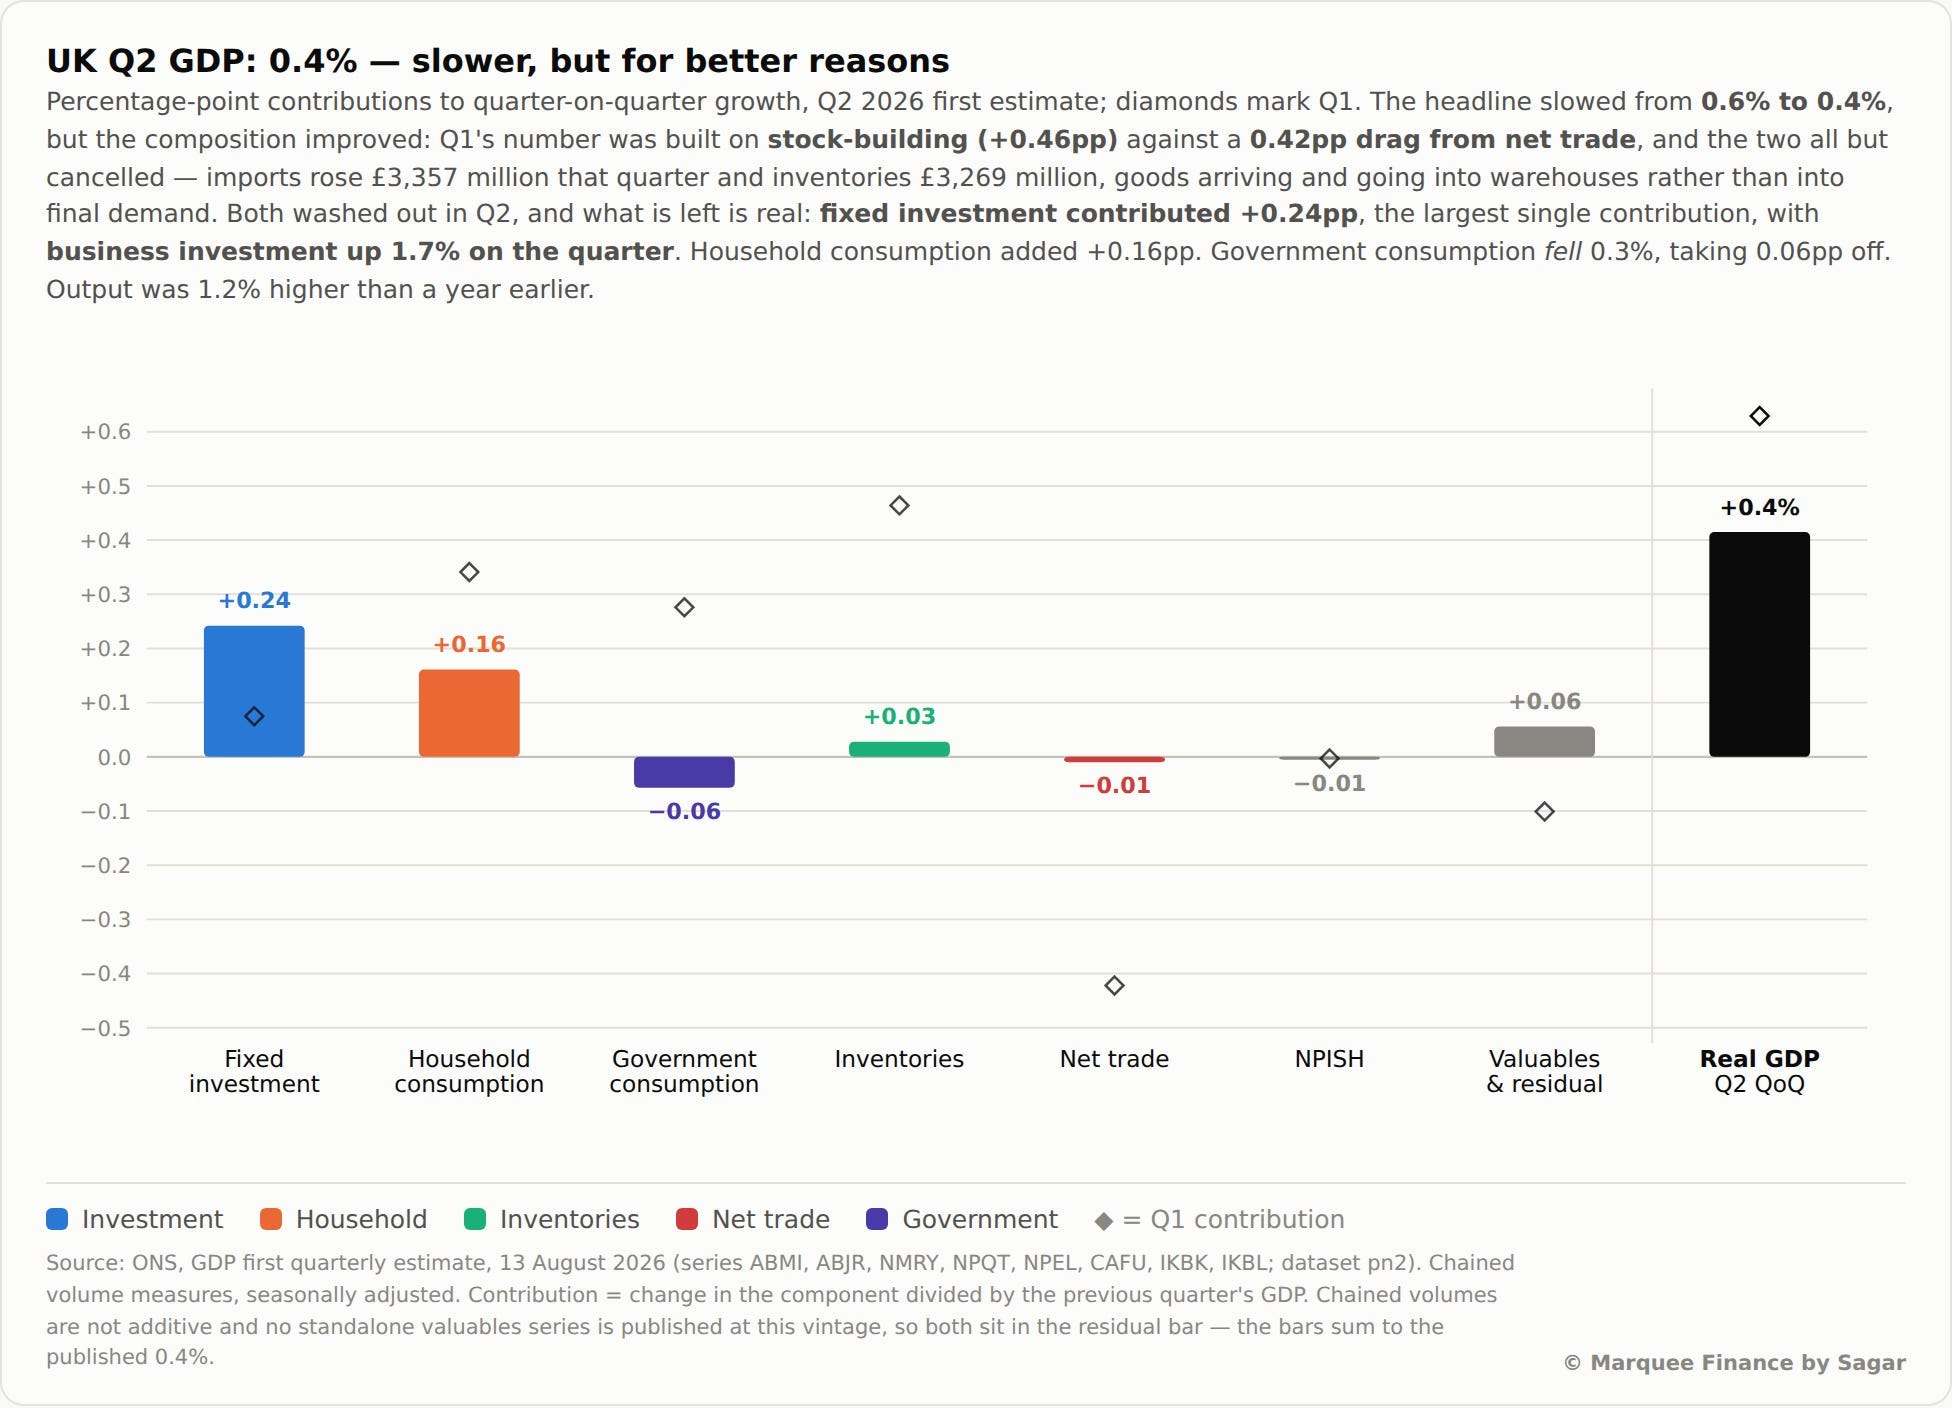
UK Q2 GDP slowed to +0.4% from +0.6%, but the composition improved sharply: Q1’s number was built on stock-building (+0.46pp) against a 0.42pp net-trade drag — goods landing in warehouses rather than final demand.
Fixed investment contributed +0.24pp, the largest single component, with business investment up 1.7% on the quarter, and output 1.2% higher than a year earlier.
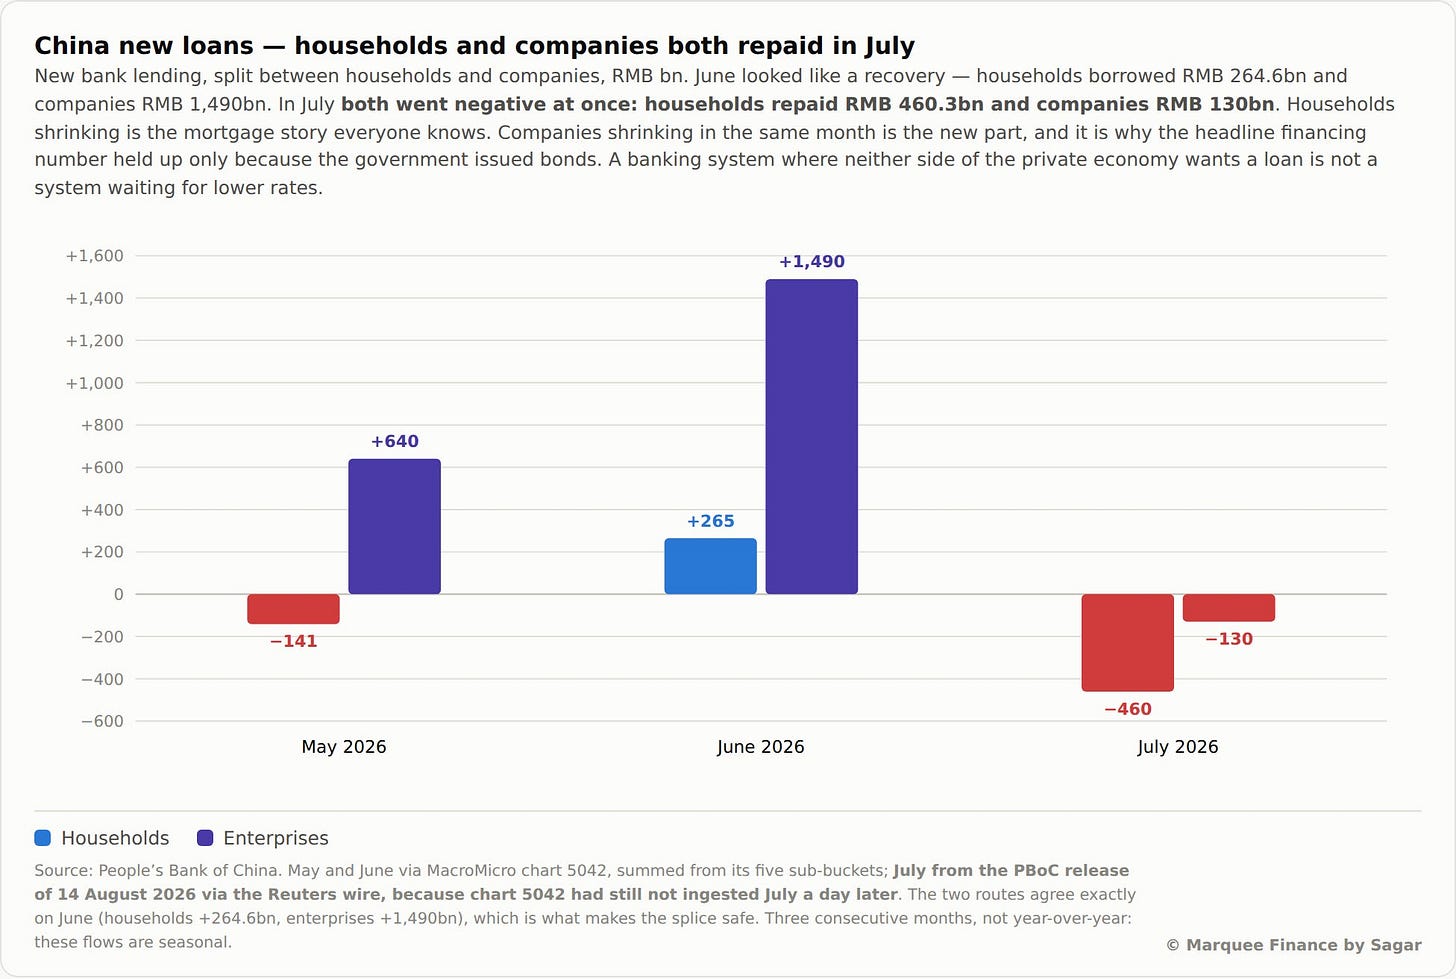
China’s macro has been deteriorating rapidly as the balance sheet recession accelerates.
In July, both Households and corporates (private sector) went negative at once: households repaid RMB 460bn while companies repaid RMB 130bn.
Ironically, China is perhaps the only country where bond yields continue to fall.
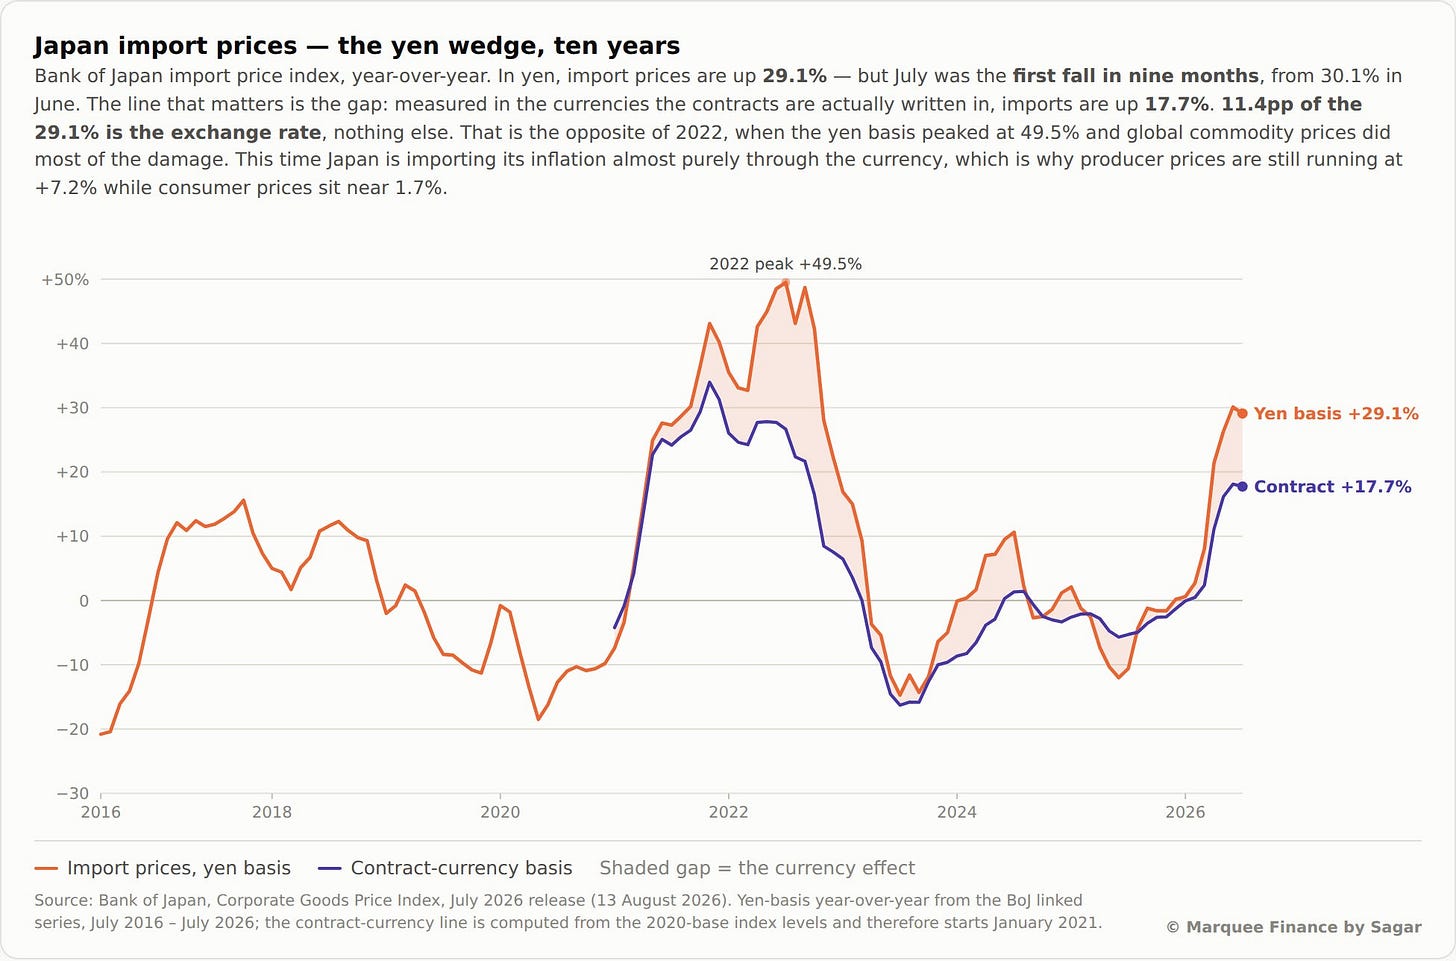
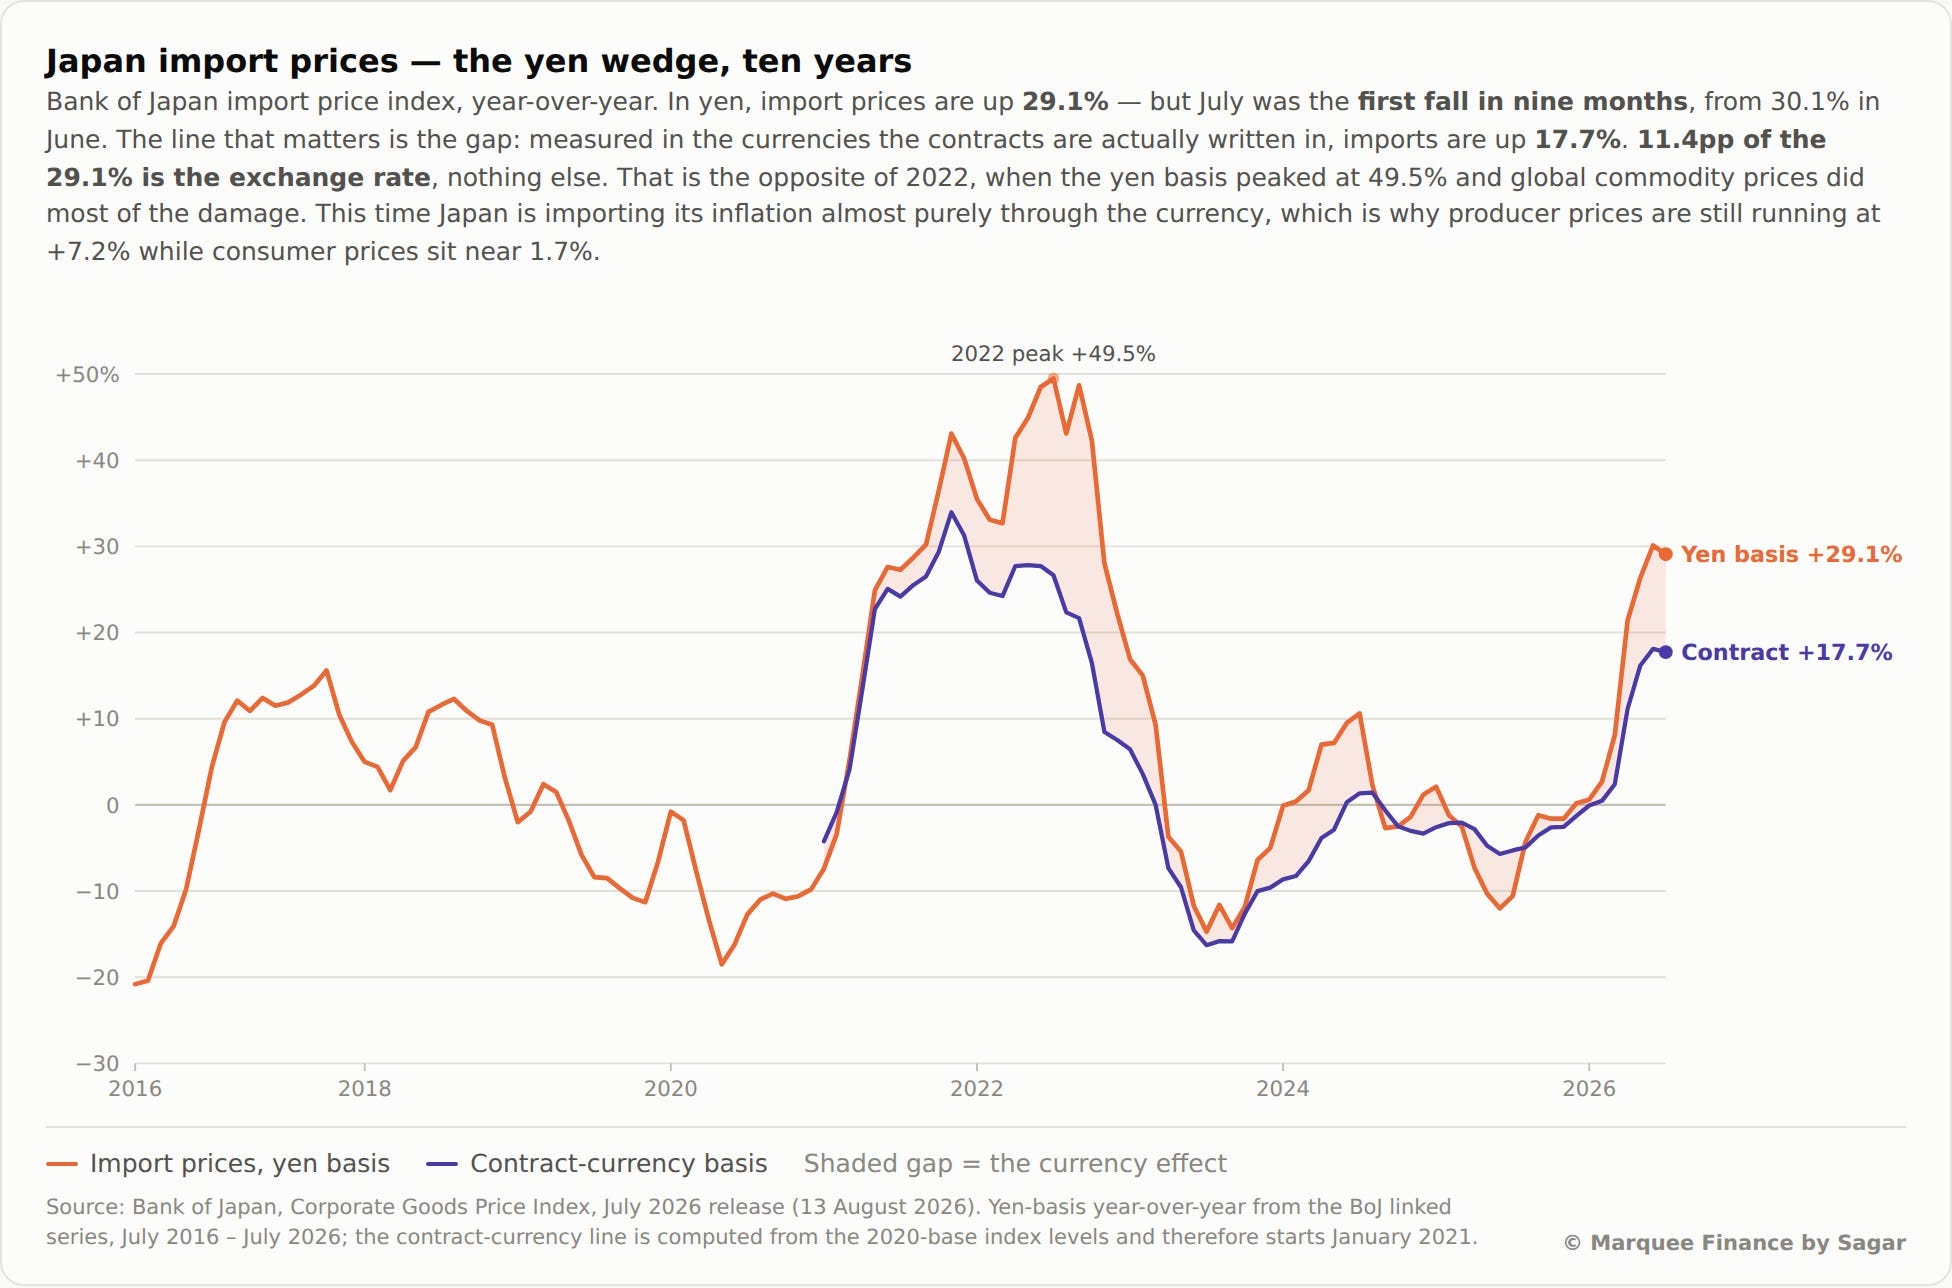
In the land of the rising sun, import prices rose by +29.1% in JPY, and July was the first fall in nine months (MoM).
The story is the wedge: the contract-currency basis is +17.7%, so 11.4pp of that 29.1% is purely the exchange rate (higher USDJPP/ lower JPY).
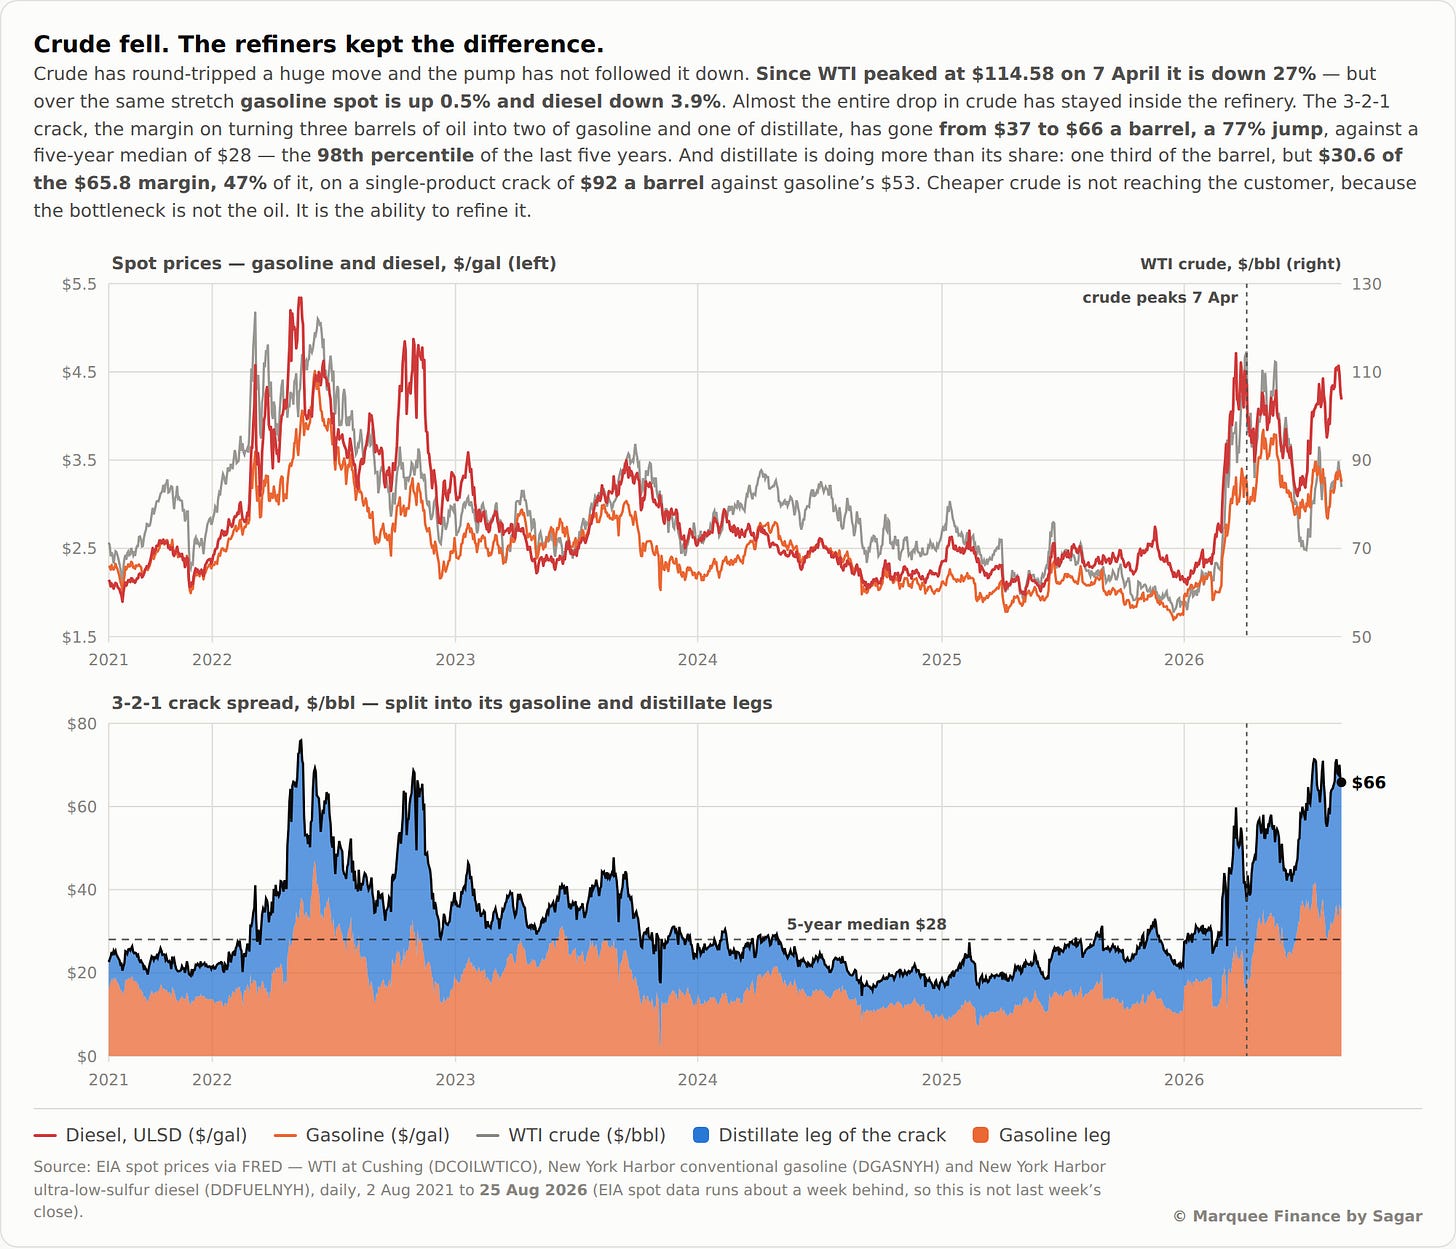
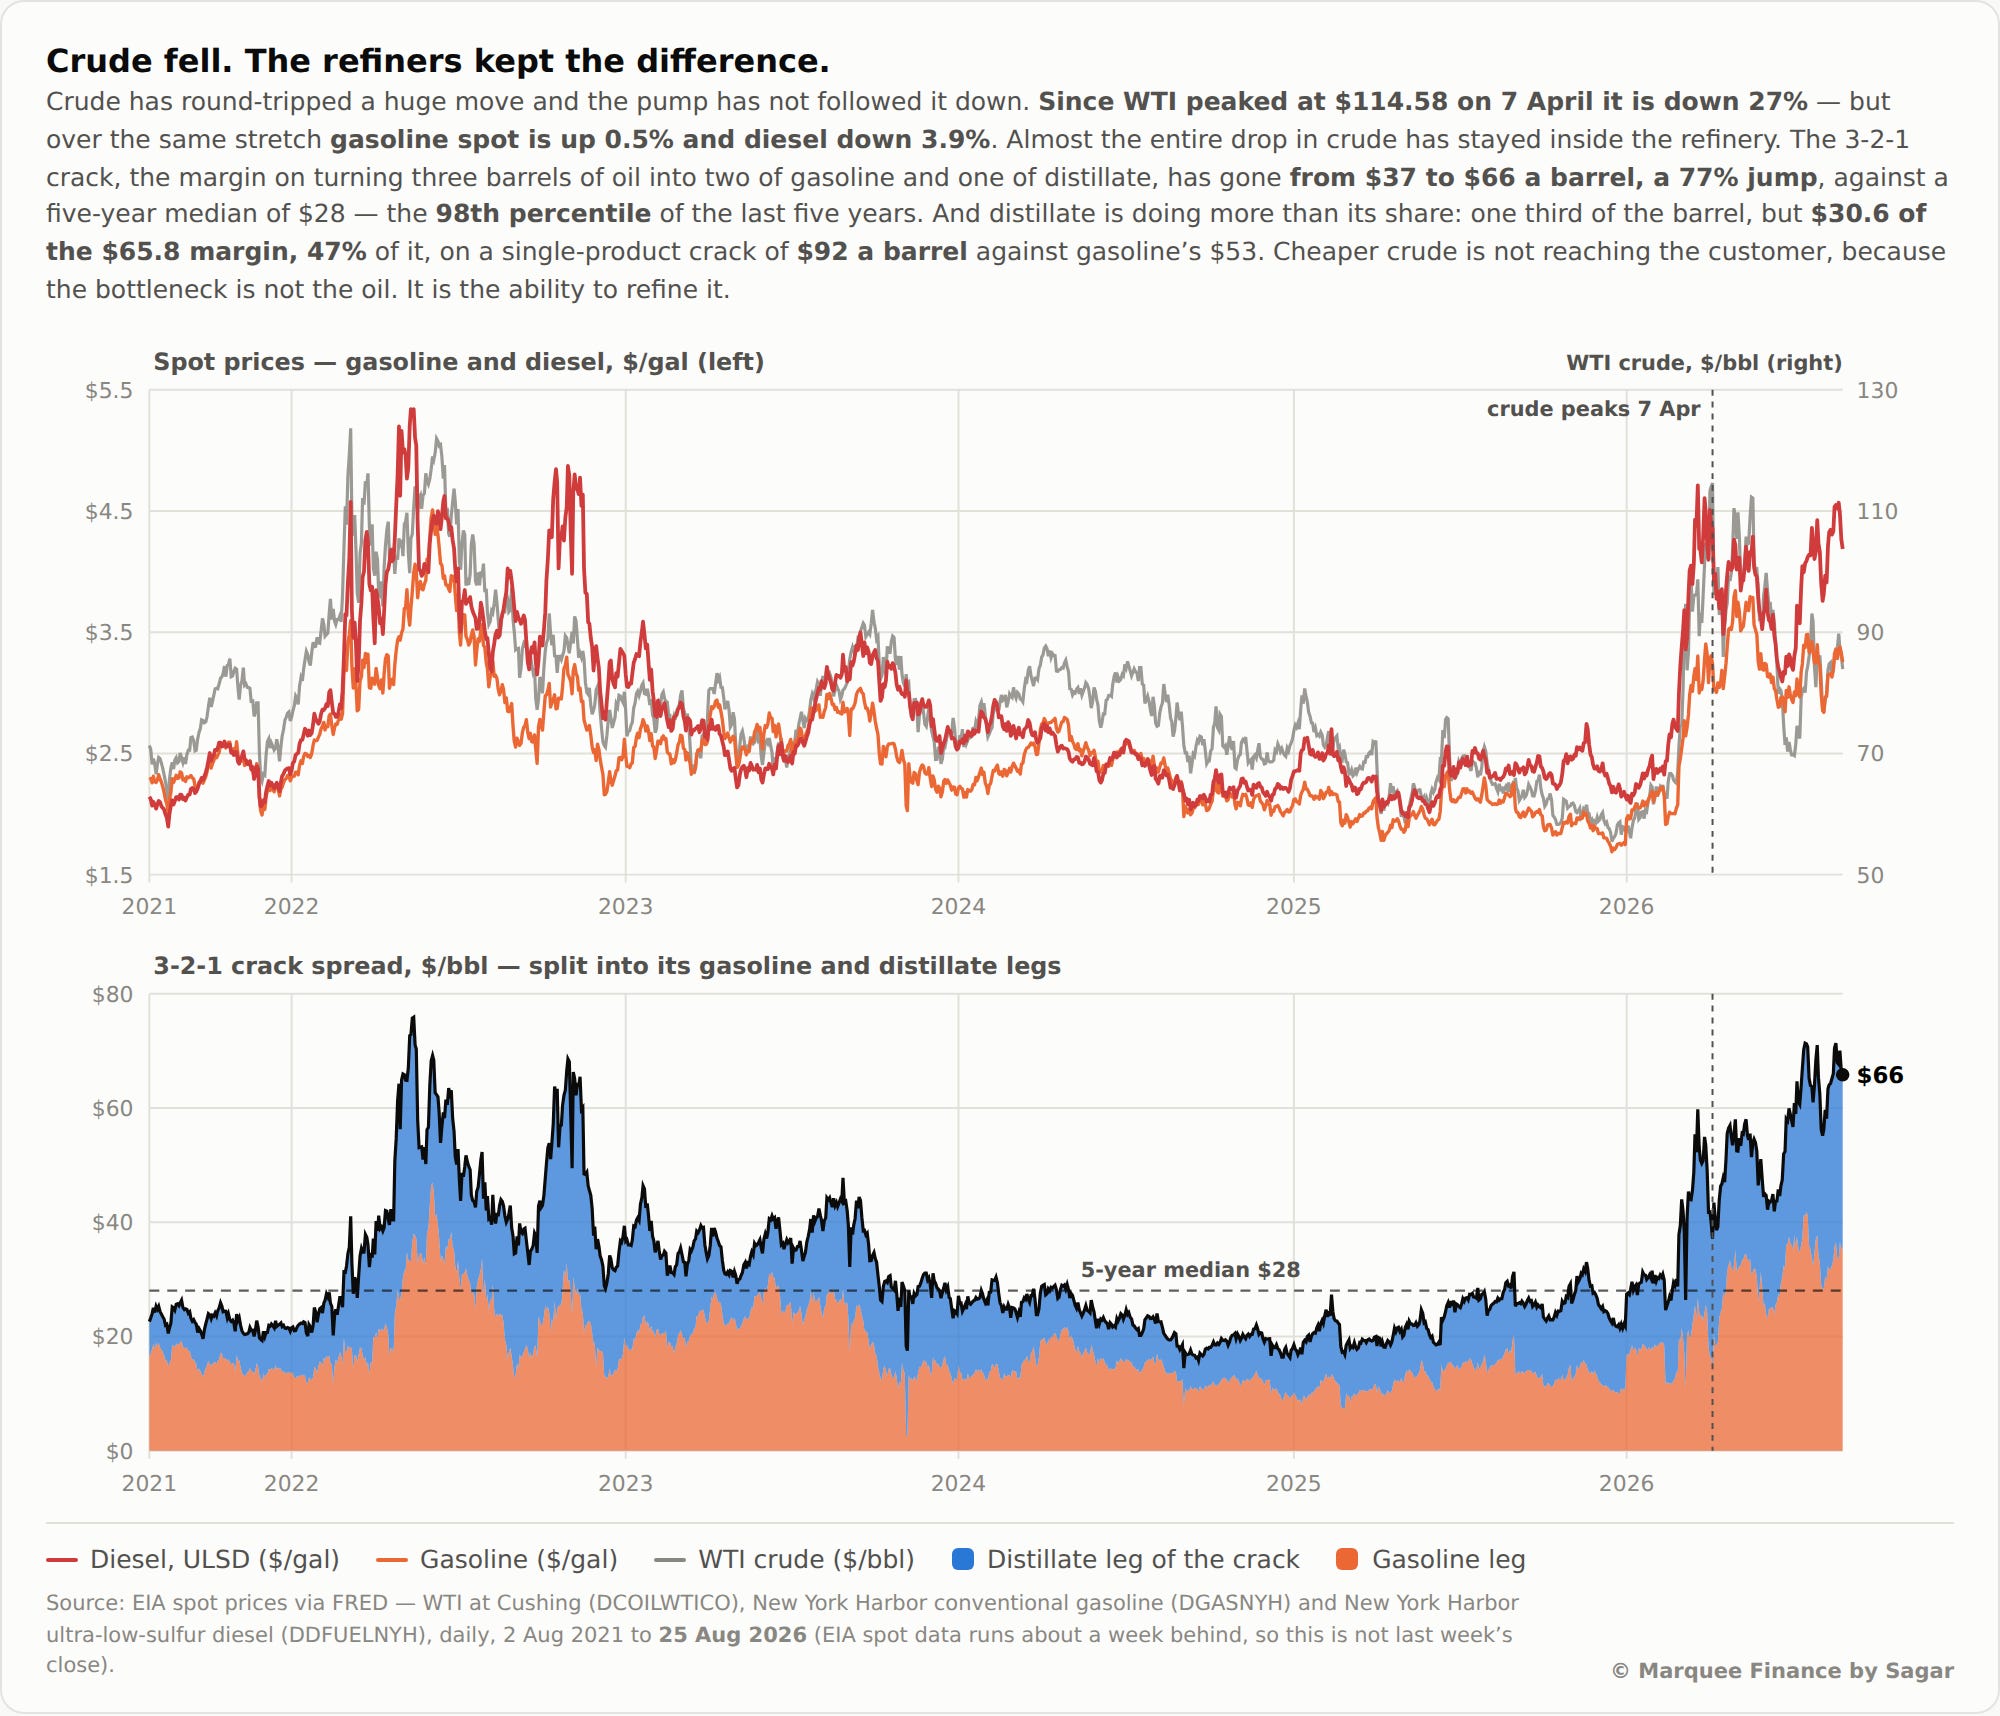
The 3-2-1 crack spread went from $37 to $66 a barrel, +77%, against a five-year median of $28. That’s the 98th percentile of five years.
The coordinated attack on global refinery infrastructure and declining inventories have been the tailwinds for higher product prices.
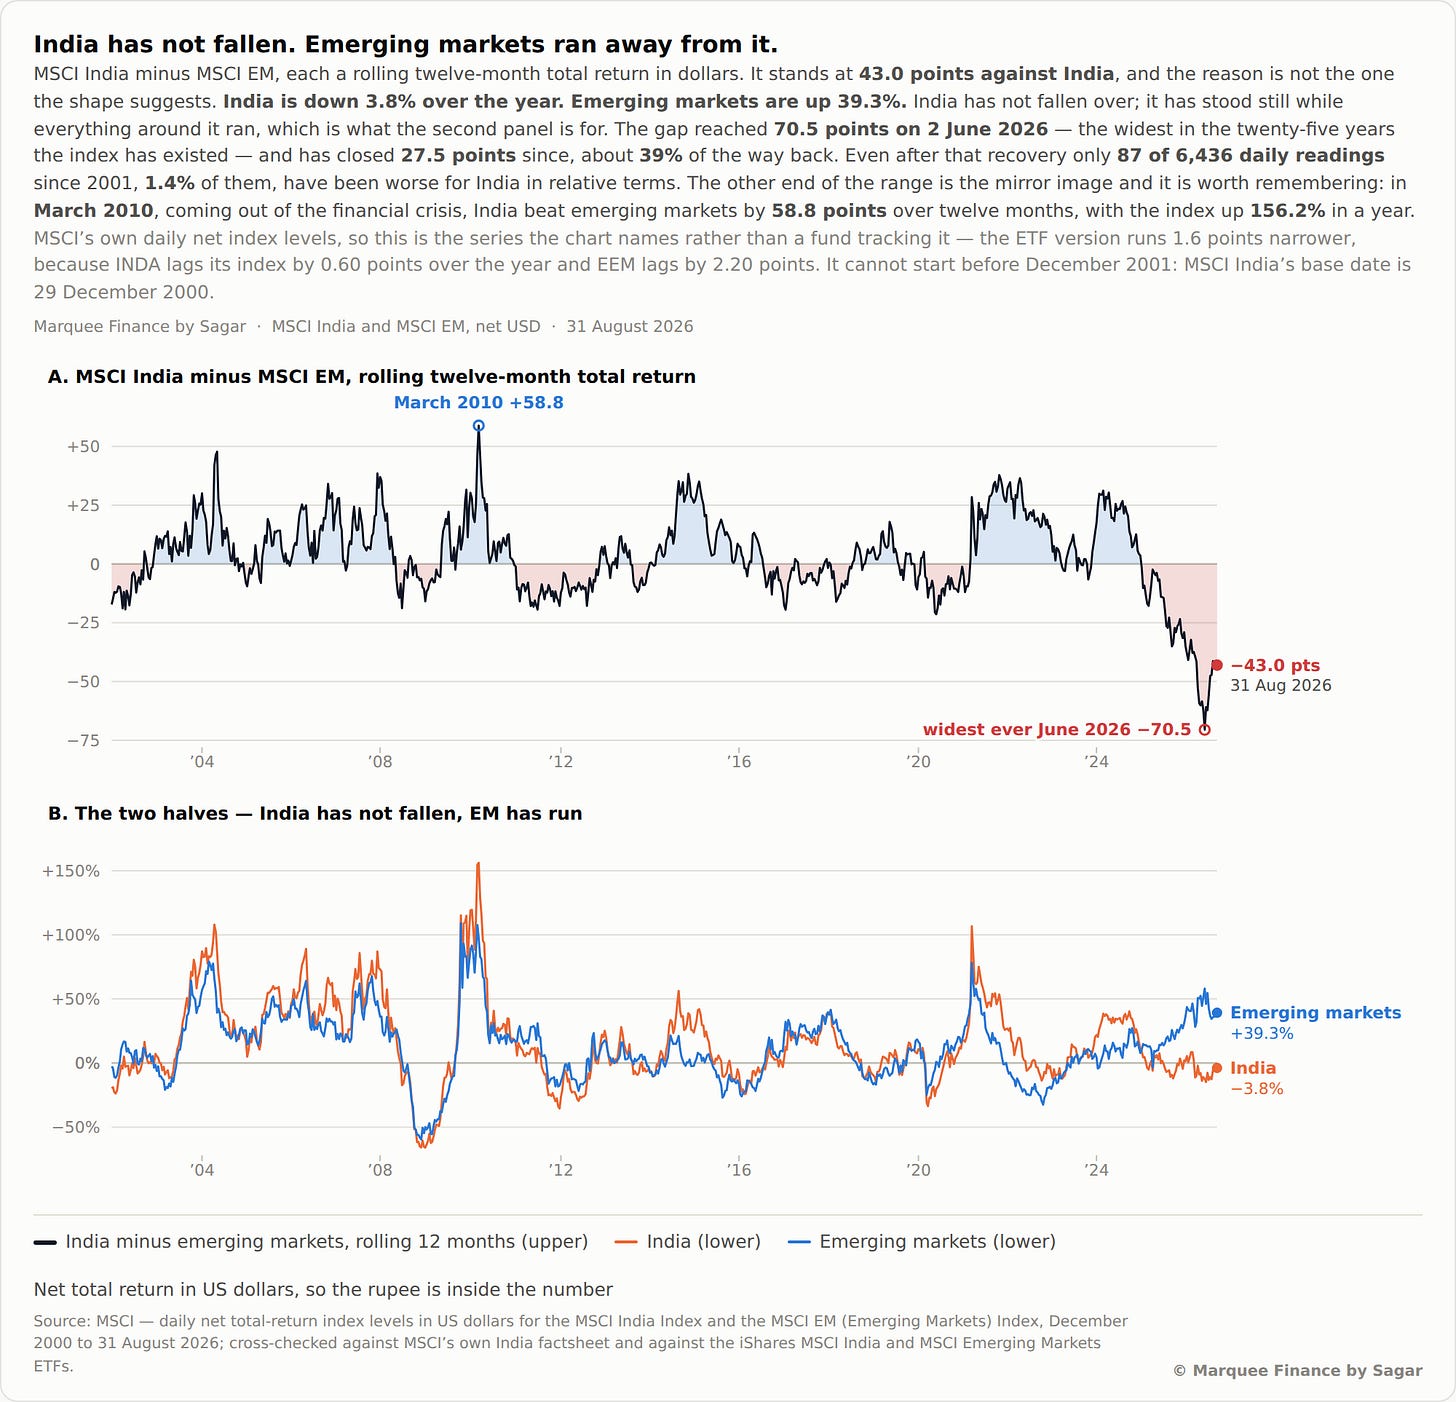
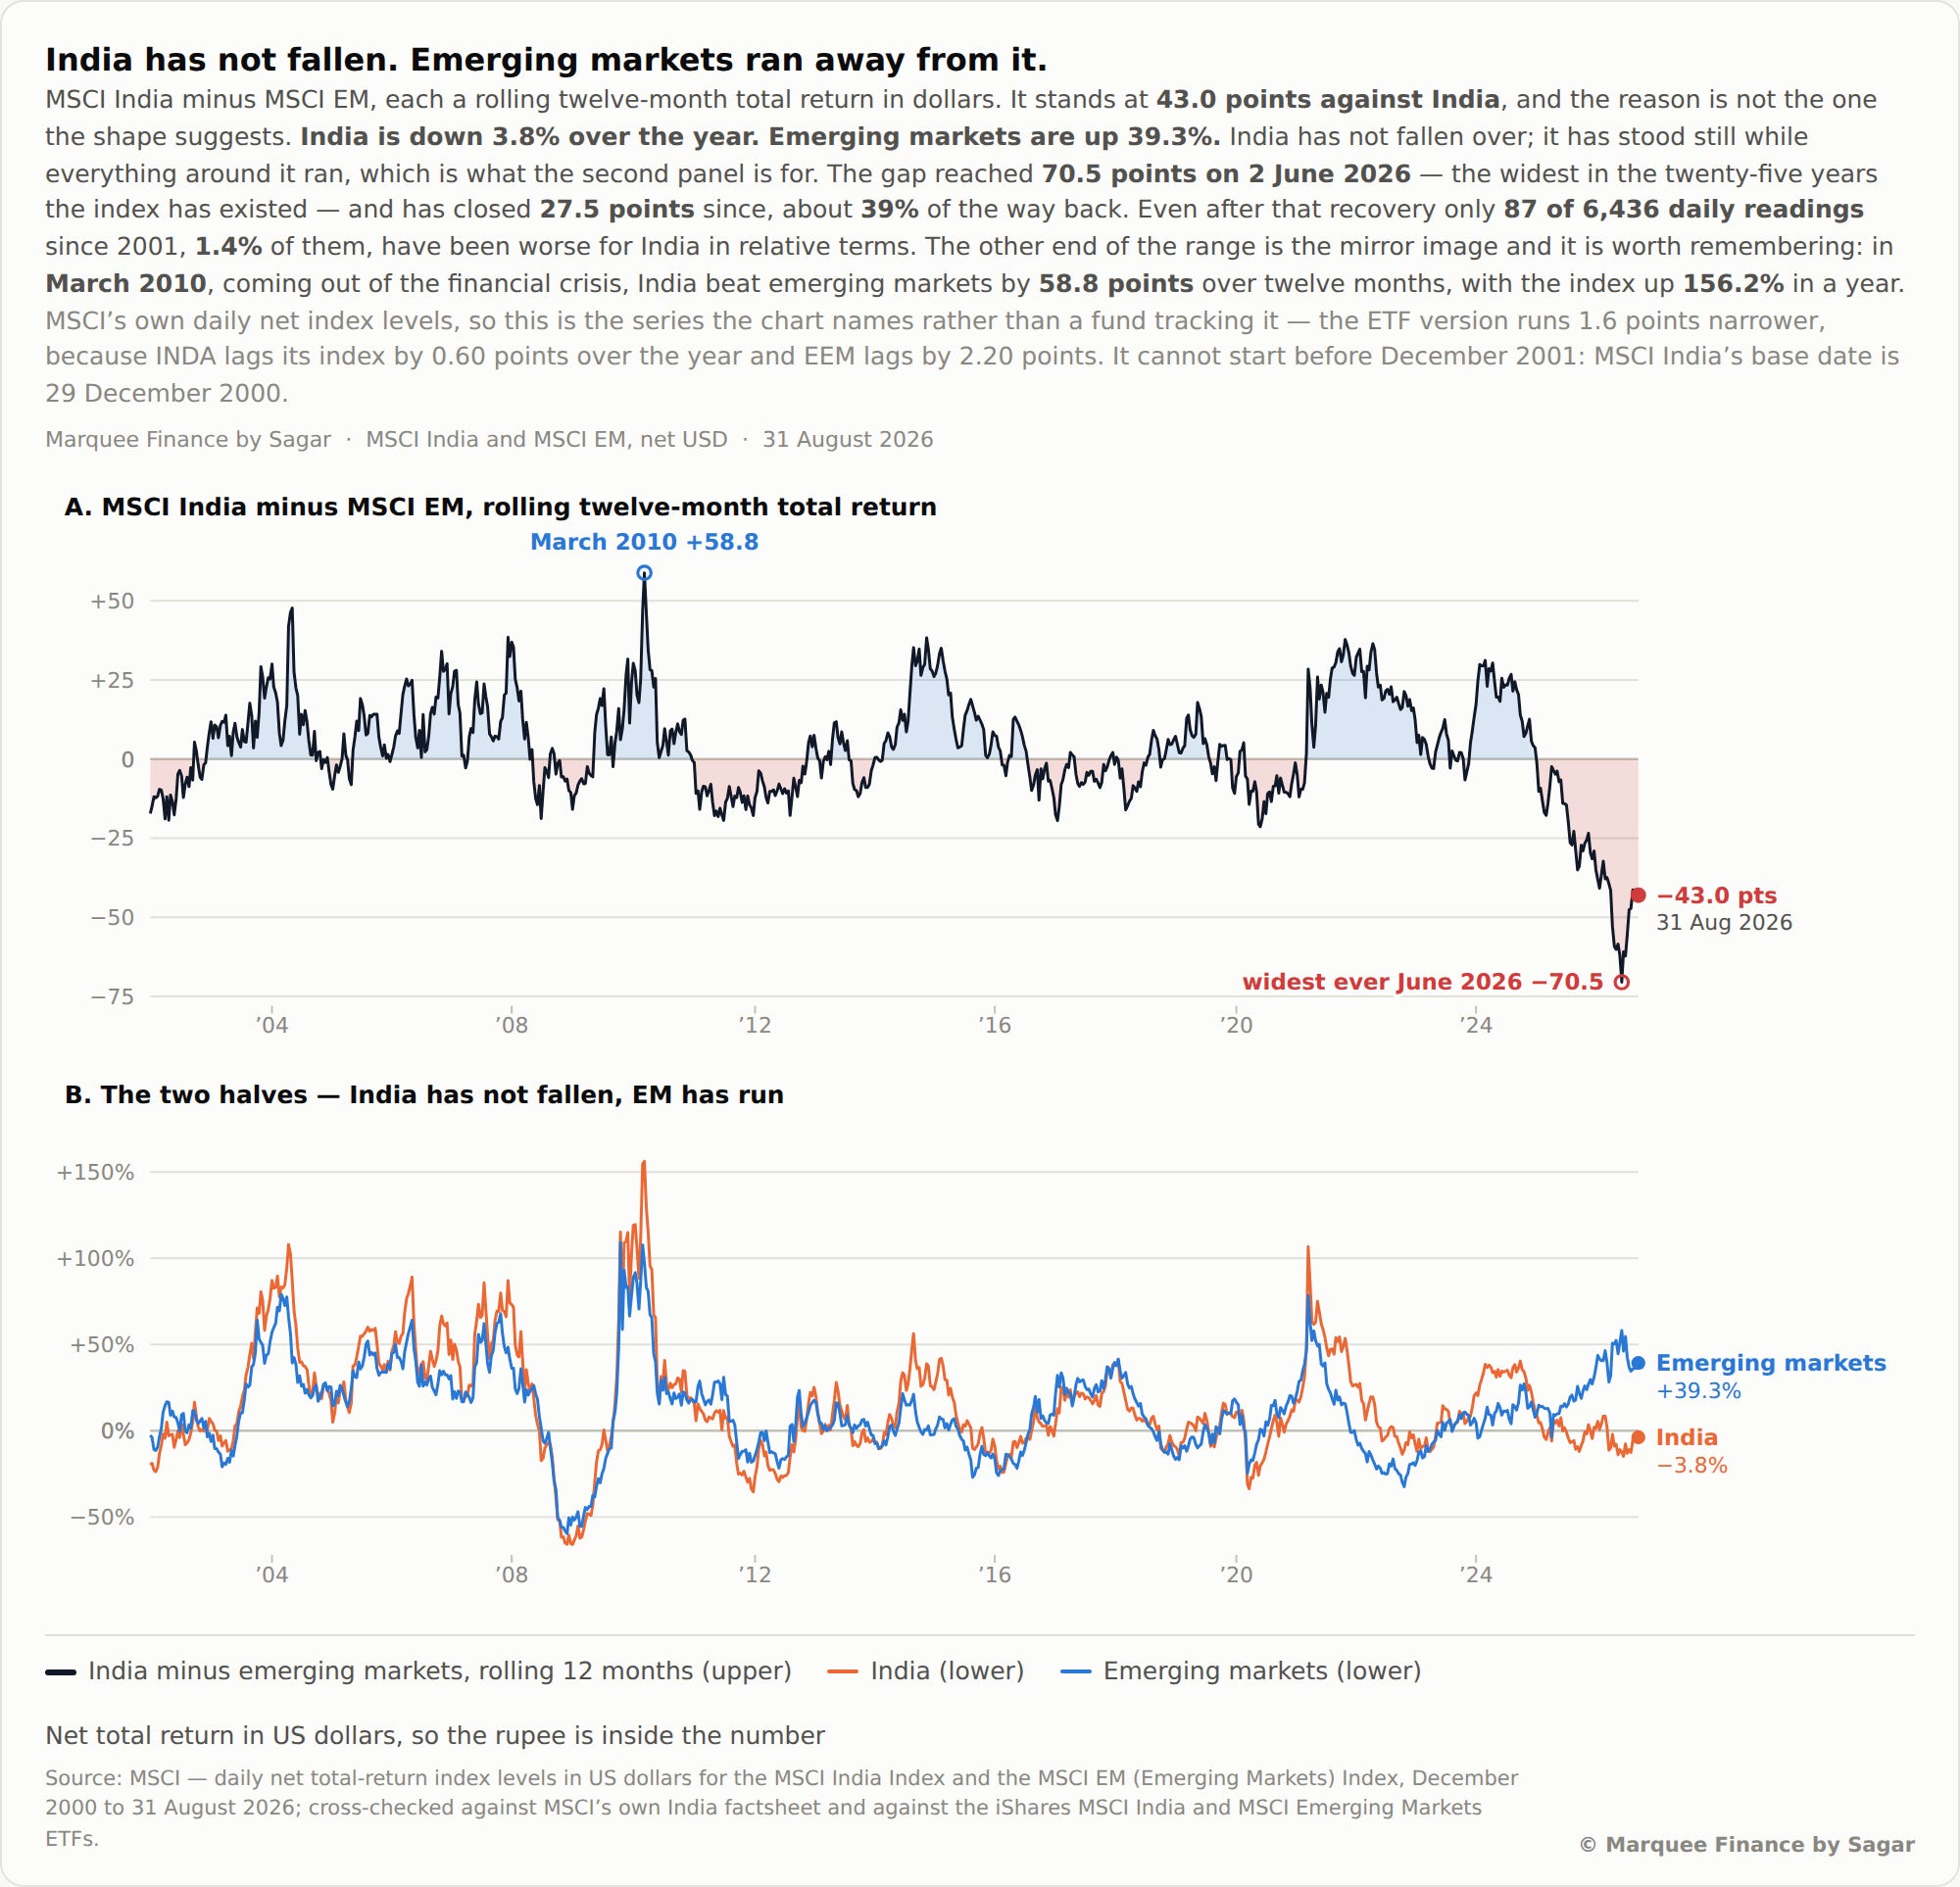
BONUS CHART: The darling of foreign investors: India has seen record derating. The MSCI India rolling 12-month return compared to MSCI EM fell to the lowest ever and, since the Korea bubble burst, has recovered.
Nonetheless, if you believe in mean reversion, then we might see India outperform MSCI EM once again in the coming months.
Disclaimer
This publication and its author are not licensed investment professionals. The author & any other individuals associated with this newsletter are NOT registered as Securities broker-dealers or financial investment advisors with the U.S. Securities and Exchange Commission, Commodity Futures Trading Commission, or any other securities/regulatory authority. Nothing produced under Marquee Finance by Sagar should be construed as investment advice. Do your research and consult with your certified financial planner or other dedicated professional before making any investment decisions. Investments carry risk and may lose value; Marquee Finance By Sagar LLC, Marqueefinancebysagar.substack.com or Sagar Singh Setia is not responsible for loss of value; all investment decisions you make are yours alone.