

Folks, this month, I have introduced a new edition: “Month In Charts”, where I will share with you the top charts from the prior month.
Let us look at what the internet was chatting about in February!
Are you ready?
Let’s Go!
#Chart No 1:
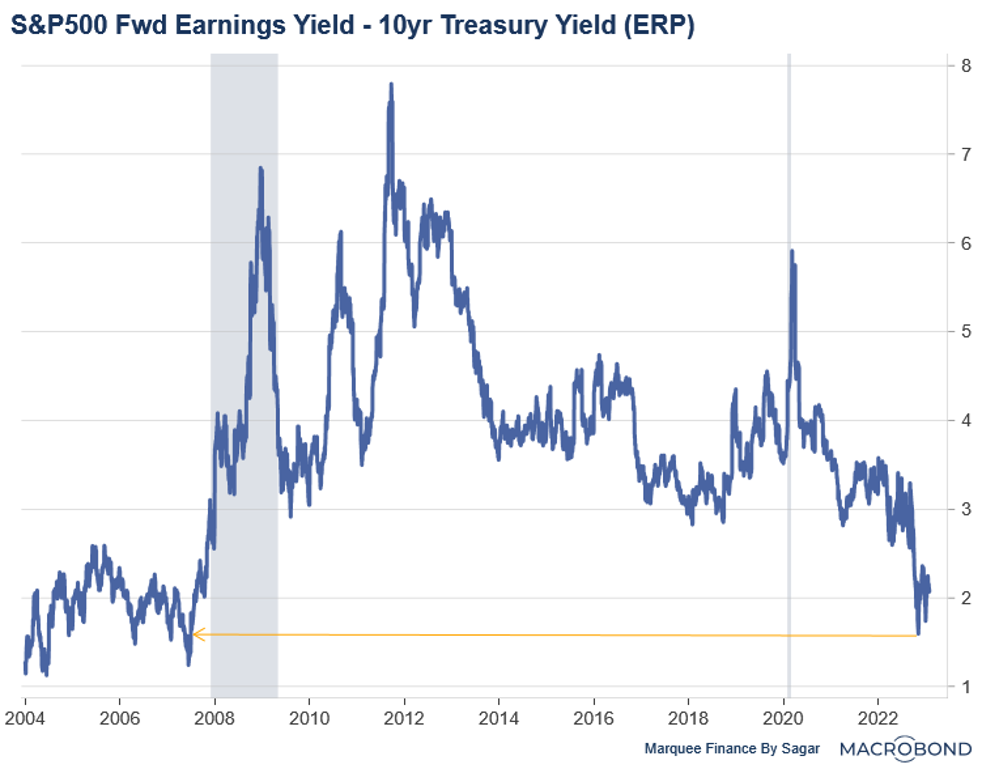
The talk of the town this month was the jaw-dropping fall in the equity risk premium.
As the yields spiked in the US, the return one is earning by investing in a “risky” asset (equities) rather than a “risk-free” asset plummeted to just 1.51%/ 151 bps.
#Chart No 2:
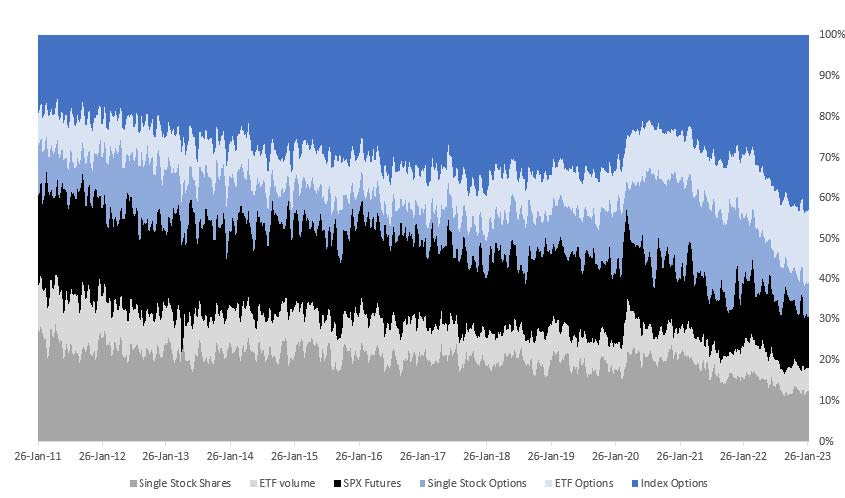
Ten years ago, it was all about equities, cash and futures, and now it's all about 0DTE (options). In a baffling development, options now contribute around 70% of the notional value of equity traded daily vs 40% a decade ago!
#Chart No 3:
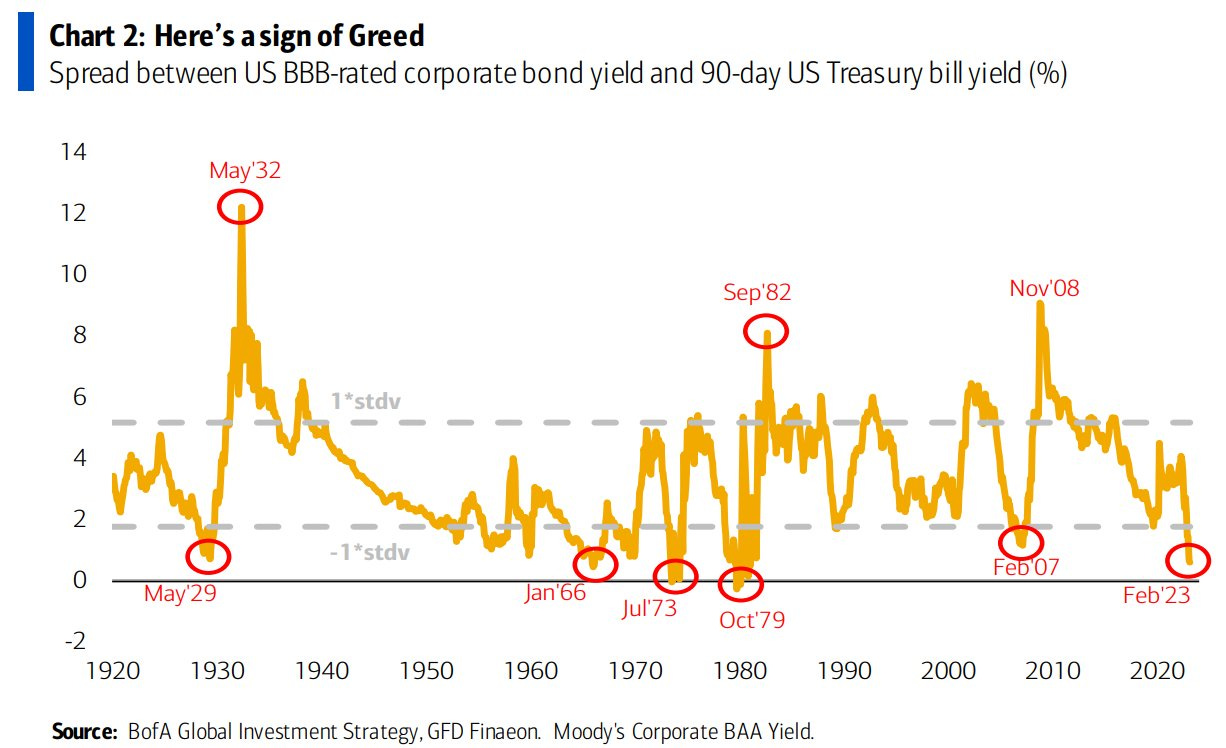
Not only did equity risk premium crash, but the market rhetoric of soft landing made corporate credit too expensive.
As a result, the spread between Investment Grade BBB-rated corporate bond yield and the three-month T-Bill was within the touching distance of 0!
#Chart No 4:
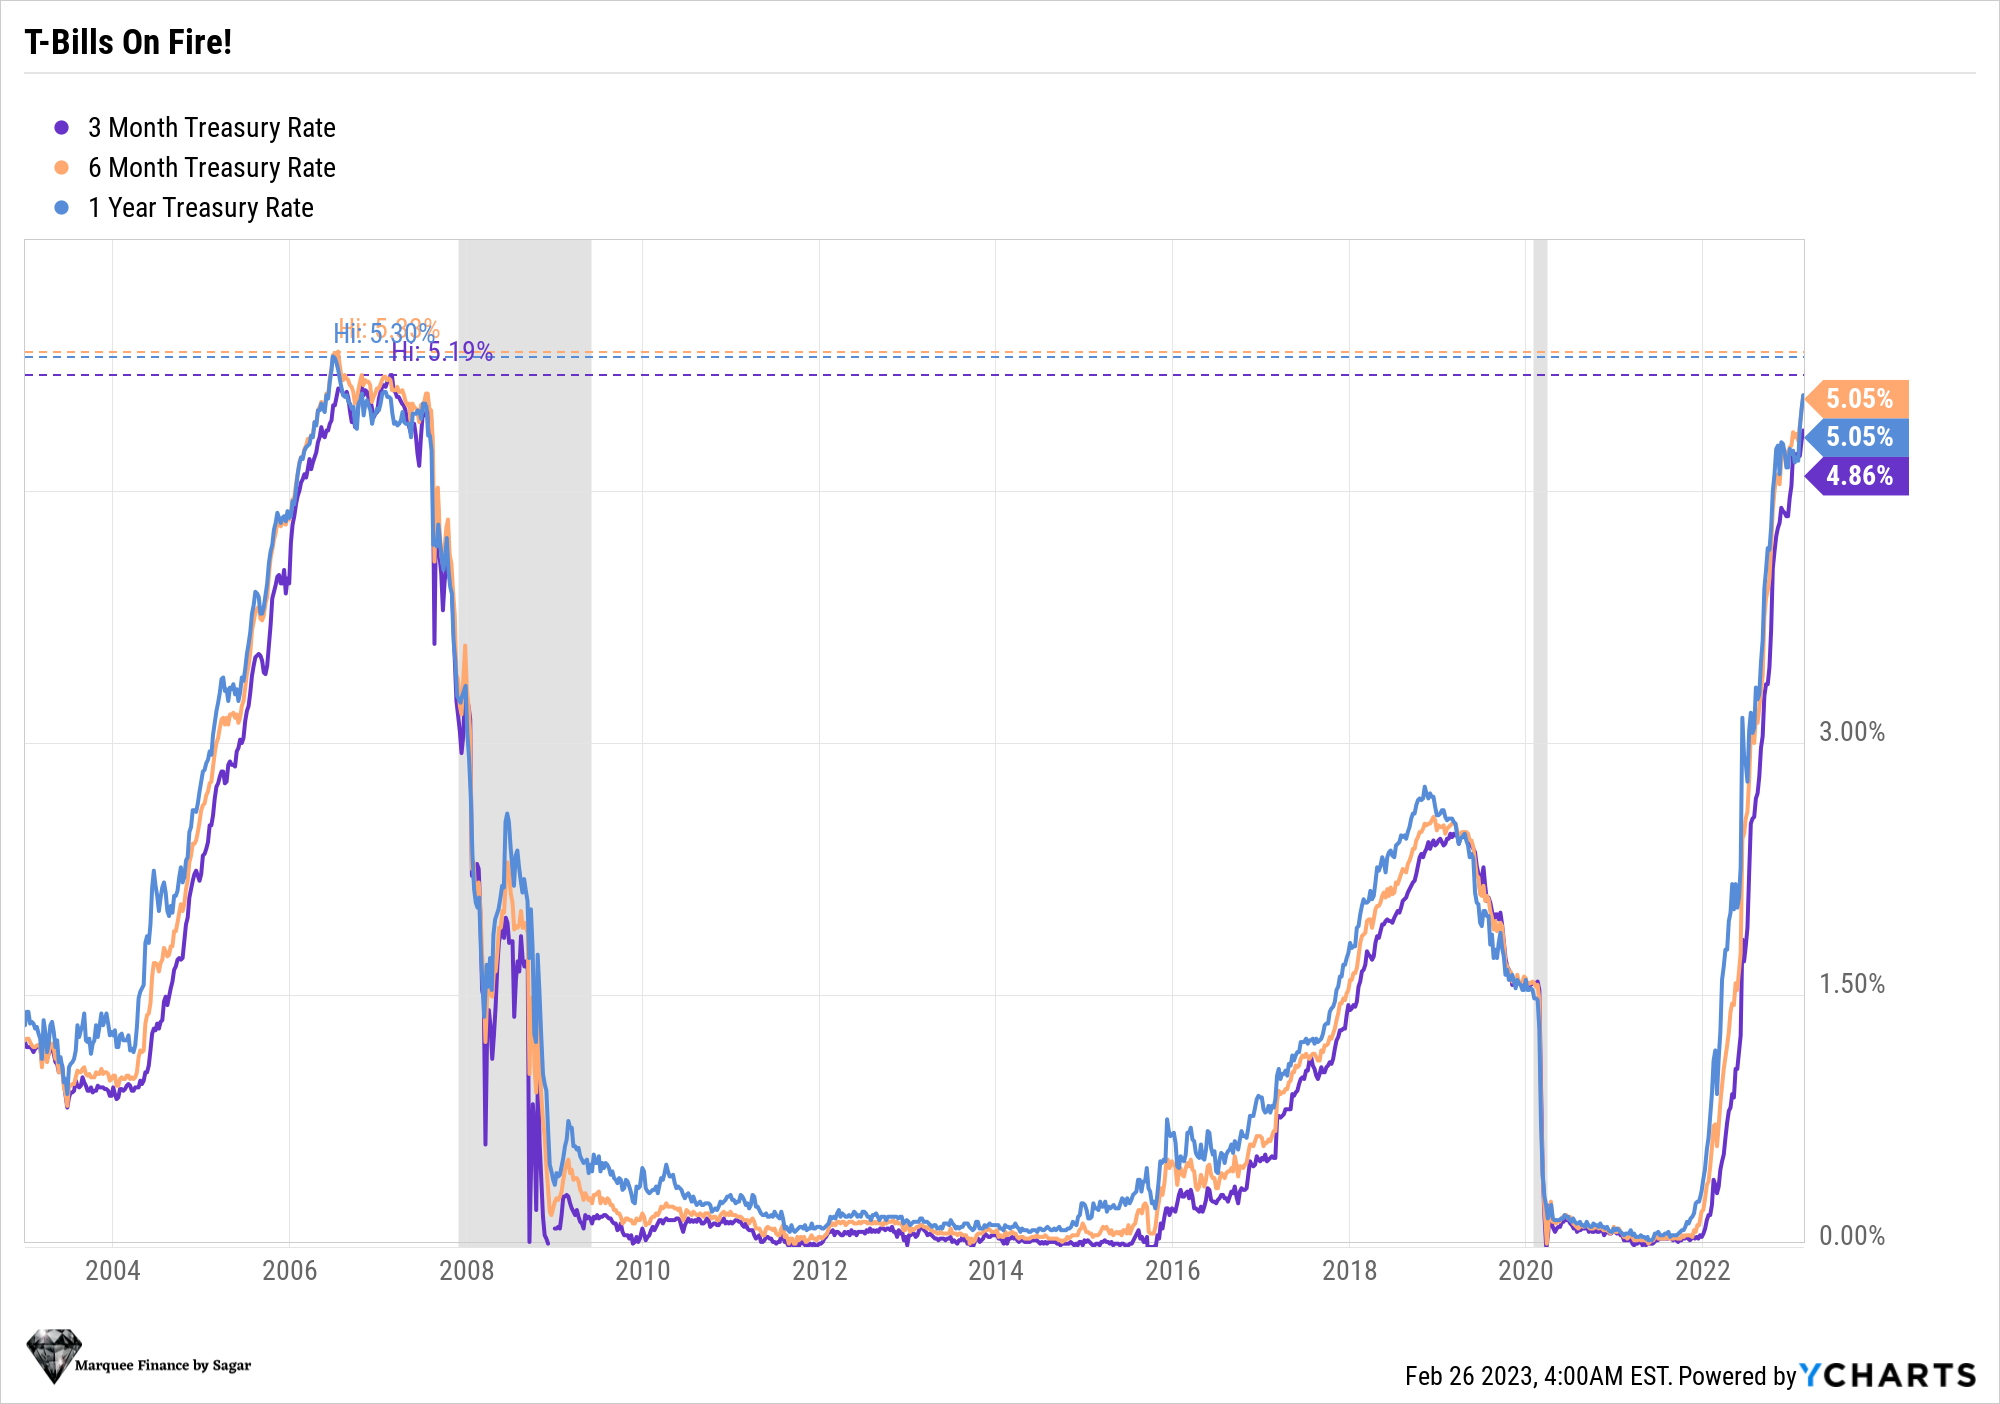
As the markets priced the terminal rate higher by around 50 bps from 4.84% to about 5.3%, the short end of the curve was on fire in February.
#Chart No 5
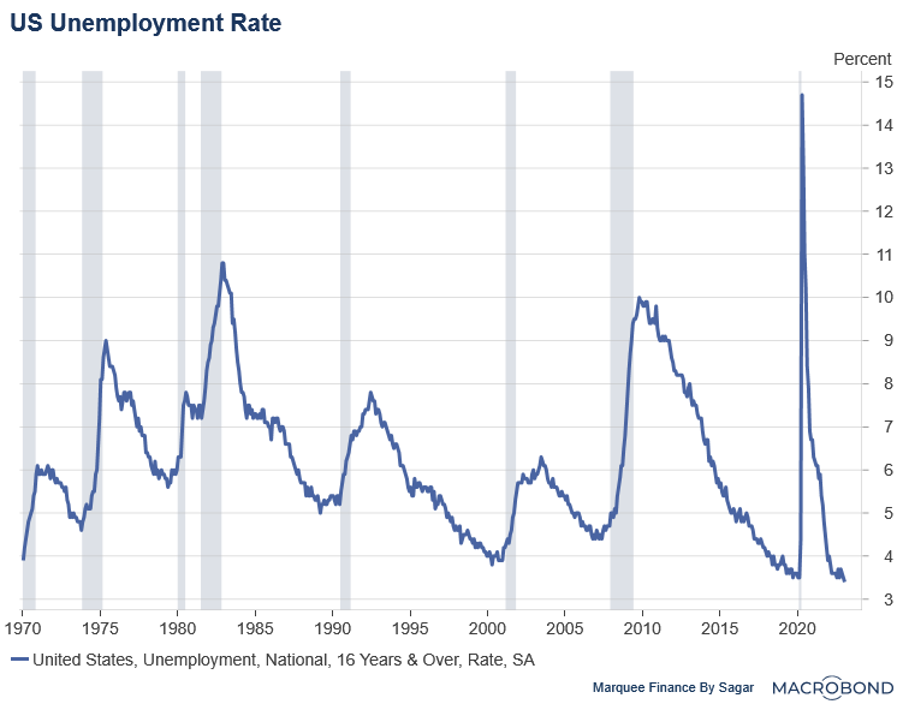
The reason markets repriced the terminal rate was a rude shock in the economic data releases. The biggest stunner was the lowest unemployment rate since the 1960s.
#Chart No 6:
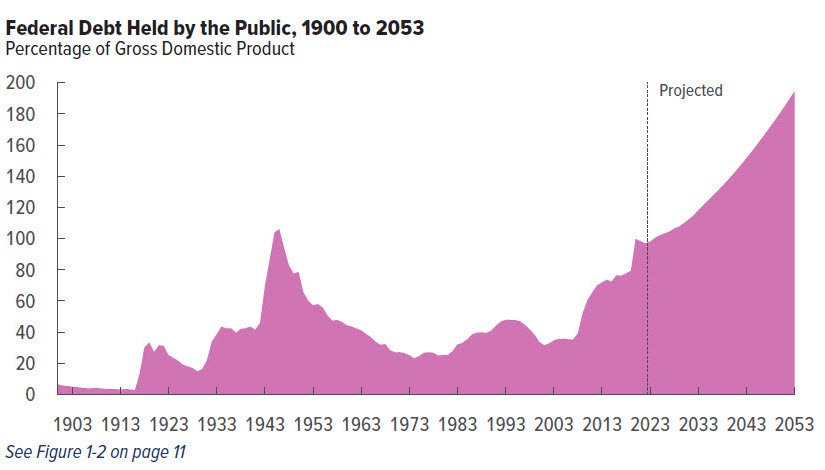
The most viral chart of the month was this incredible chart from the Treasury Department in the US.
While Japan’s Public Debt/GDP is 250%, the US will reach 200% by 2053, as per the official government handle.
The astounding revelation is that American Households (HH) will own the bulk of the debt!
#Chart No 7:
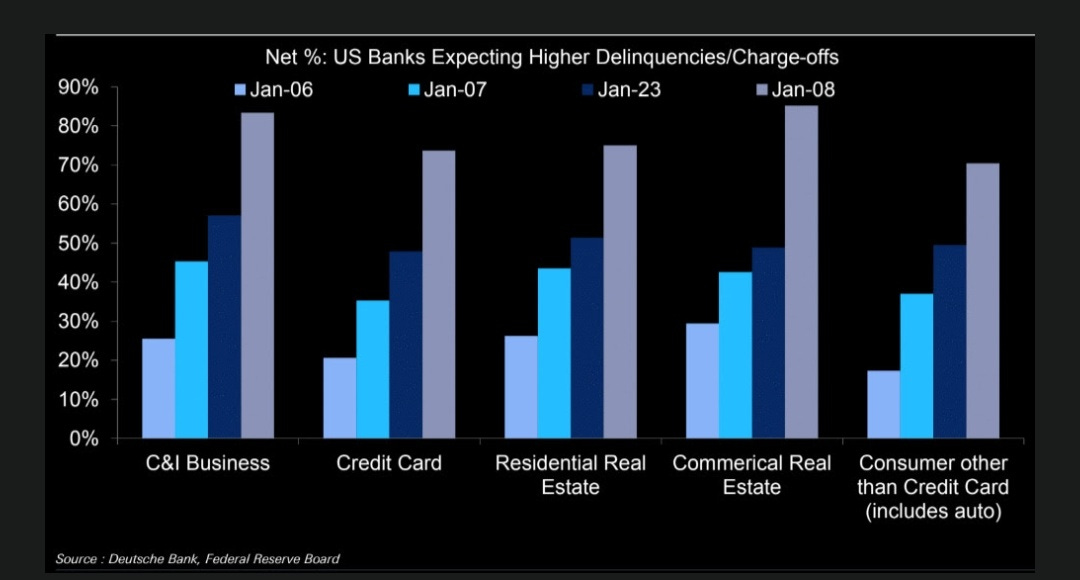
As the transmission of record tightening of monetary policy takes place, as per Deutsche Bank, the US banks are gearing up for the biggest increase in delinquency rates since the 2008 Great Financial Crisis.
Look out for private credit, commercial real estate, auto, and credit card loans.
Early signs of stress are visible all over.
#Chart No 8:
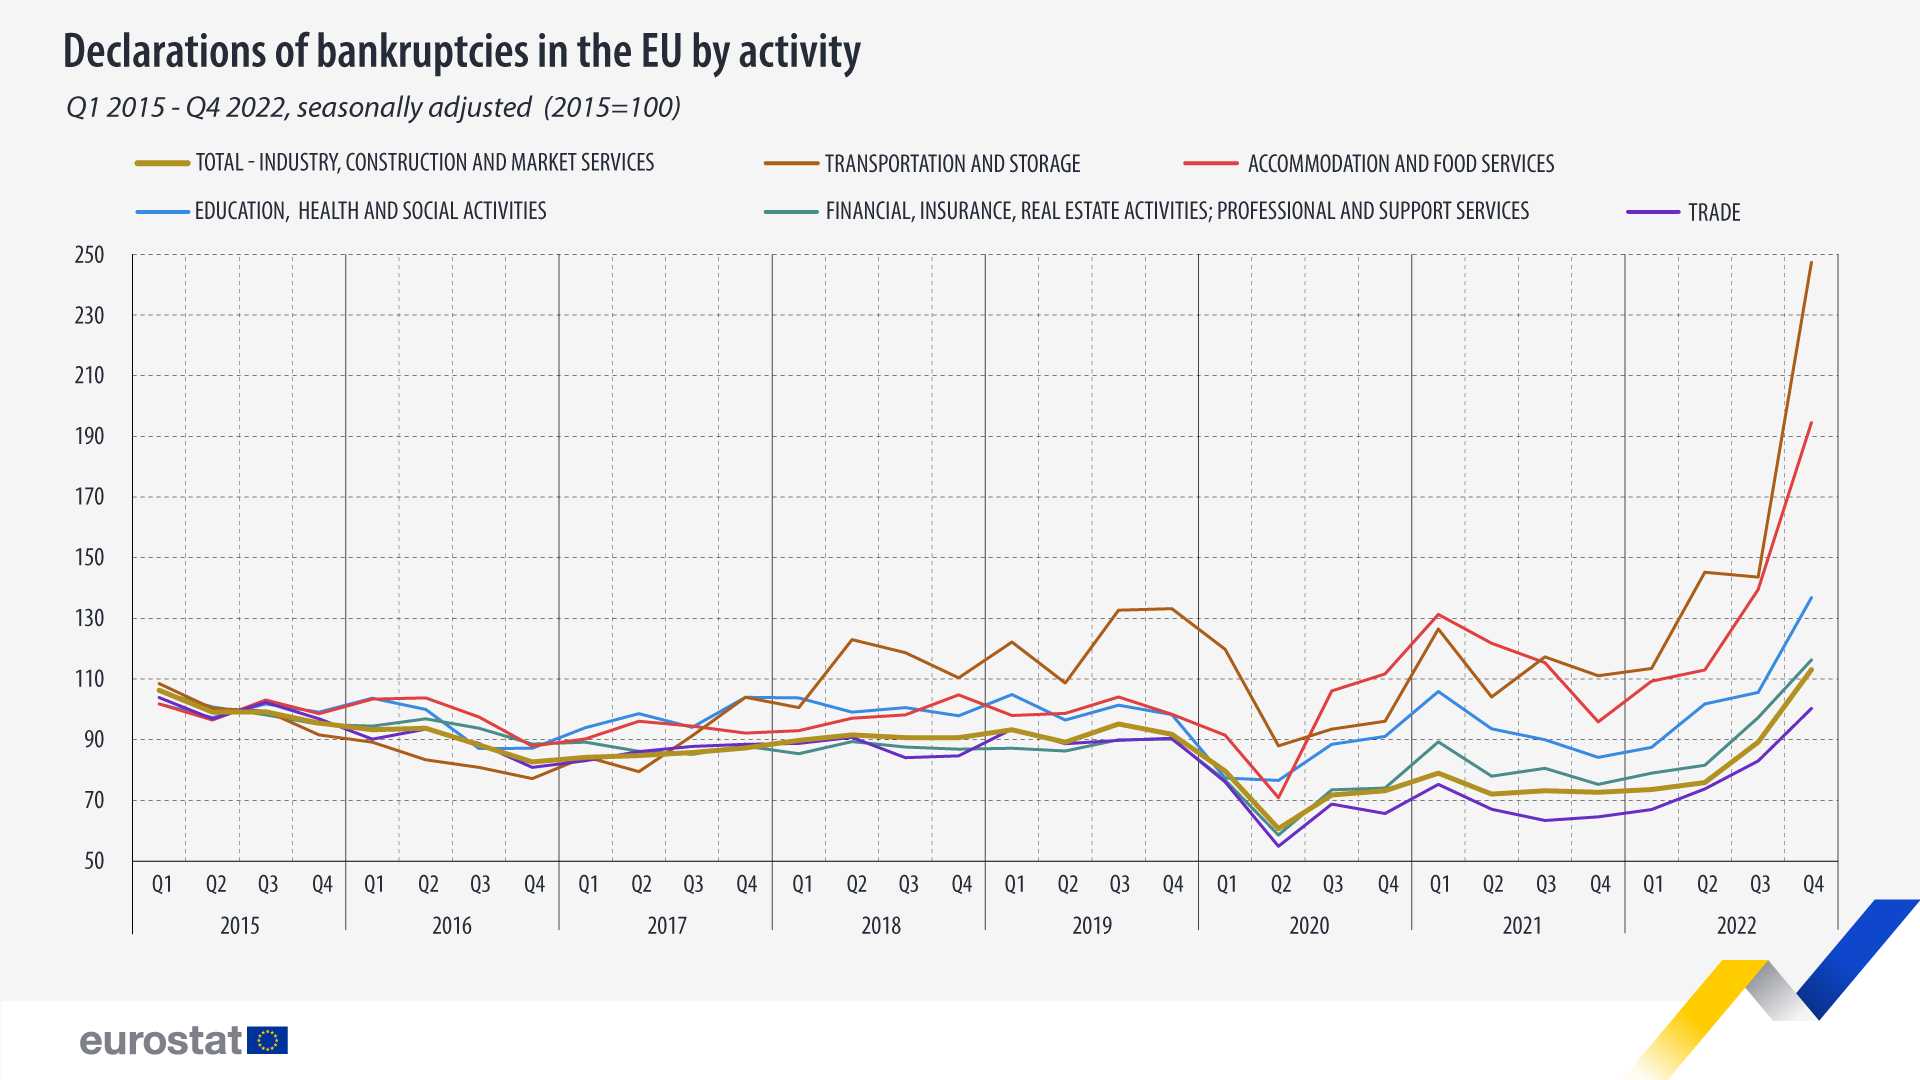
Small businesses witnessed carnage due to the last year’s energy crisis in Europe.
Furthermore, rising wages and interest rates made it unsustainable to run a business.
The result is an enormous spike in bankruptcies.
#Chart No 9:
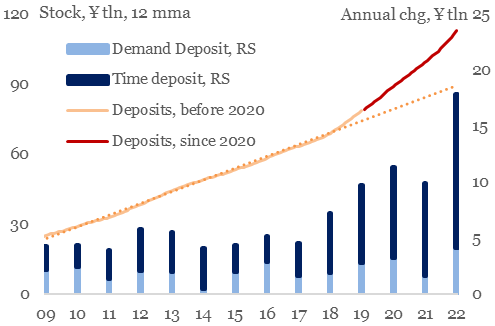
You can’t miss the Chinese reopening story as we move to the East.
Multiple years of lockdown have resulted in tremendous savings by Chinese households.
Look at yourself!
#Chart No 10:
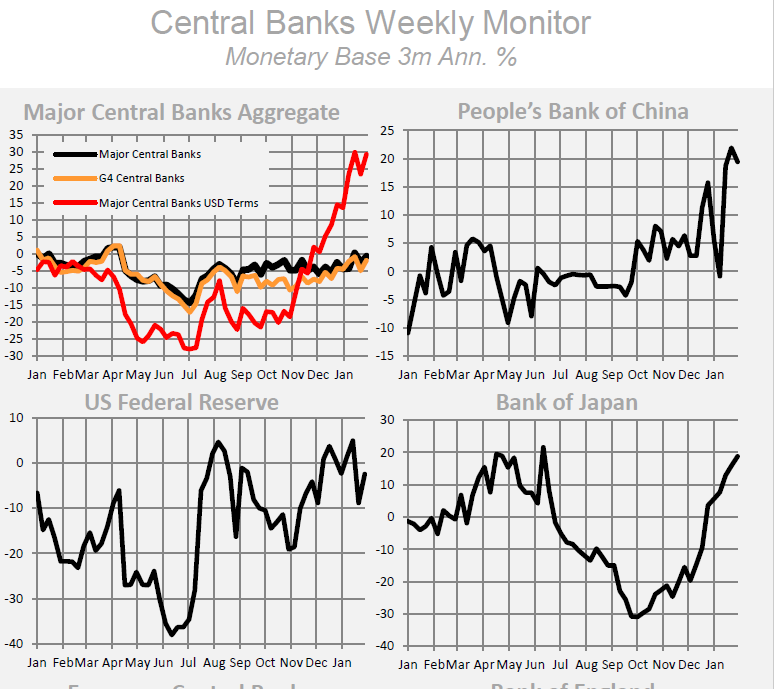
While the West tapers off the liquidity via QT, the East continues to pump in as BoJ and PBoC increase their balance sheet and money supply—a beautiful chart by Cross Border Capital.
#Chart No 11:
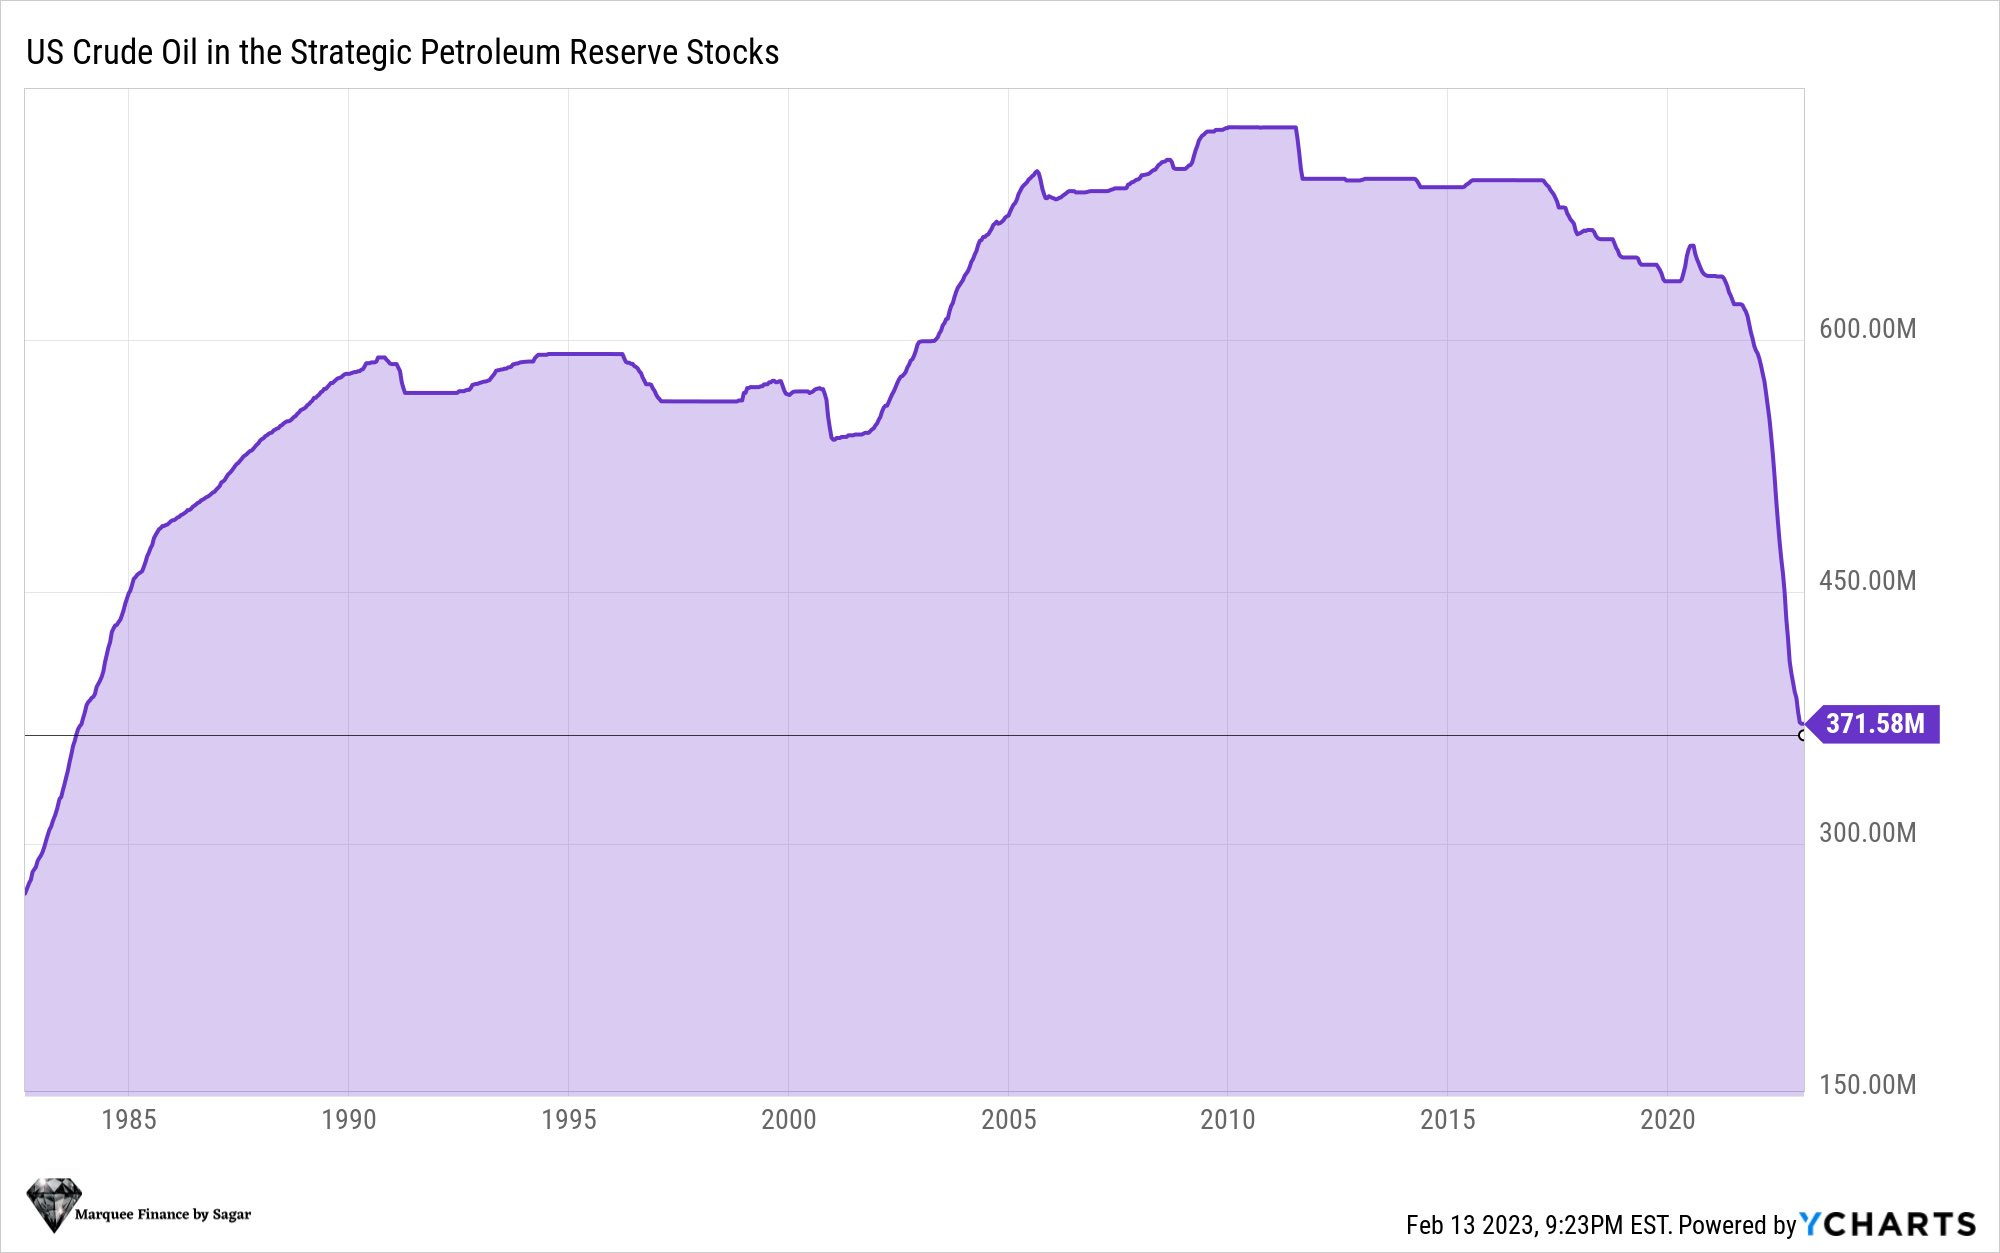
The energy world was abuzz with the further release in the Strategic Petroleum Reserve (SPR) by the Biden Administration as Russia voluntarily cut output by 500k bpd.
As a result, SPR is now the lowest since November 1983!
#Chart No 12:
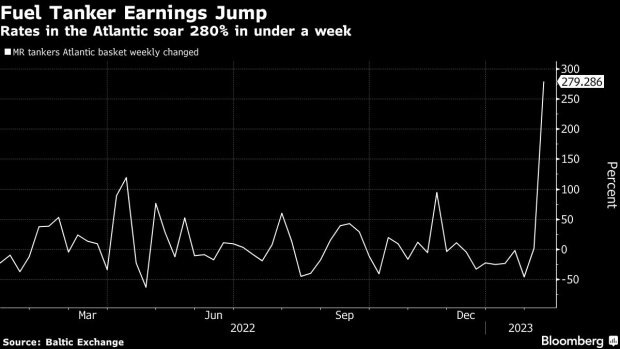
As the EU’s embargo of refined products kicked in on 5th February, the fuel tanker rates in Atlantic soared by a whopping 280% in just a week!
#Chart No 13:
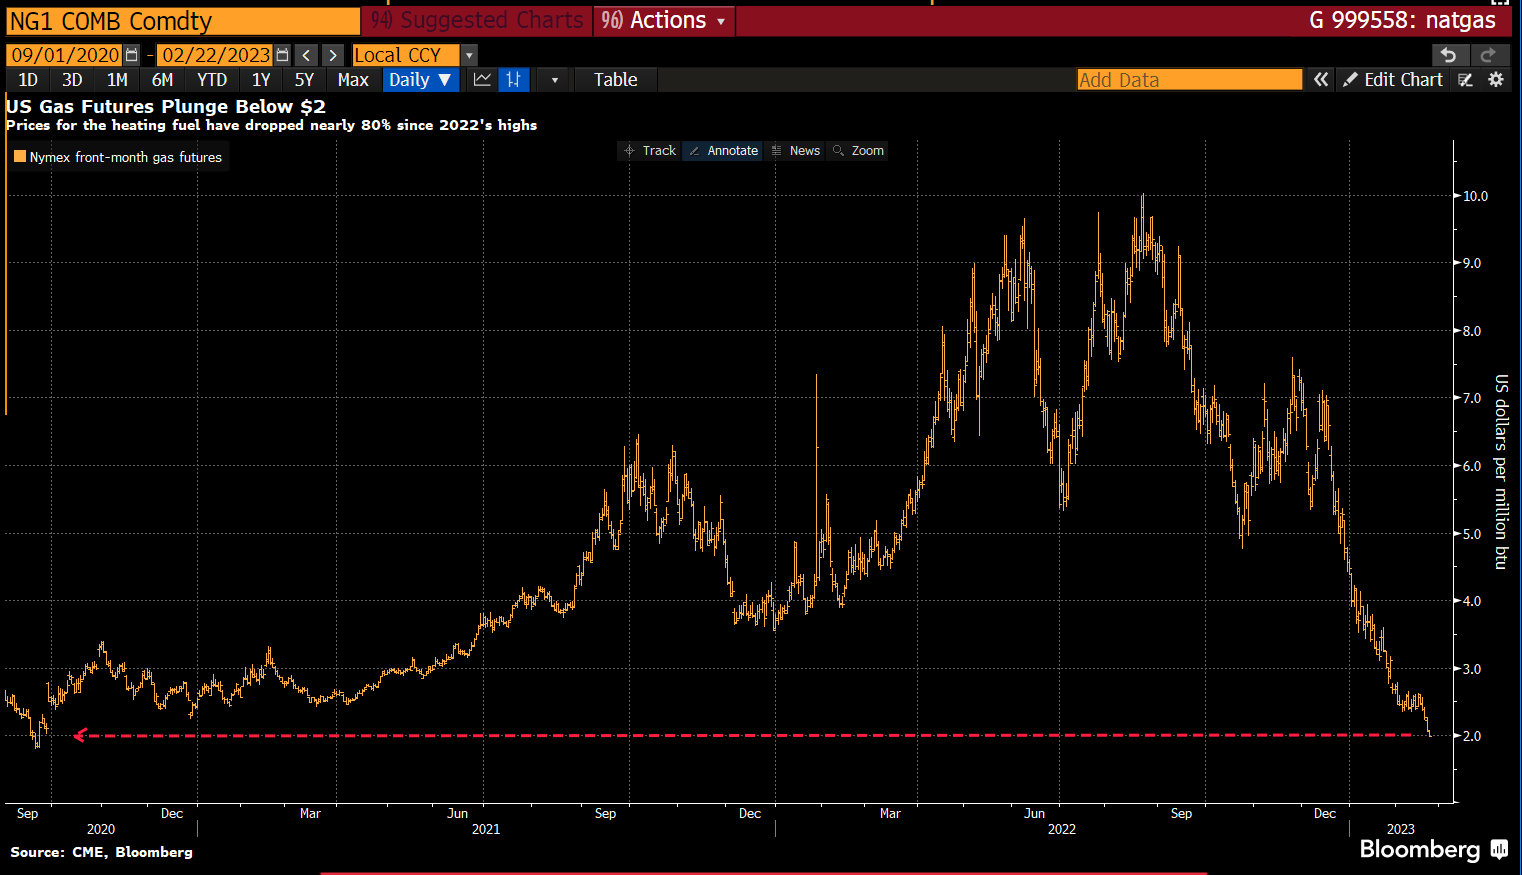
Natural Gas prices in the US (Henry Hub) plunged to the levels last seen in September 2020!
Is a likely bottom in place?
#Chart No 14:
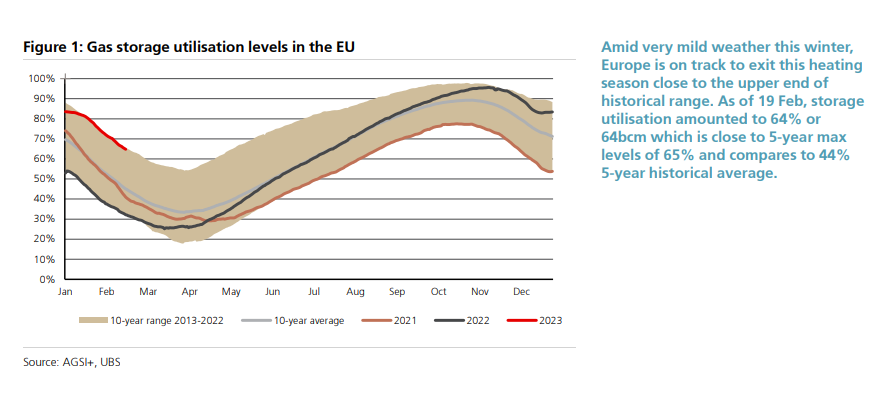
As weather gods showered their blessings on Europe with a warmer winter, the Gas Storage Utilisation levels were at the 5-year maximum level of 64%.
It looks like Europe is out of the woods for now, but a warmer summer can play the spoilsport.
That’s all for today, folks!
See you on Friday/Saturday! :)
Disclaimer
This publication and its author is not licensed investment professional. Nothing produced under Marquee Finance by Sagar should be construed as investment advice. Do your own research and contact your financial advisor before making investment decisions.