

The first half of 2025 was a rollercoaster ride marked by heart-wrenching volatility, as trade policy-related uncertainty reached unprecedented heights.
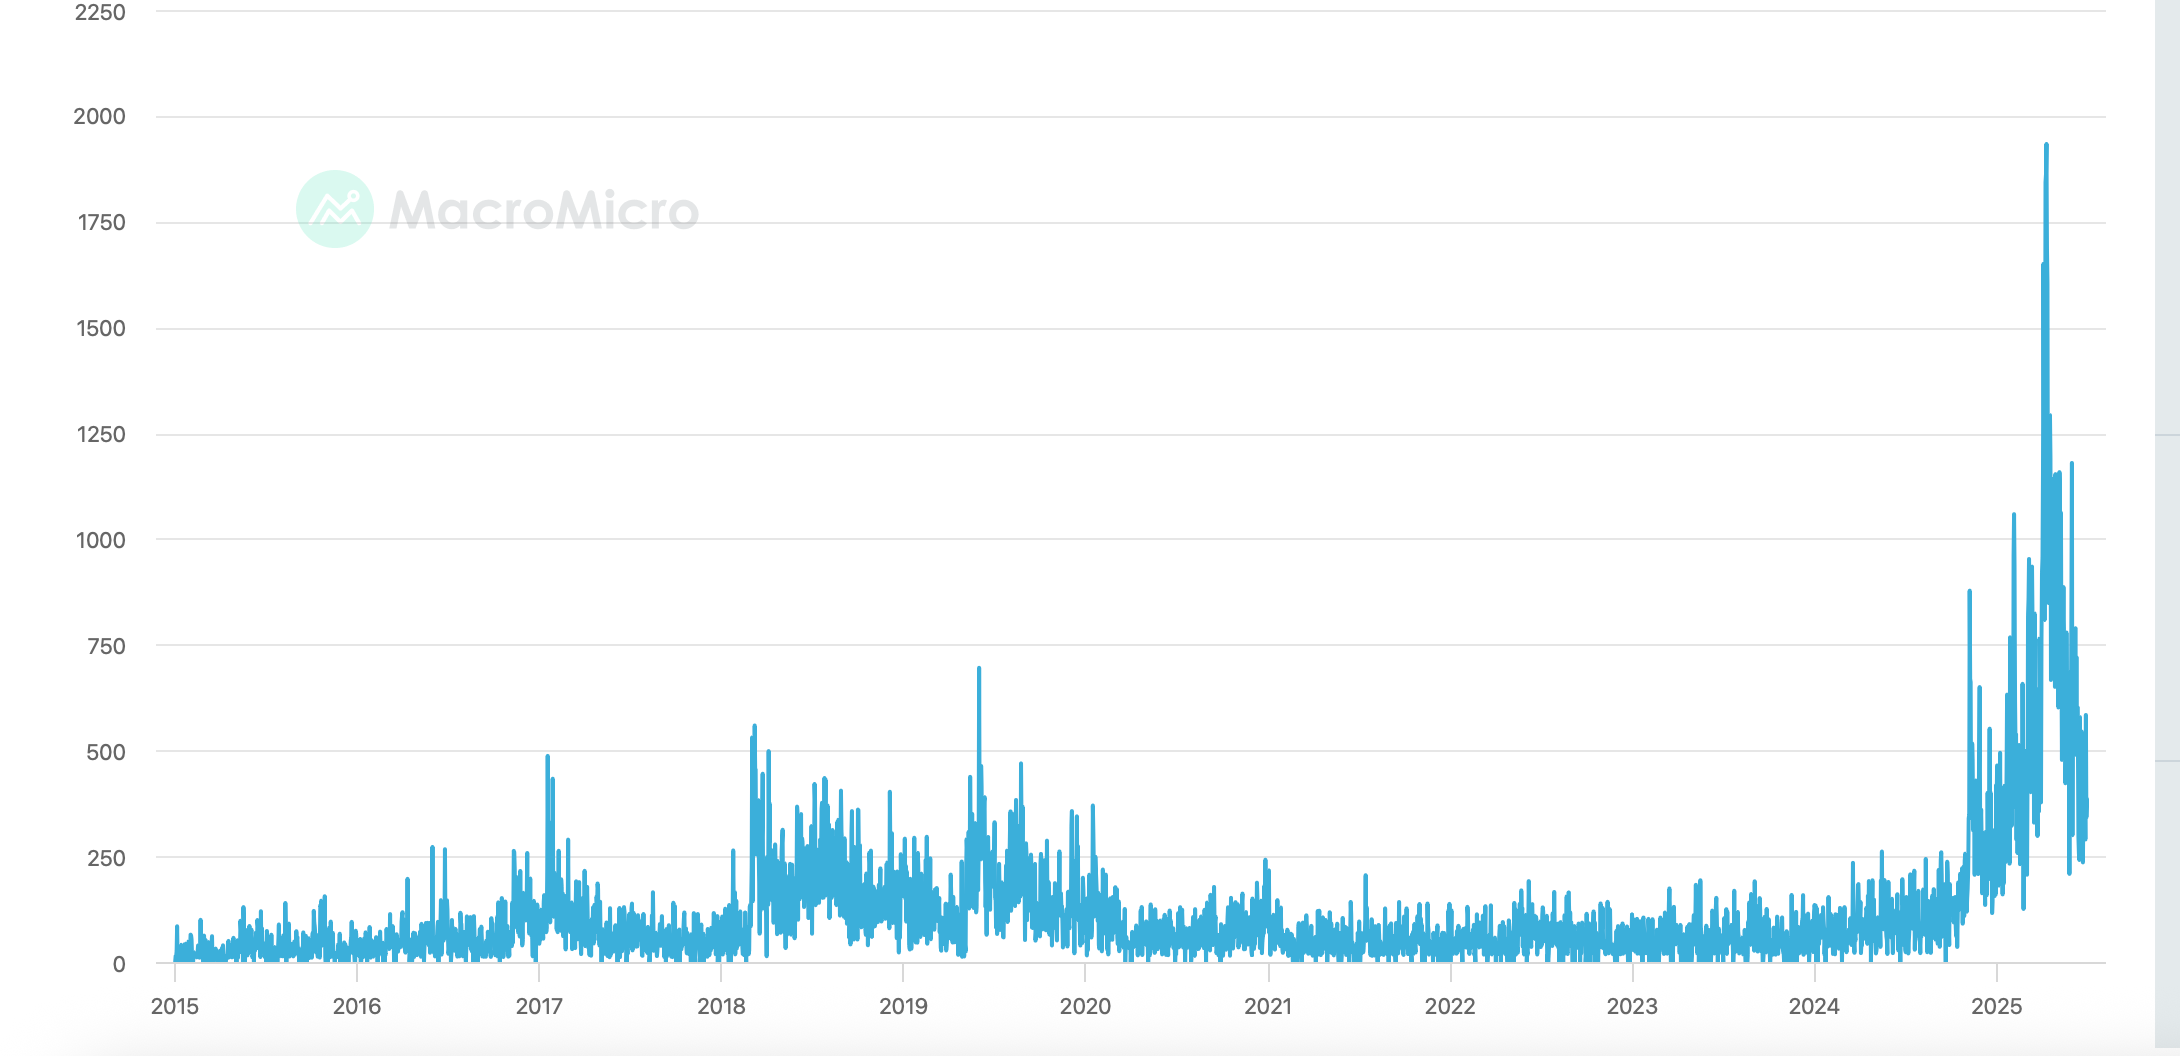
Furthermore, geopolitical tensions soared as the world reached the brink of a potential “World War 3” with two of the world's most powerful countries in the Middle East fighting for 12 days.
Let’s comprehend what transpired in global financial markets and the macroeconomic universe in H12025.
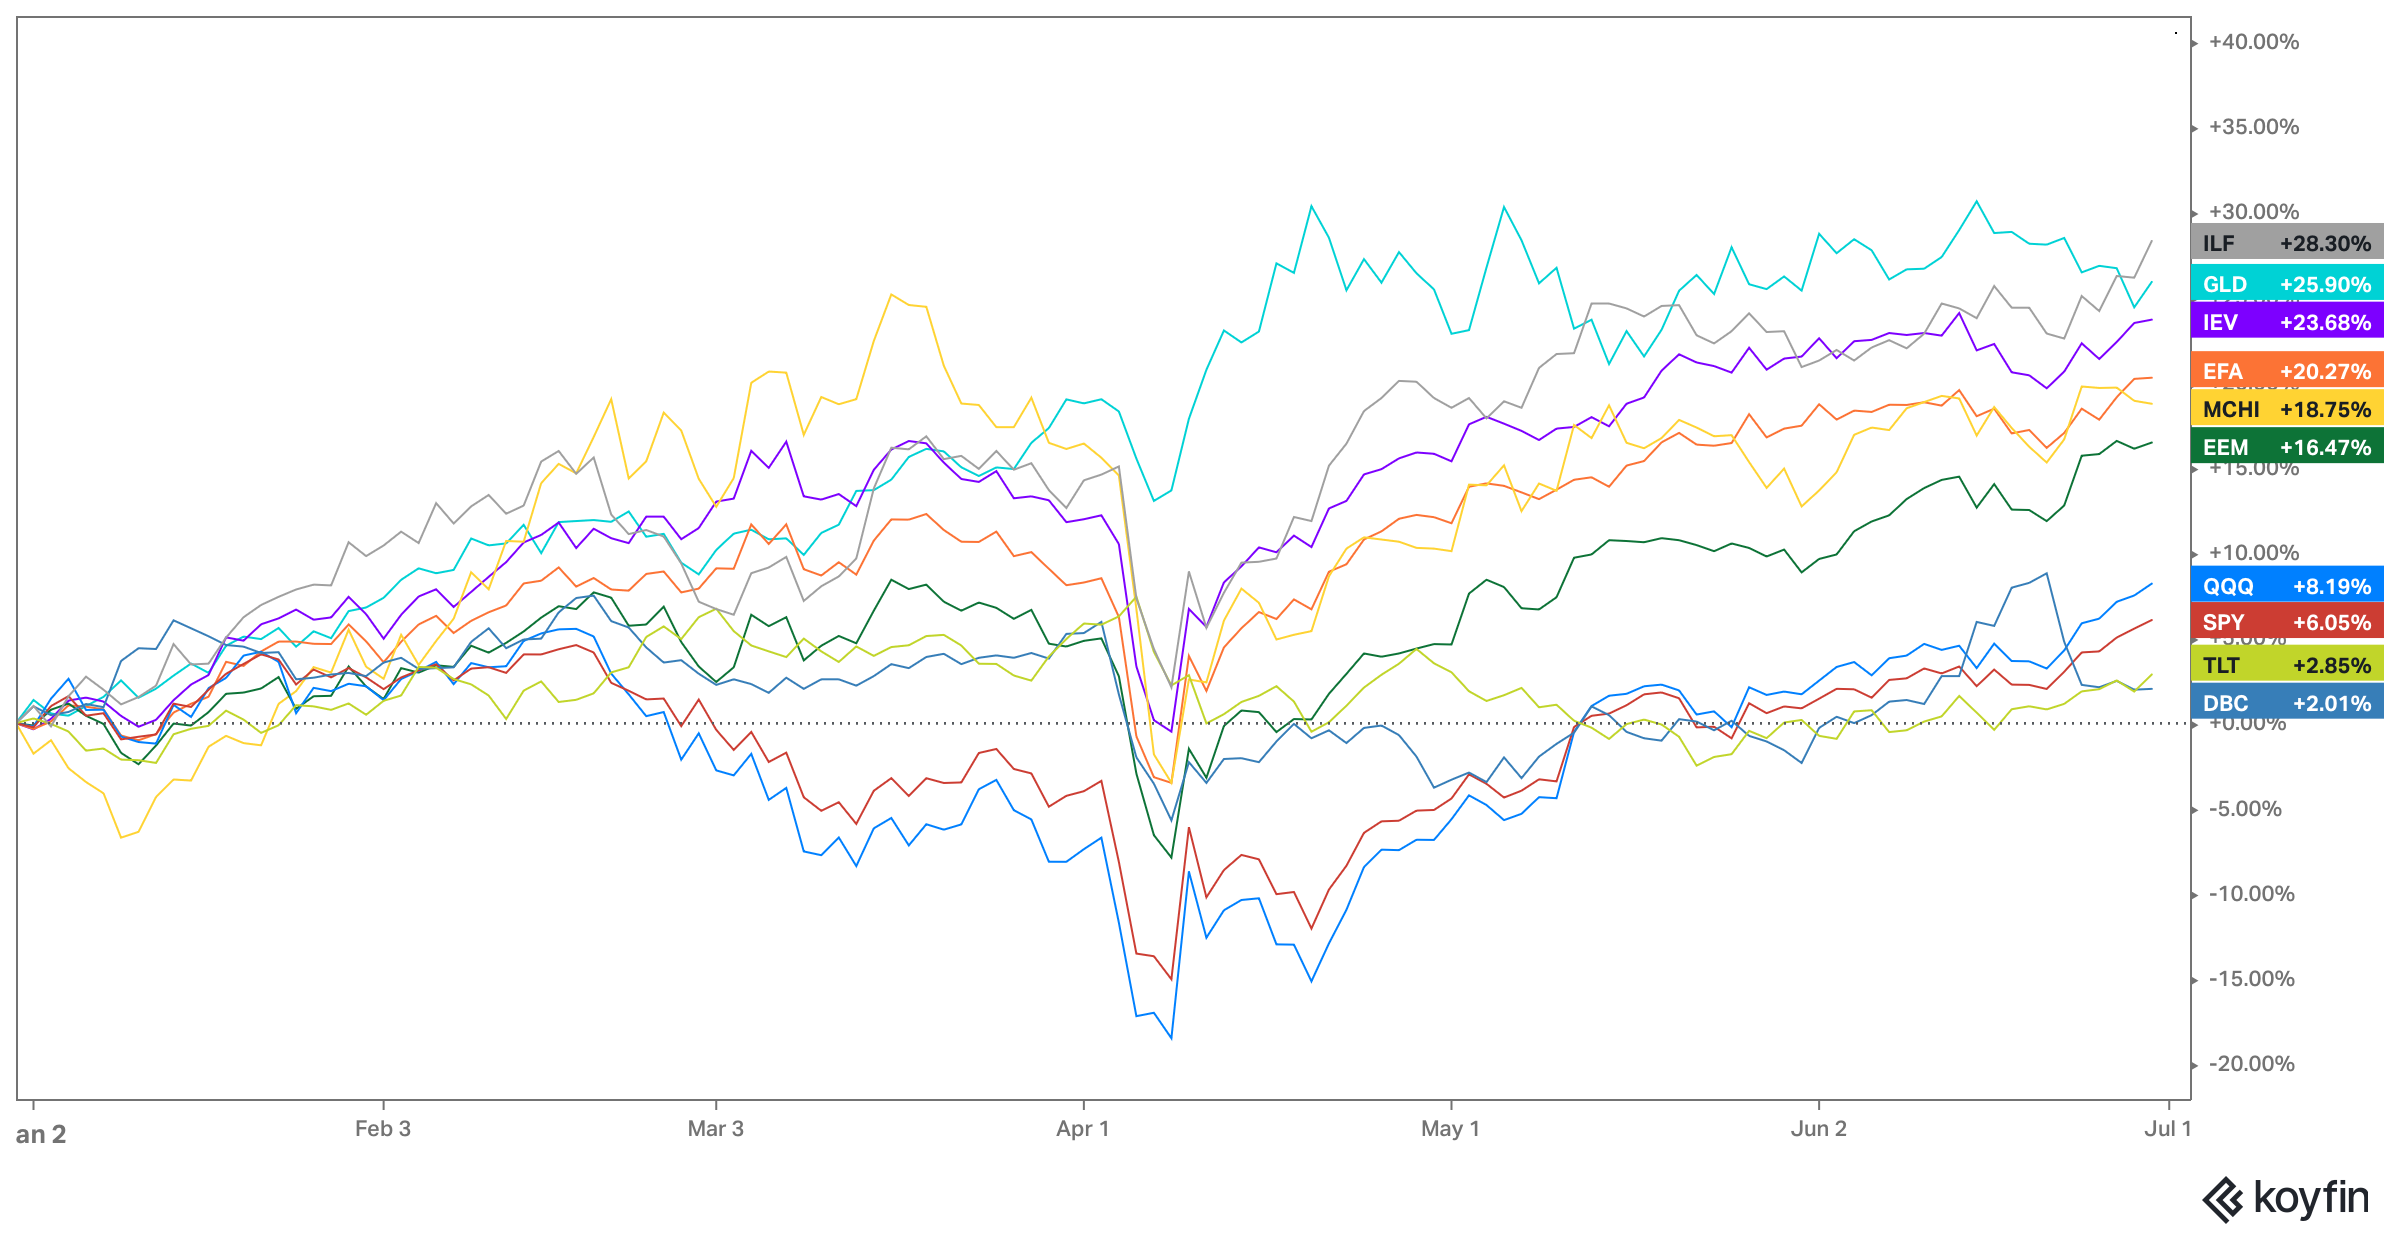
As fiscal policy apprehensions rose and uncertainty skyrocketed, Gold was one of the best-performing assets, with a remarkable 26% return in H1.
On the equity front, as the DXY plummeted, the unhedged ETFs delivered a stellar return, led by the flagship Latin American ETF, ILF, which was up nearly 28% in H1.
While Europe, China and other EMs had one of the best H1s with more than 18-24% returns, the US benchmark indices underperformed with SPY up by a meagre 6%.
Bonds remained laggards, with the long-duration ETF TLT up by just 2.85%.

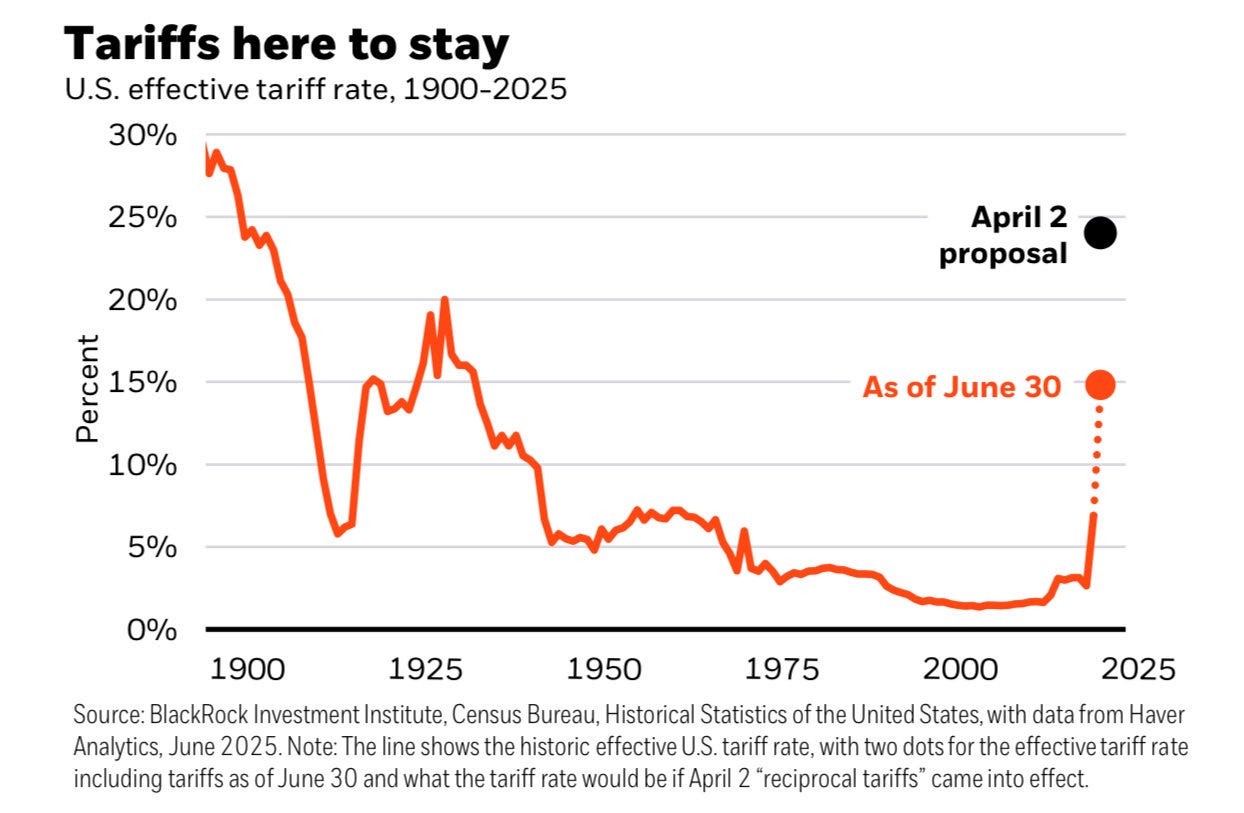
As we approach the 90-day deadline set by POTUS, even without the April 2 reciprocal tariffs proposal, the US effective tariff rate has risen to its highest levels since the 1920s.

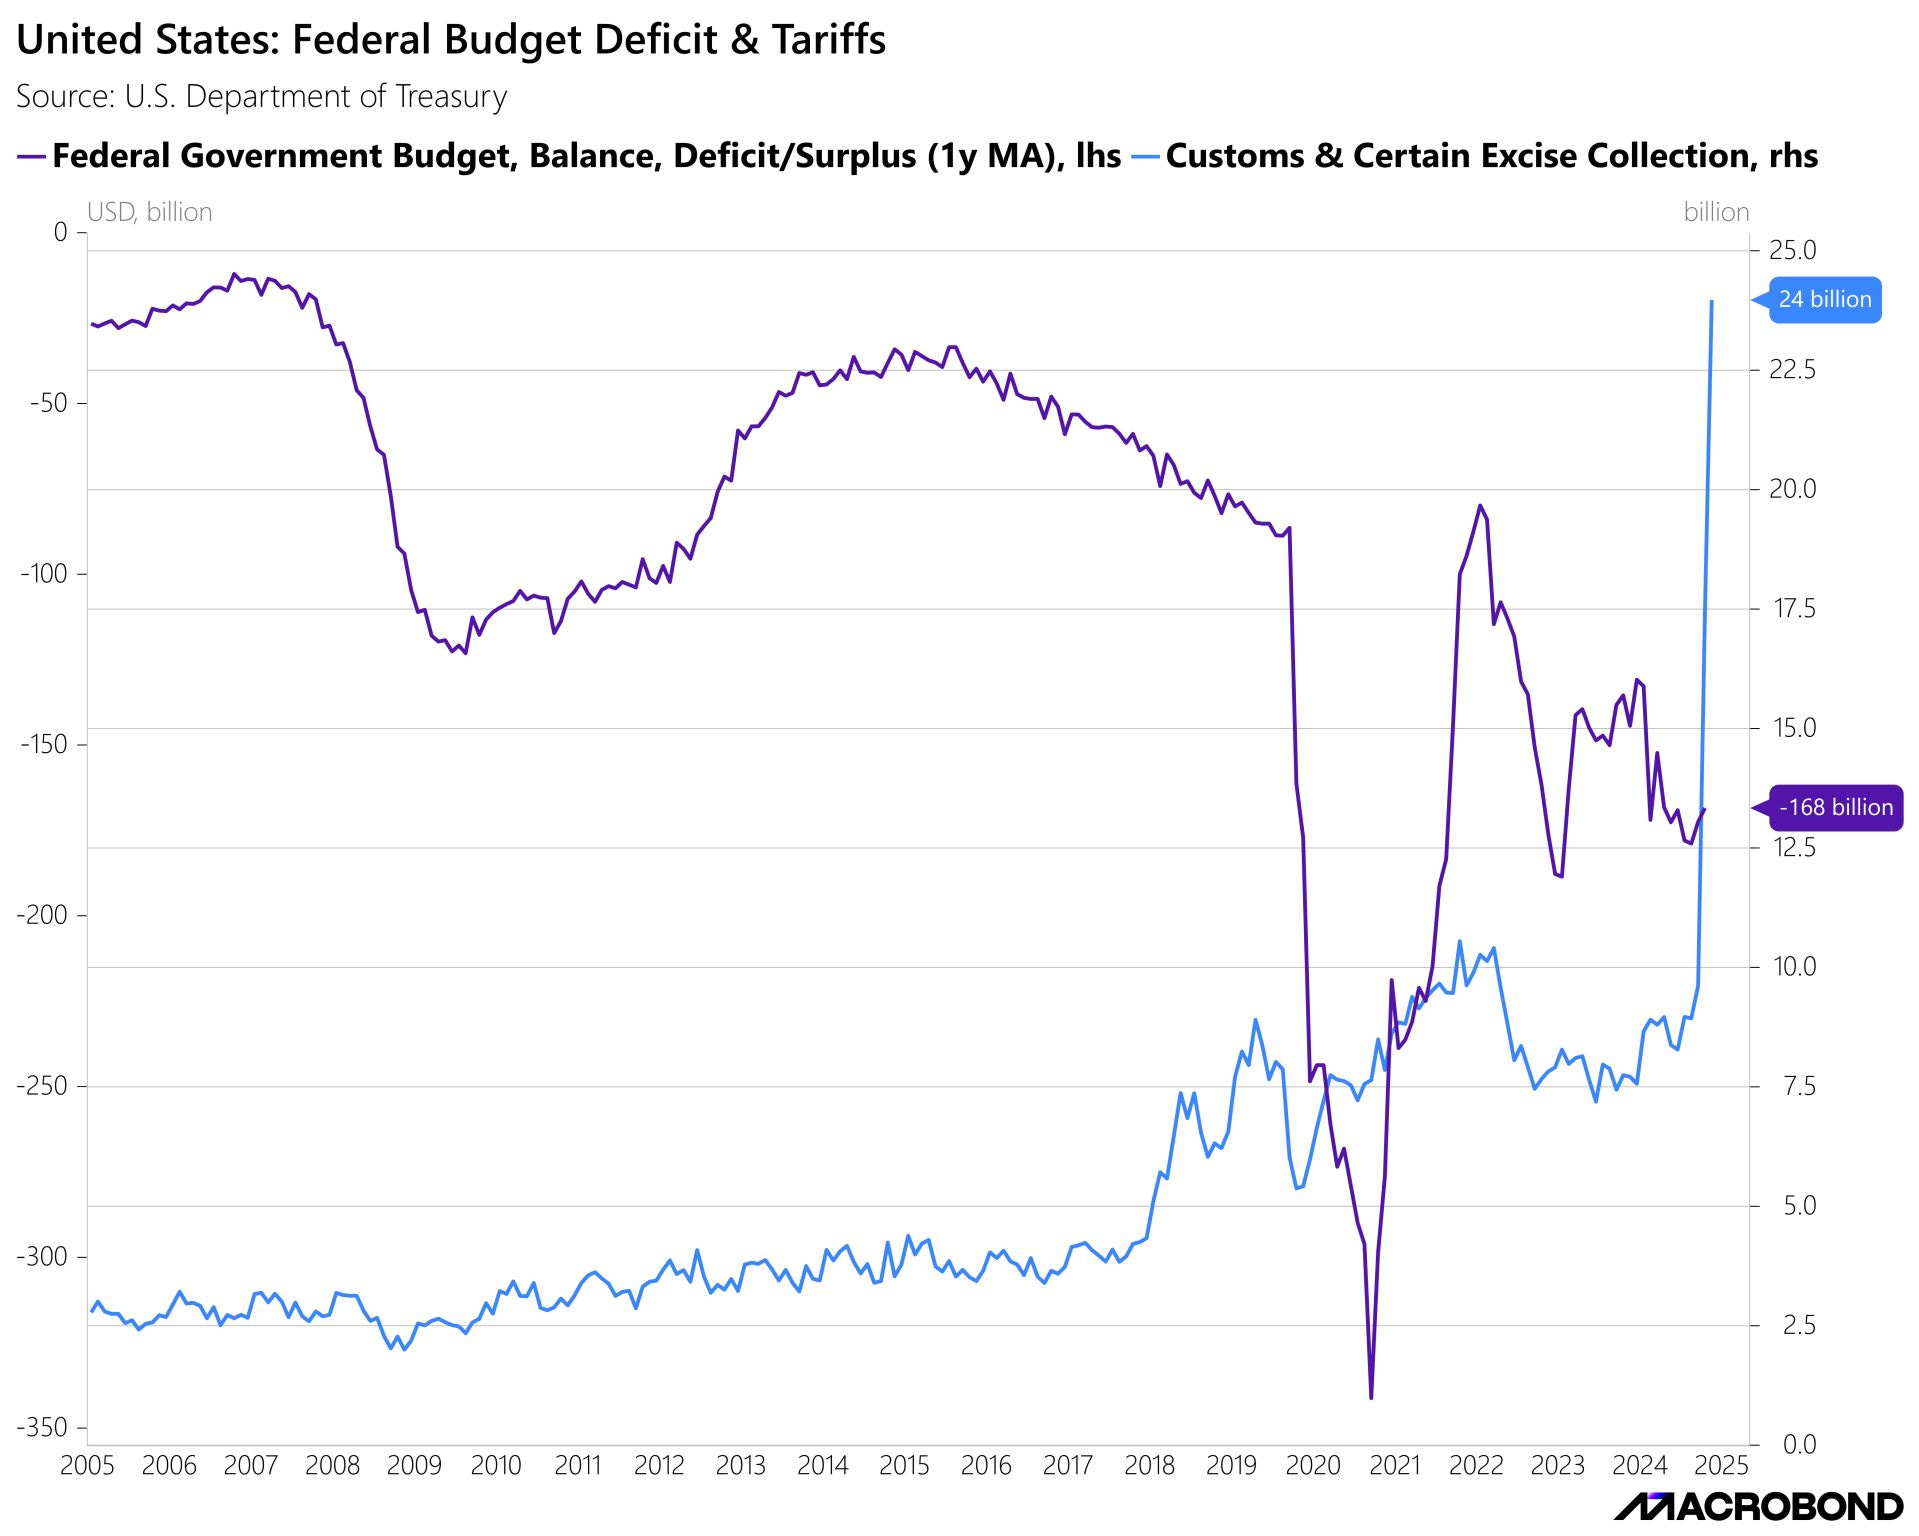
As a result of the higher tariff rate, the US is generating billions of dollars in tariff revenues every month. The tariff collections of the past three months were as follows:
March: $9.62bn
April: $17.43bn
May: $23.97bnThus, we won’t be surprised if the US Government garners more than $300 billion of annual tariffs due to the highest tariff rate since the 1920s.

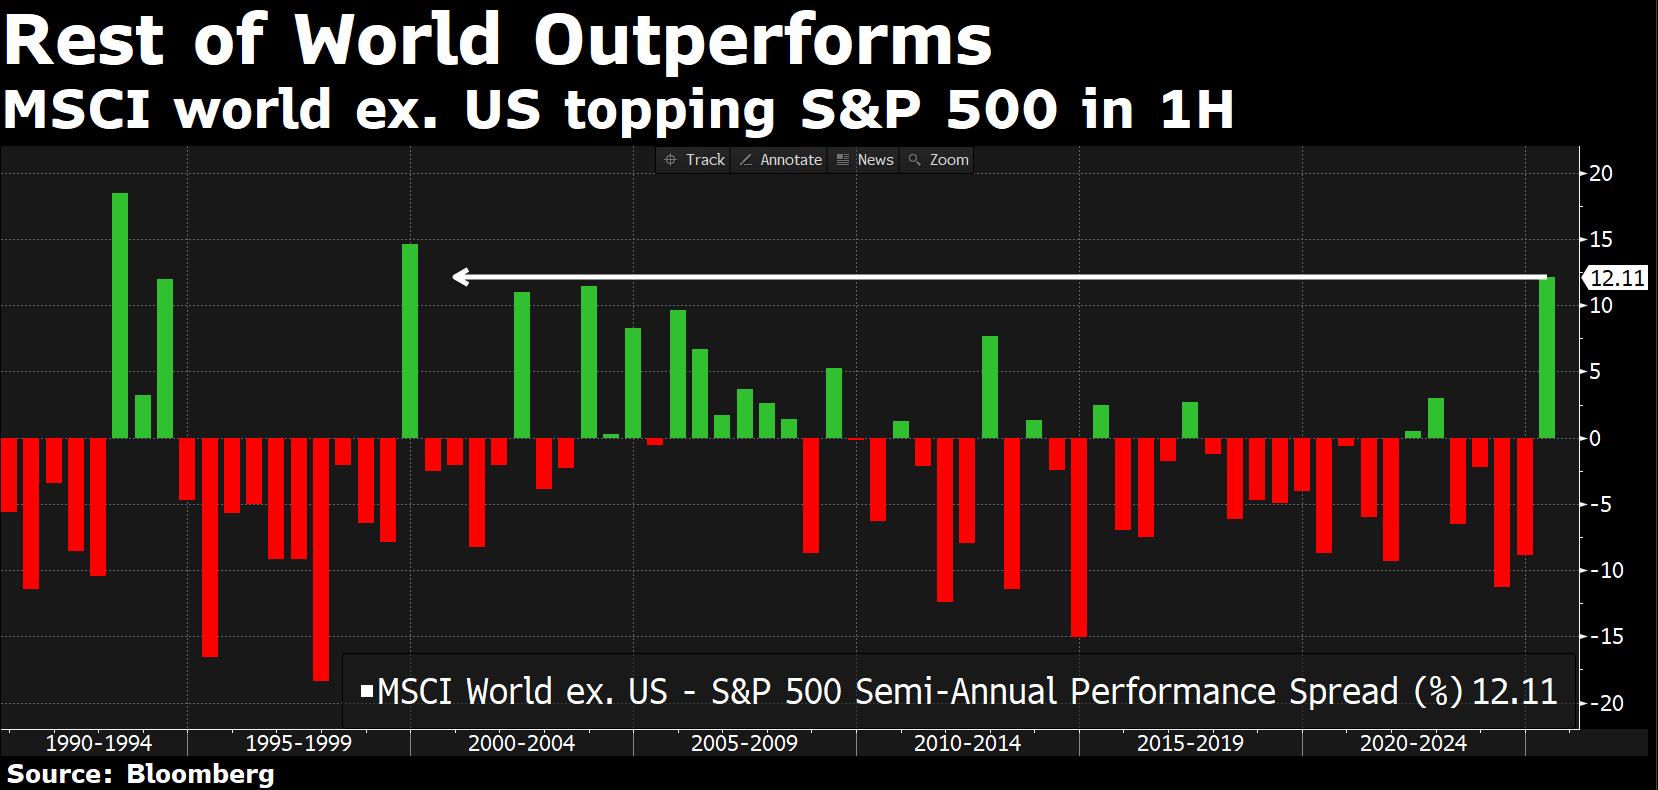
Returning to the markets, H1 was exceptional, as the MSCI World ex-US outperformed the S&P 500 by a substantial margin.
You will be surprised to know that the outperformance margin was the highest since 1999.

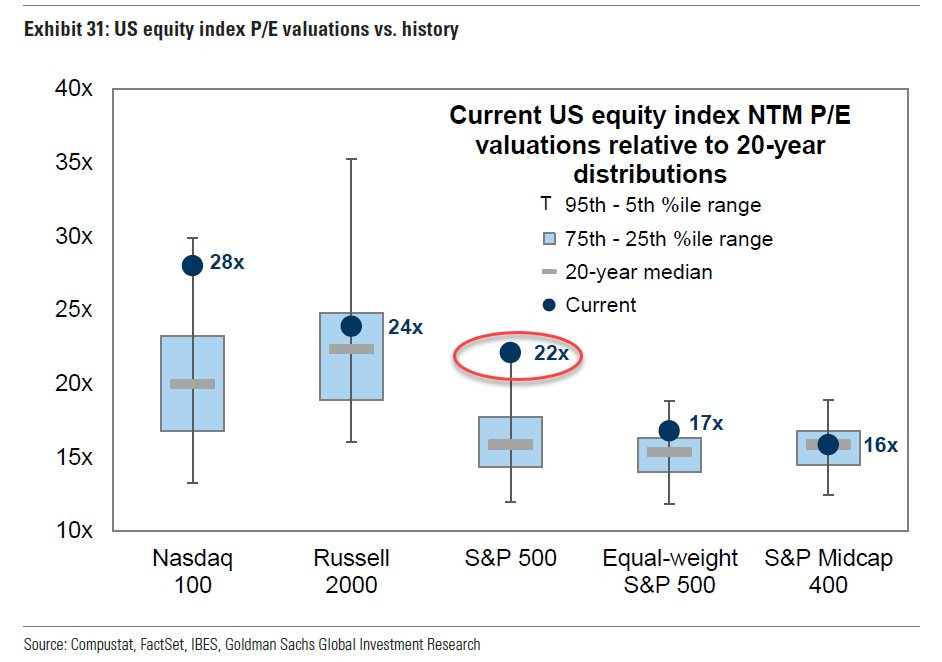
Nevertheless, despite the underperformance, the tech index (NDX) and the S&P 500 remain among the most expensive ever.
On the contrary, small and mid-caps give valuation comfort (though earnings can be a different story).

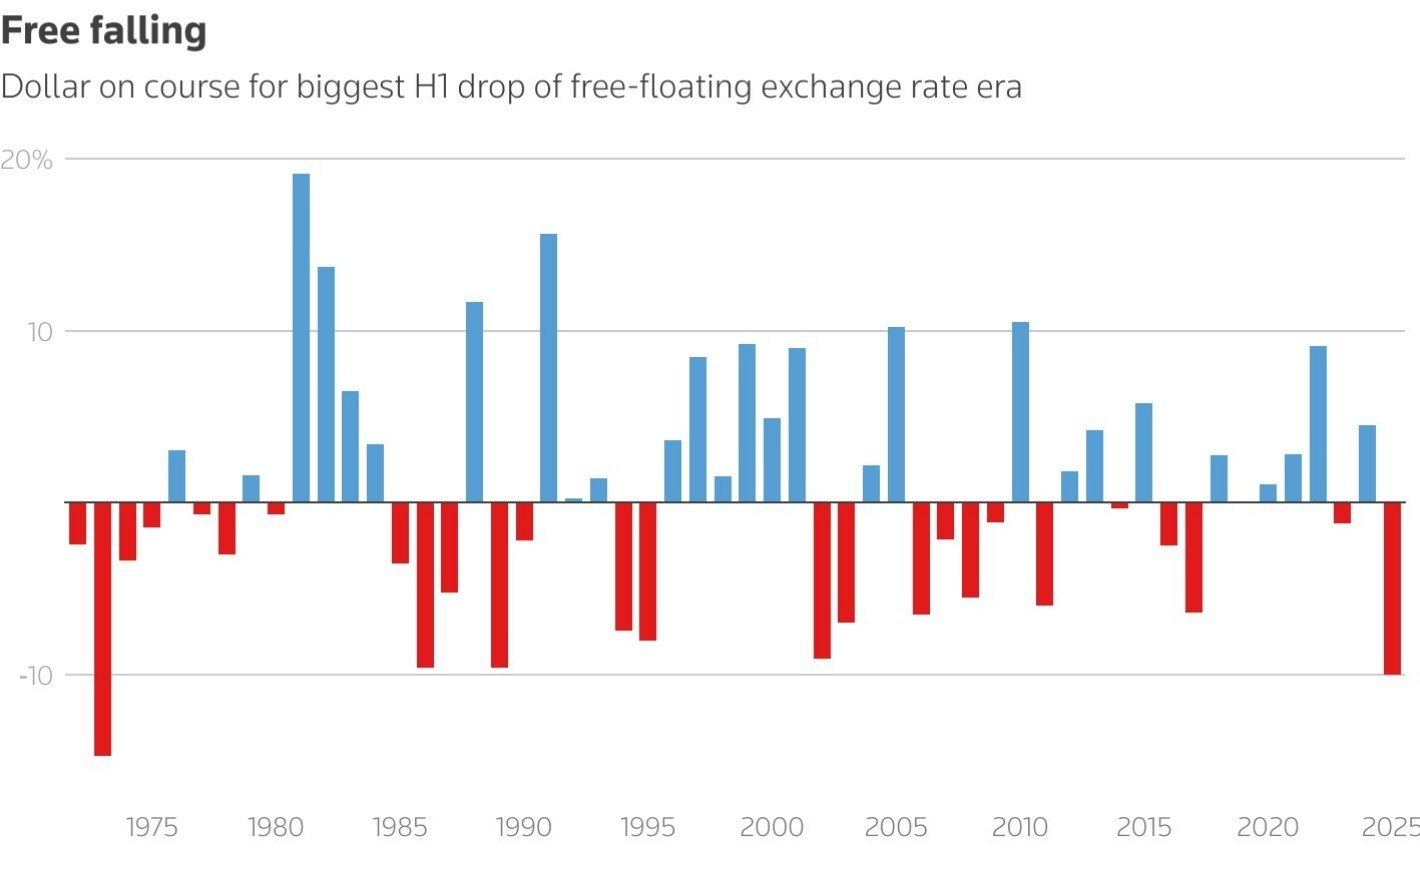
It was not only the equity markets which underperformed; the initial euphoria in the FX universe died, and the Dollar faced its worst H1 rout since 1973!
The 10.8% fall in DXY was due to multiple factors:
a) The credibility of the US was hurt after the policy flip-flops, and as the Fed's independence was called into question.
b) The US administration wants a lower greenback to reduce the trade deficit. Thus, it is being used as a policy tool.

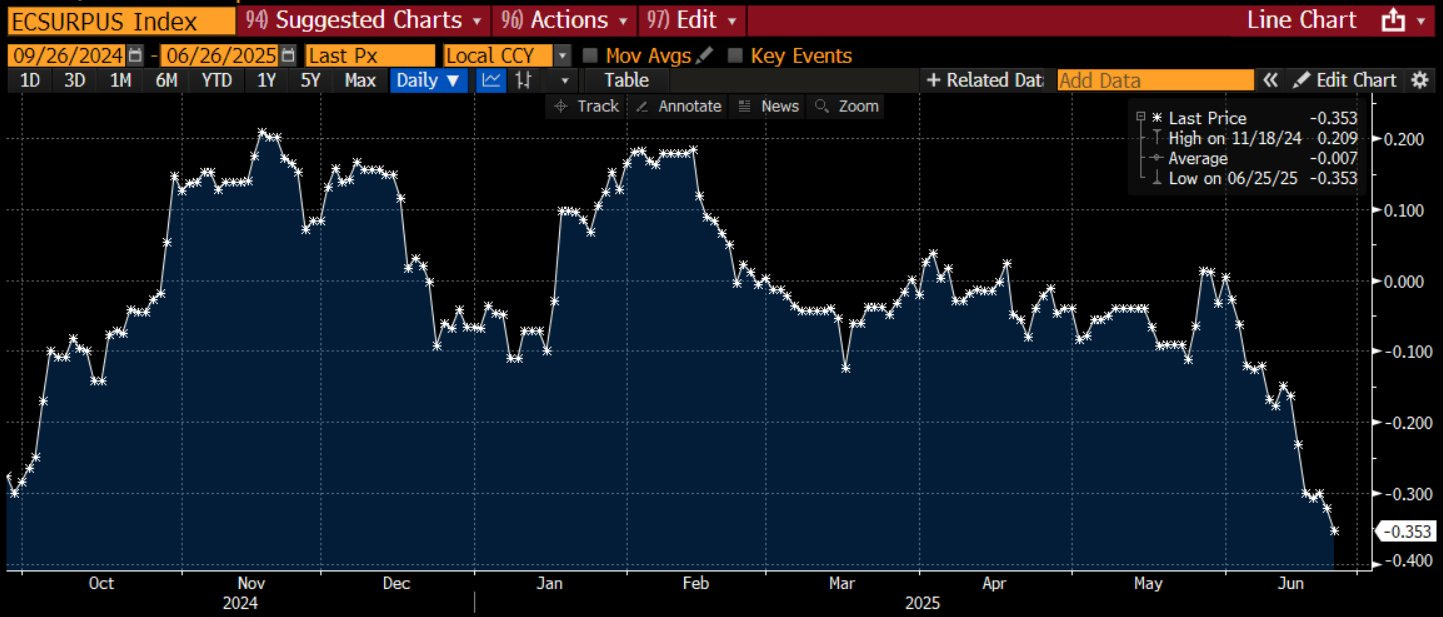
While the Fed didn’t budge on rates despite extreme political pressure, the US Bloomberg Economic Surprise Index plunged to levels last seen in September 2024, indicating that the weakness in macroeconomic data is alarming.
The majority of the deterioration in data stems from the housing market, which has seen a worsening of sentiment due to affordability issues as builders have failed to offload inventory despite hefty discounts.

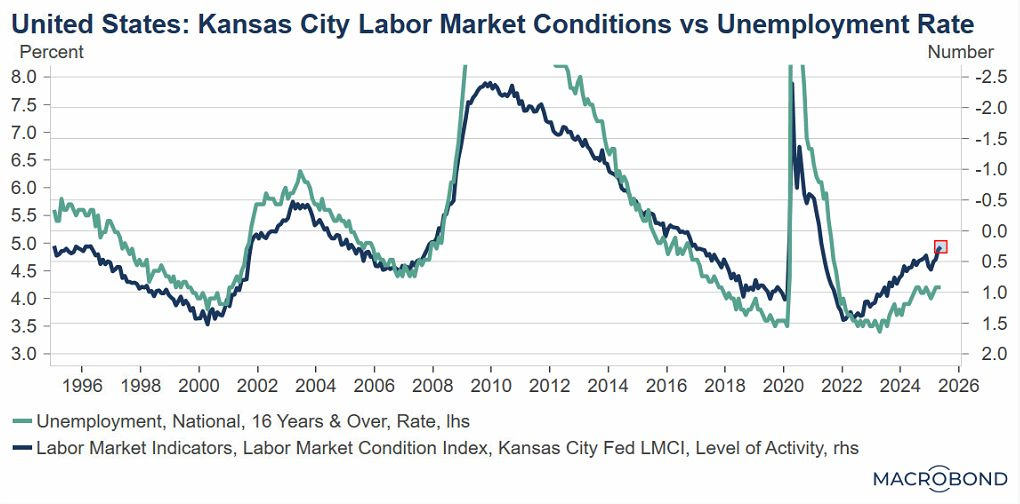
The Kansas City Fed’s Labour Market Conditions Index (LMCI) is a broad-based measure of U.S. labour market health composed of two indicators: the Level of Activity and Momentum.
As of May 2025, the LMCI Level of Activity stood at +0.26, signalling conditions that are slightly stronger than average. However, the Momentum indicator remained negative (−0.24), indicating that the labour market's rate of improvement has stalled.
Thus, it’s highly likely the weakness in the labour market will emerge sooner rather than later.

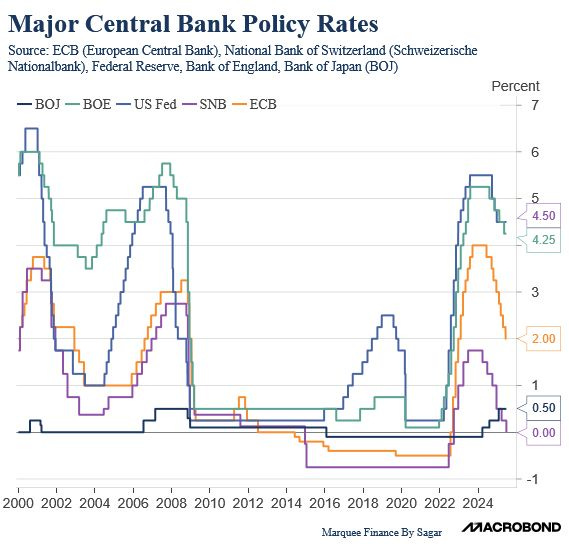
In what could be termed a surreal development, the SNB became the first Central Bank to cut rates to 0% this month.
Who would have thought two years ago that we would see negative rates so soon?
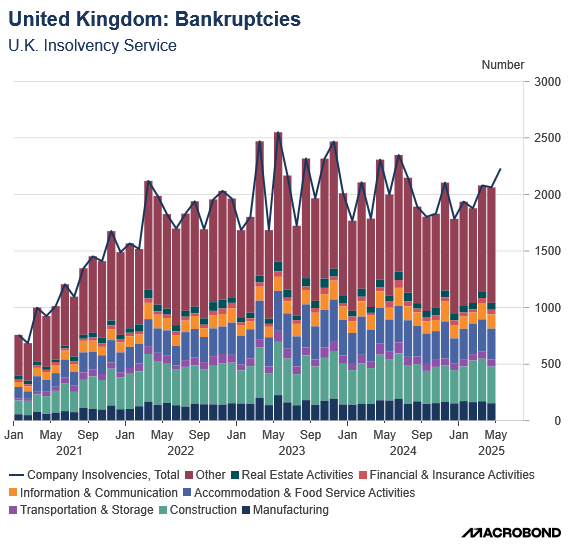
Bankruptcies in the UK are rising at an alarming rate, according to government data.
The UK company liquidation rate rose to its highest level since 2014, primarily driven by companies involved in financial and insurance activities.
Furthermore, the macro data is deteriorating at a rapid pace, led by the labour market.

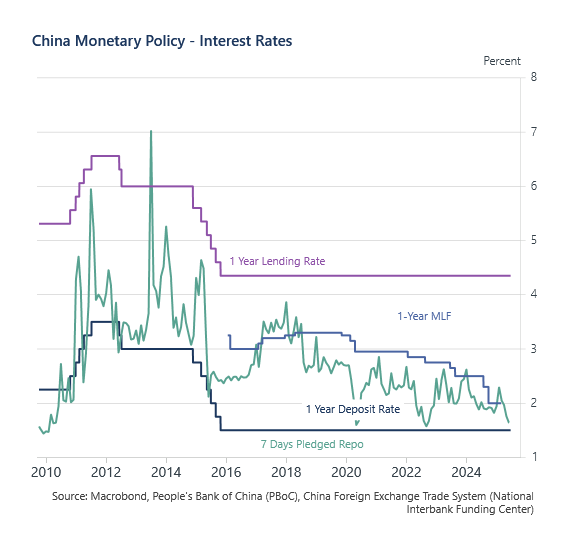
While macroeconomic data in China remains sluggish, there have been some signs of stabilisation in the housing sector.
Nonetheless, PBOC continues to pursue loose monetary policy as rates remain at rock-bottom levels.

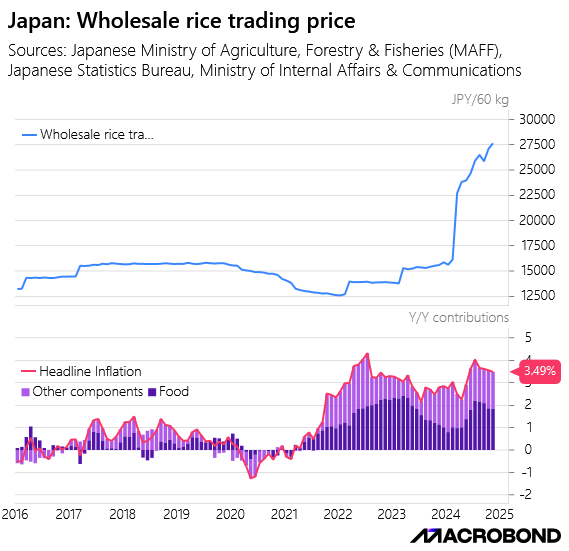
In the land of the rising sun, inflation is getting out of control due to the incessant rise in rice prices.
Rice prices have almost doubled in the last year, and as a result, food inflation now constitutes more than half of the headline inflation rate.
In fact, you may be surprised to learn that a country that experienced deflation for more than three decades is now facing food inflation of 7.7% and headline inflation of 3.5%, which is higher than in the US and most of Europe.

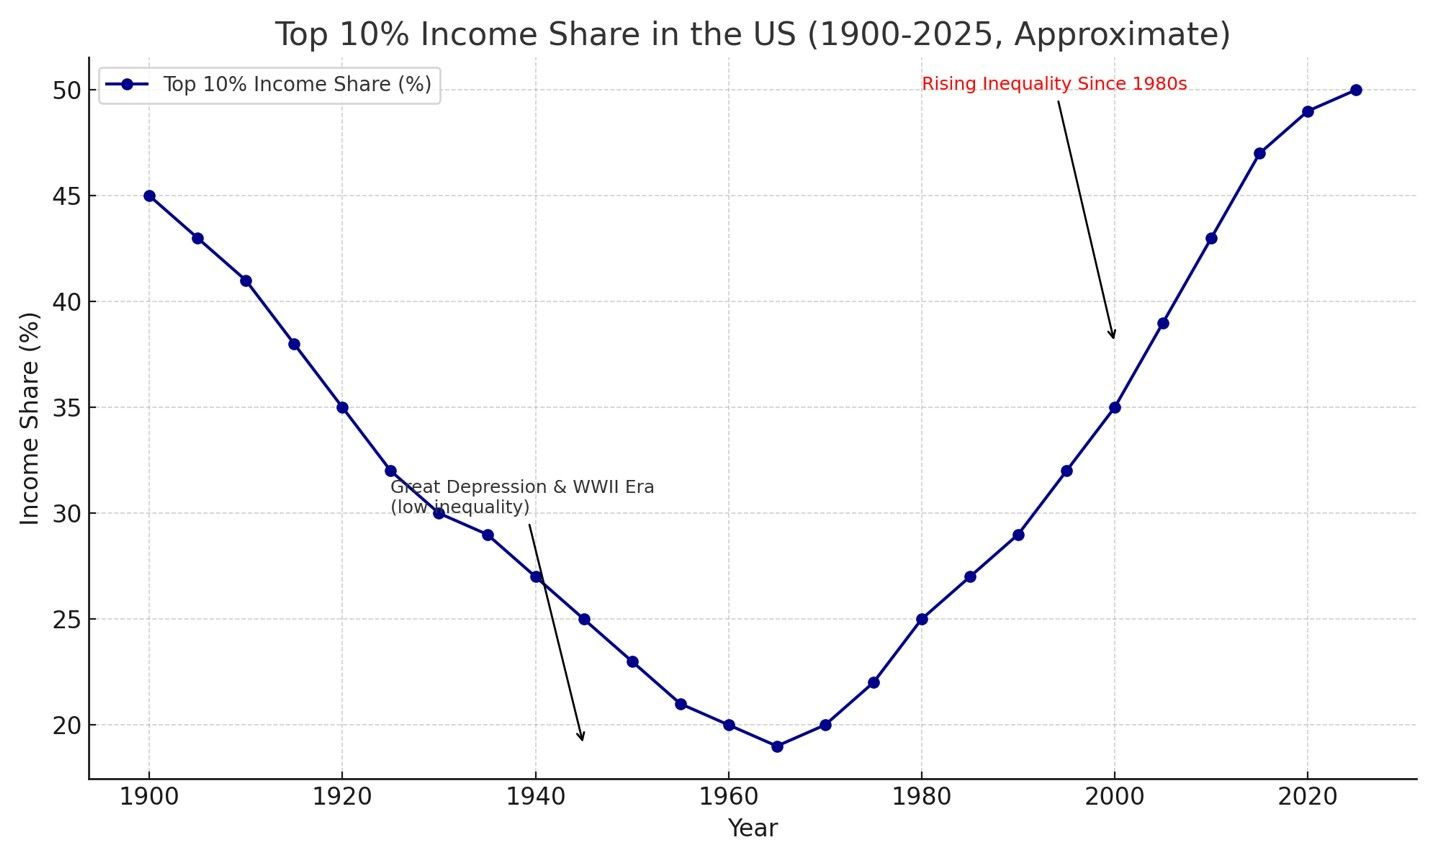
BONUS CHART 1: The third wave is in progress. Yes, folks, income inequality has reached unprecedented heights, as wealth appears to be accumulating in the hands of a few. Over 100 years ago, it went to Rockefeller and Vanderbilt, who played a significant role in the Industrial Revolution. Now it goes to Bezos & Huang, who are winning the AI revolution.
The top 10% income share in the US reached 45% in 1900 and has just surpassed 50%. It took the Great Depression & two World Wars to bring it lower by 1960. What happens this time???
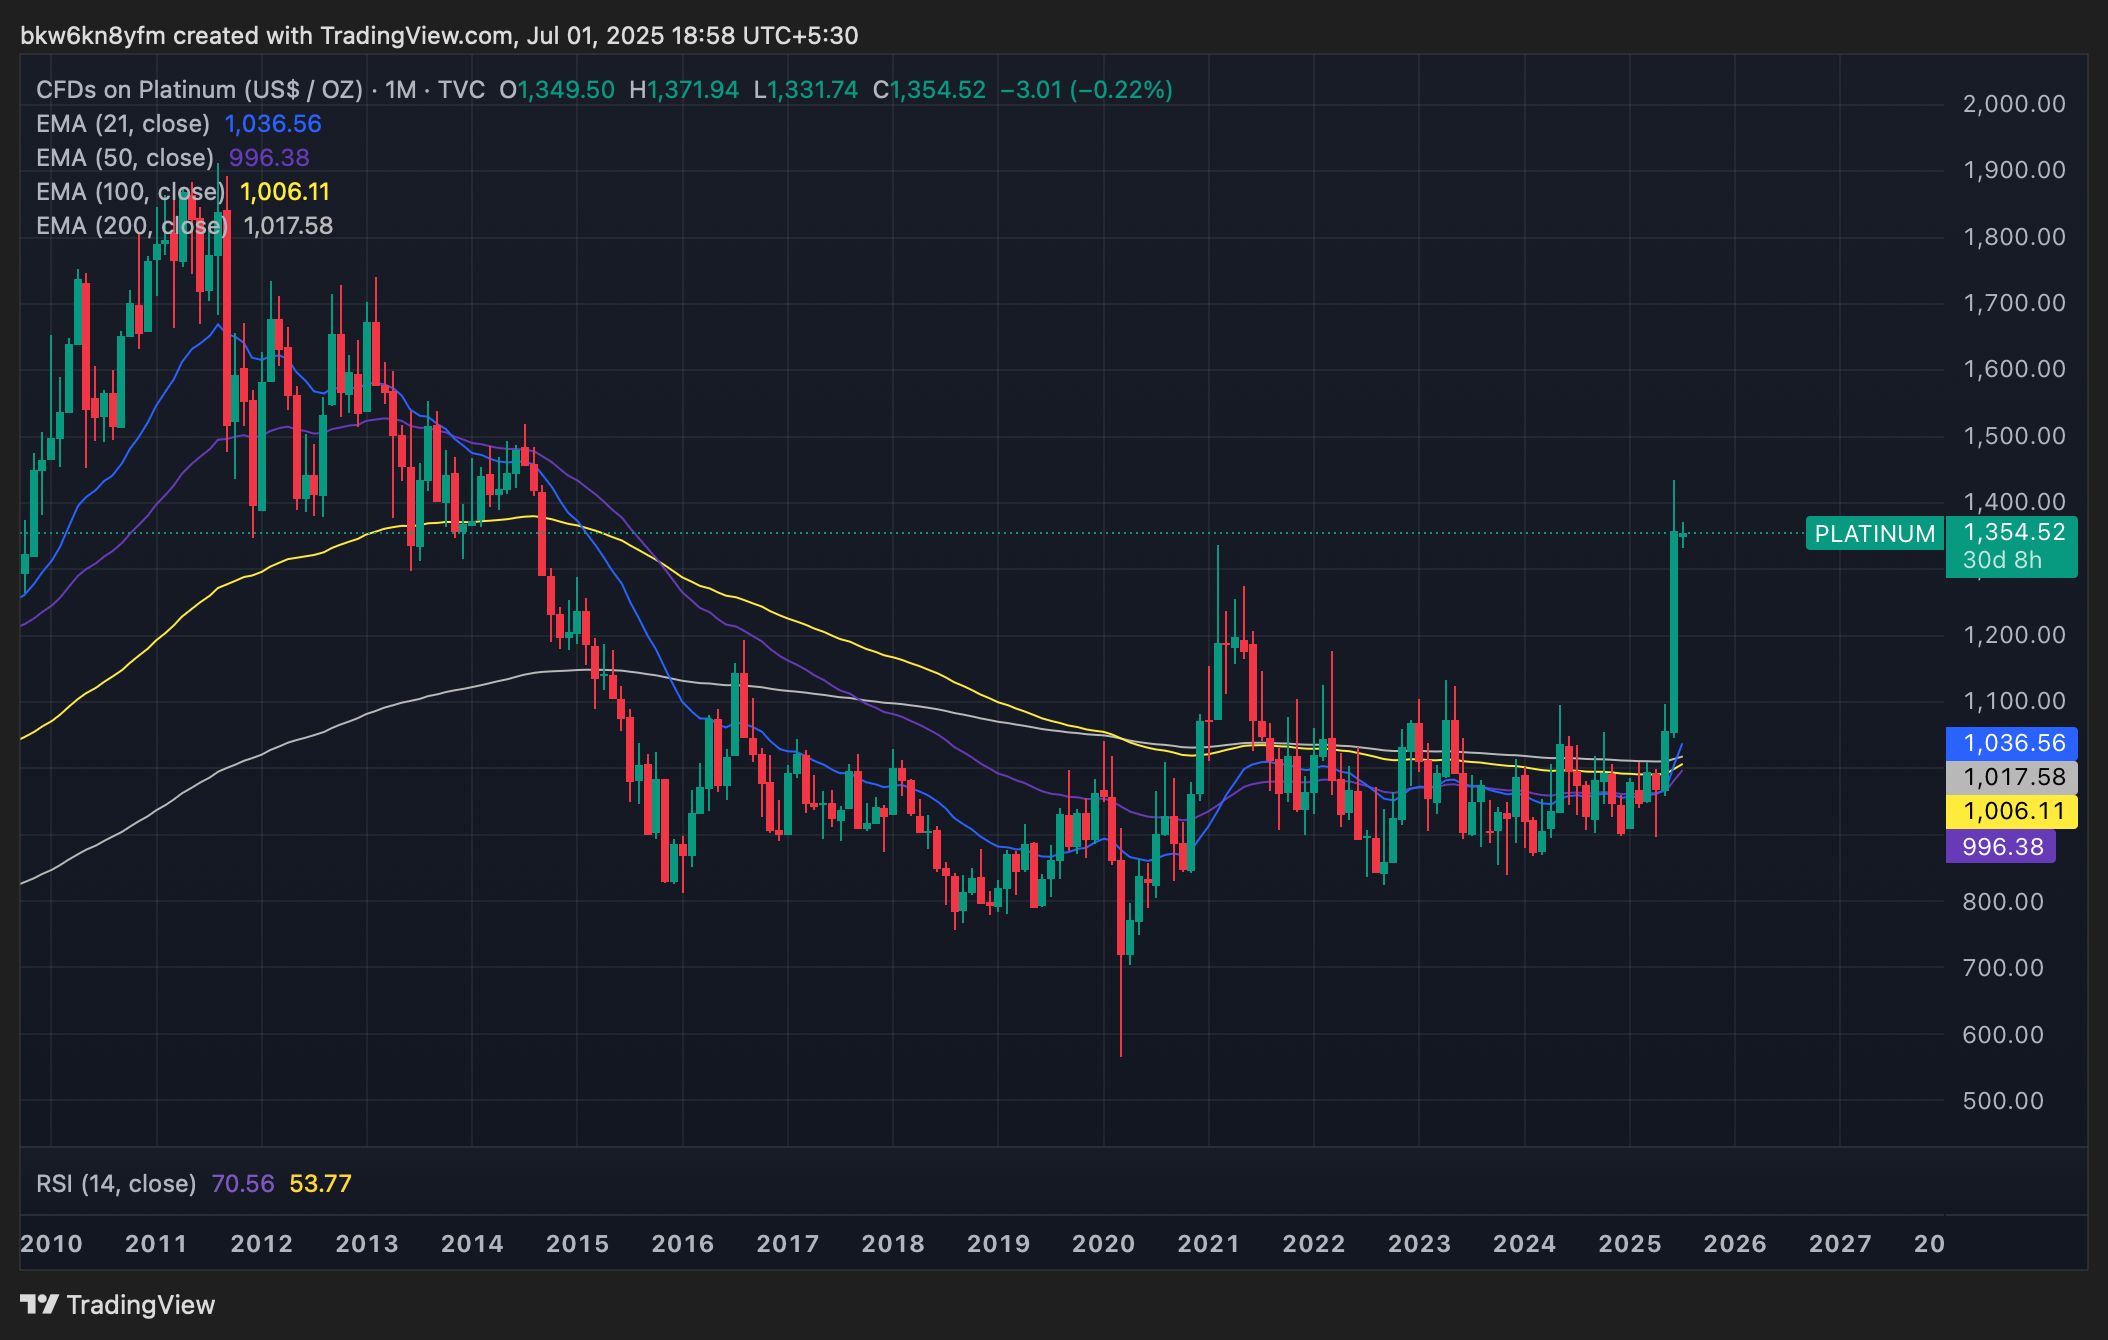
BONUS CHART 2: The real breakout in June took place not in Silver, but in Platinum. The metal had the best monthly gains of 29% since September 1979.
Let that sink in!

Disclaimer
This publication and its author are not licensed investment professionals. The author & any other individuals associated with this newsletter are NOT registered as Securities broker-dealers or financial investment advisors with the U.S. Securities and Exchange Commission, Commodity Futures Trading Commission, or any other securities/regulatory authority. Nothing produced under Marquee Finance by Sagar should be construed as investment advice. Do your research and contact your certified financial planner or other dedicated professional before making investment decisions. Investments carry risk and may lose value; Marquee Finance By Sagar LLC, Marqueefinancebysagar.substack.com or Sagar Singh Setia is not responsible for loss of value; all investment decisions you make are yours alone.