

Welcome to the “Month In Charts” March Edition.
“March Madness” is an analogy which refers to a form of madness or uncharacteristic behaviour said to affect people in the month of March.
Well, “March Madness” has thoroughly gripped the financial markets. Let’s understand via charts:
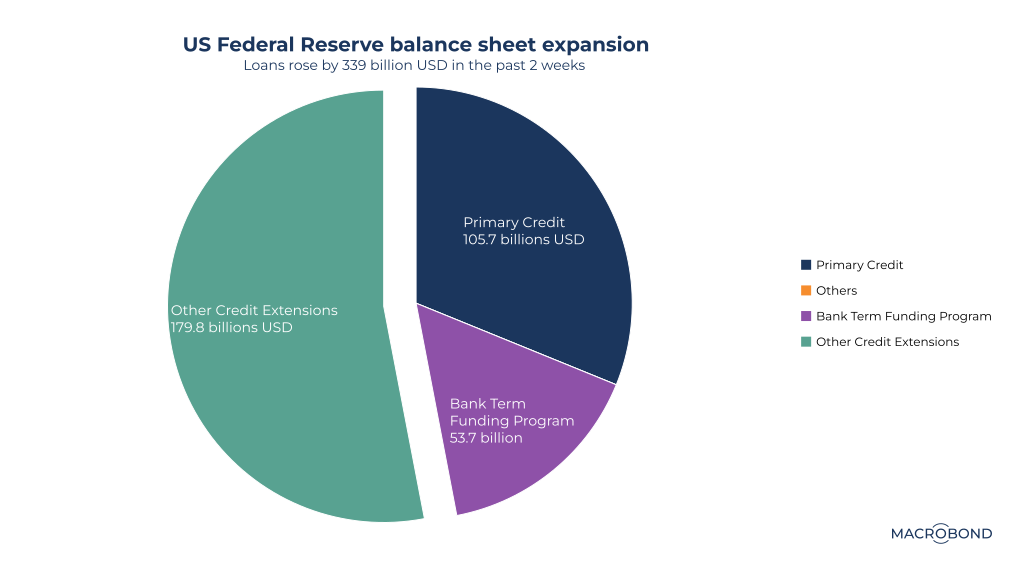
As SVB failed and the deposit flight ensued in the small regional banks, the Fed introduced BFTP (Bank Funding Term Programme) and expanded its balance sheet by a record $300 billion to maintain financial stability.

Source: Macrobond The smaller banks are on a weak footing as the deposit flight is likely to continue. The spread between MMFs and deposit rate remains high, while the reserve position at small banks remained at a level when the repo market blew up in 2019.
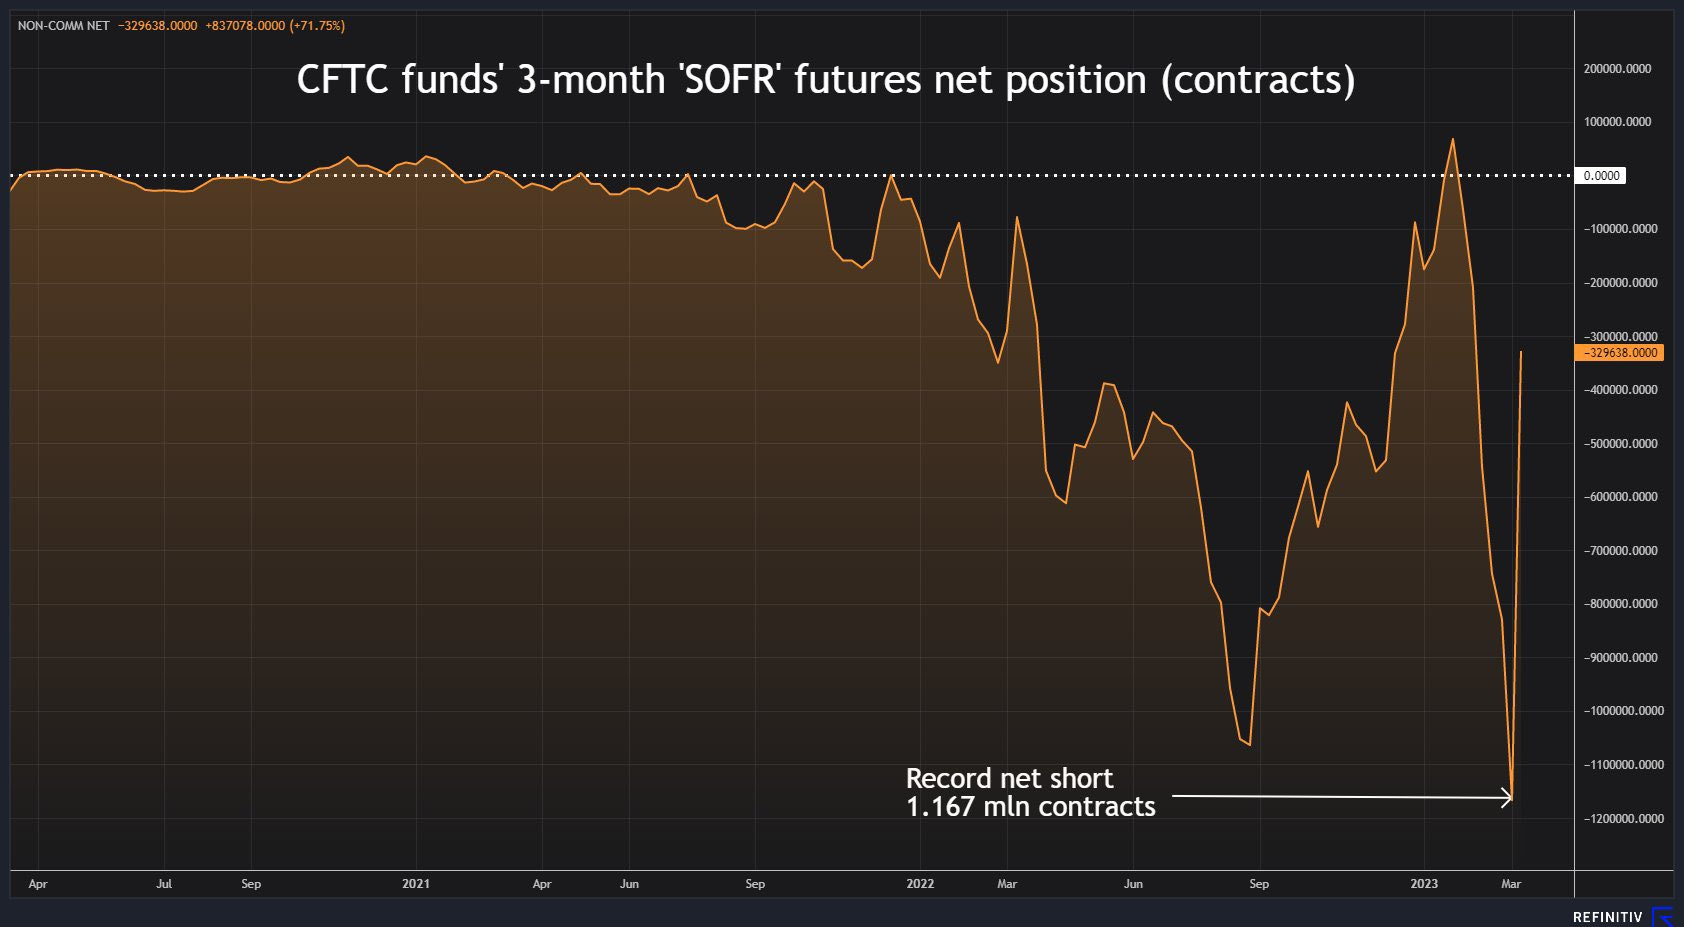
Source: Fidelity Before SVB news came out, the Treasury markets had record “net” short positions as a 50 bps hike was a done deal, and the expectations of a 6% terminal rate were slowly creeping in.

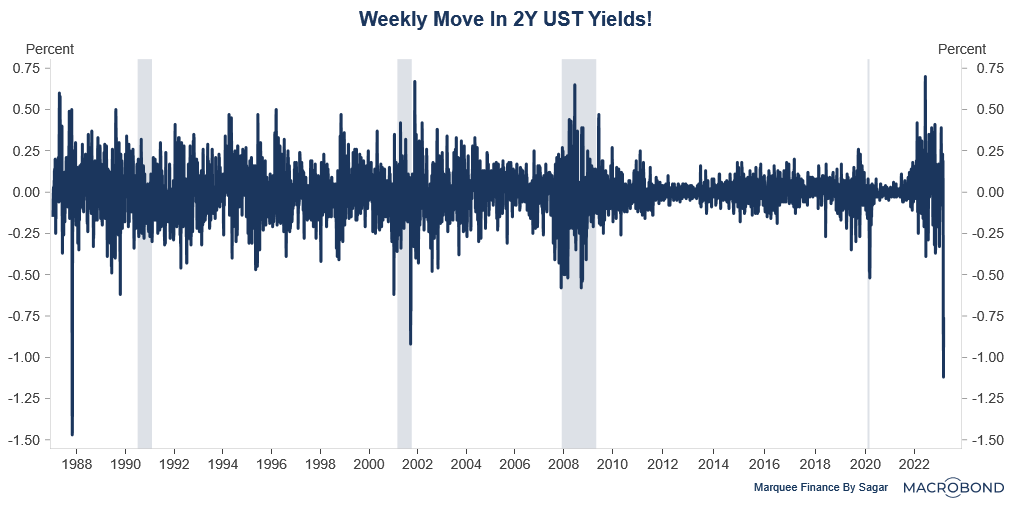
Source: Refinitiv Post the SVB fiasco, the massive short covering in the USTs led to some wild moves in yields, and the weekly moves were the highest since the Black Monday Stock Market crash of 1987. On a daily basis, the move was a mind-boggling 12SD.

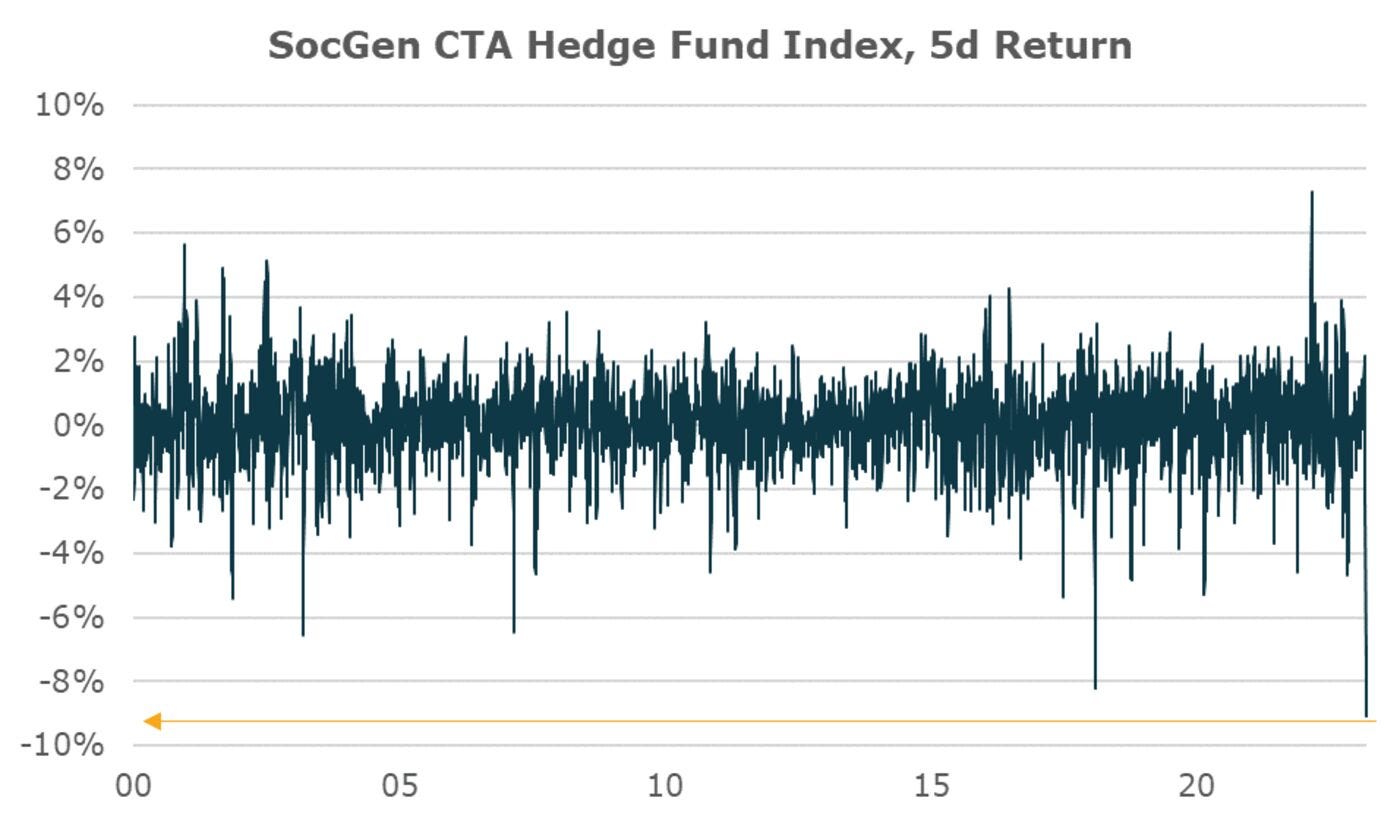
Source: Macrobond The hedge funds lost a lot of money due to their bets in the UST markets. As a result, the 5-day return was the worst since 2000.
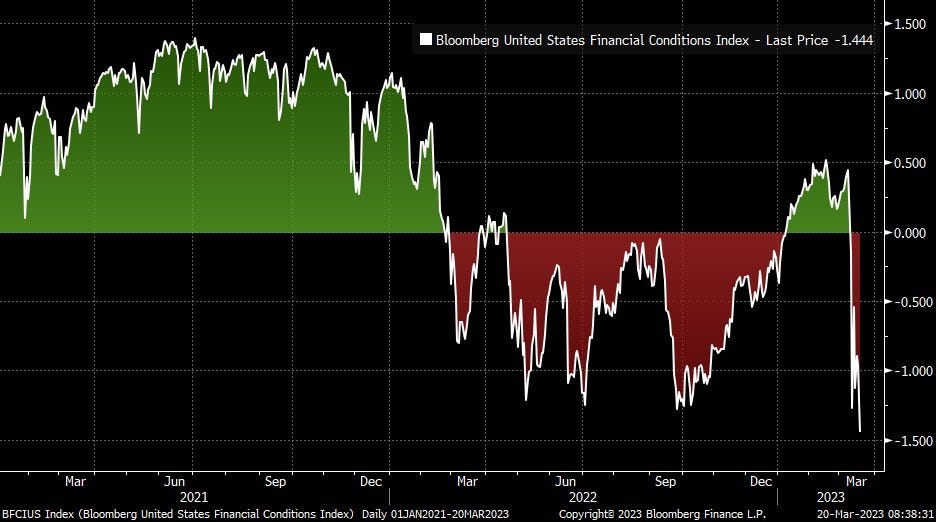
The ramifications of unprecedented moves in the bond markets were the MOVE Index (tracking bond market volatility) soaring to the levels last seen since 2008 GFC and the Financial Conditions tightening rapidly.

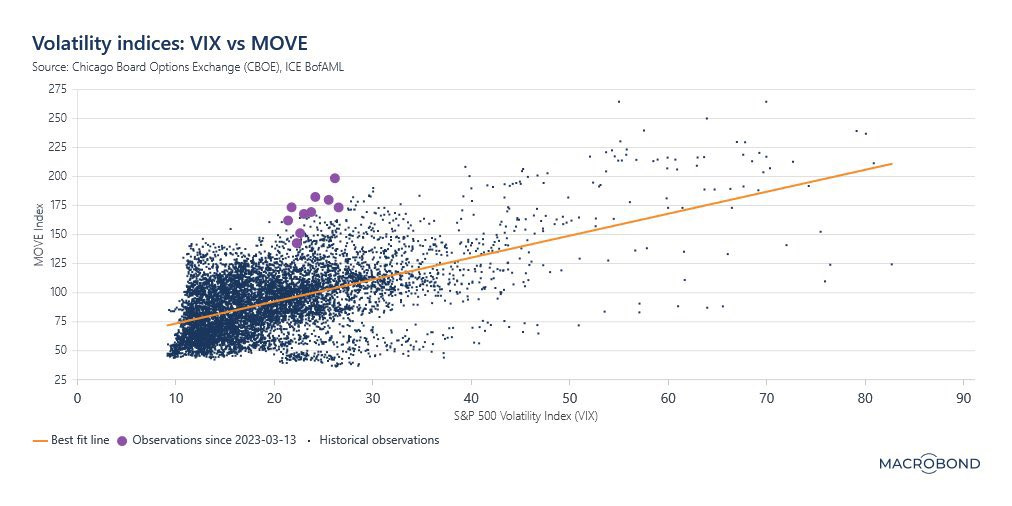
Source: Bloomberg While the bond markets witnessed unprecedented carnage (MOVE), the stock markets (VIX) were relatively calm. Quite unusual to say!

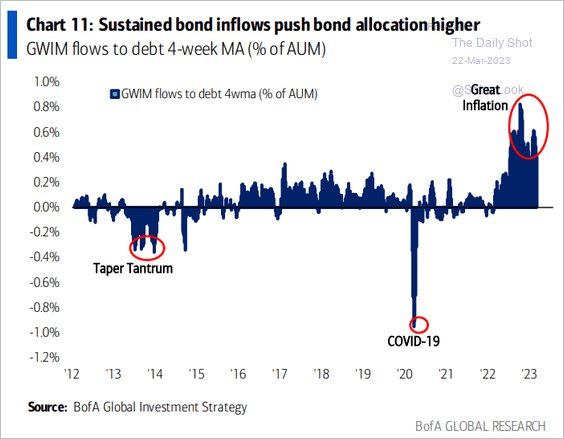
Source: Macrobond As the money moves from risky to safe assets, the bond inflows continue to advance as investors find the yield attractive amid the chaos.
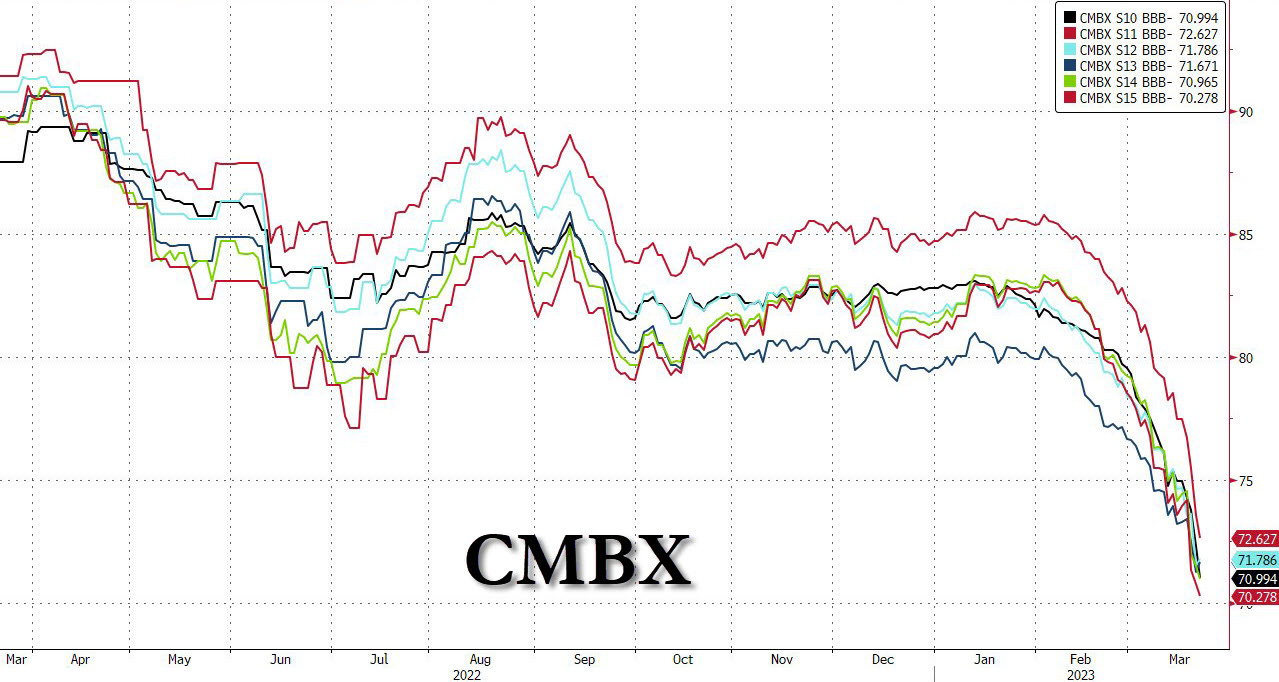
Source: BofA and The Daily Shot The next pain point post regional banks remain the Commercial Real Estate Market. The crash in Commercial Mortgage-Backed Securities (CMBS) reflects the catastrophe awaiting the office space REITs and the string of bankruptcies that will likely follow.

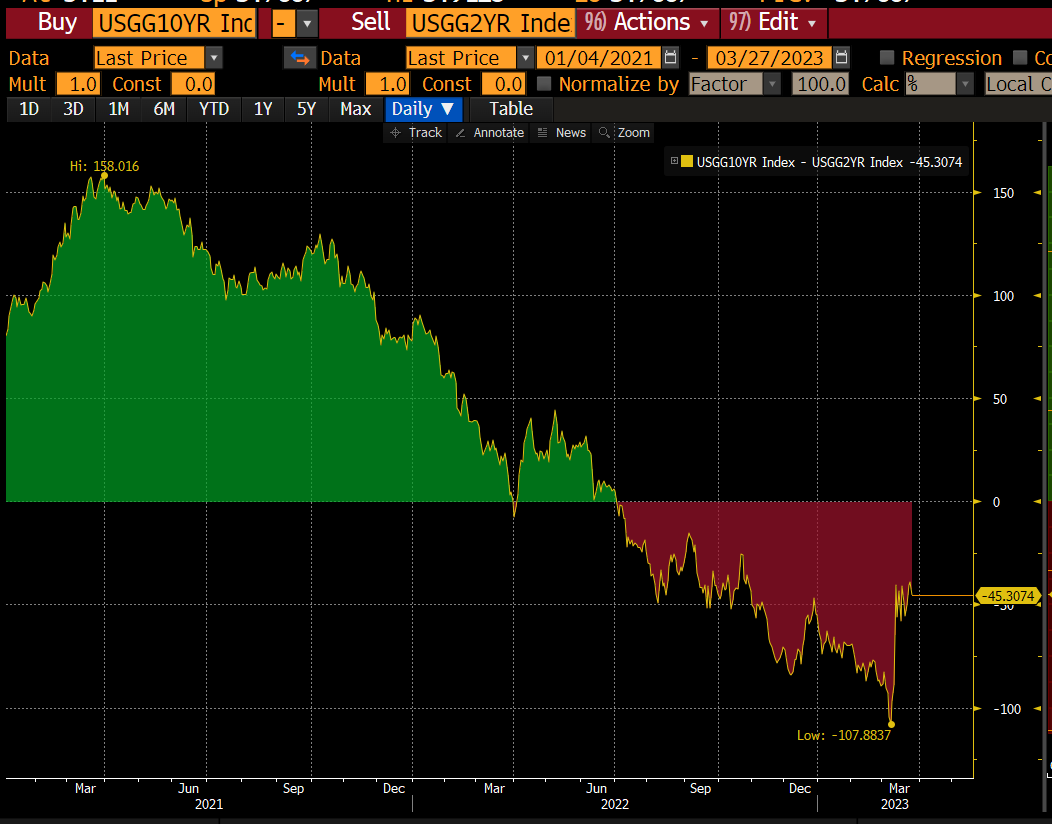
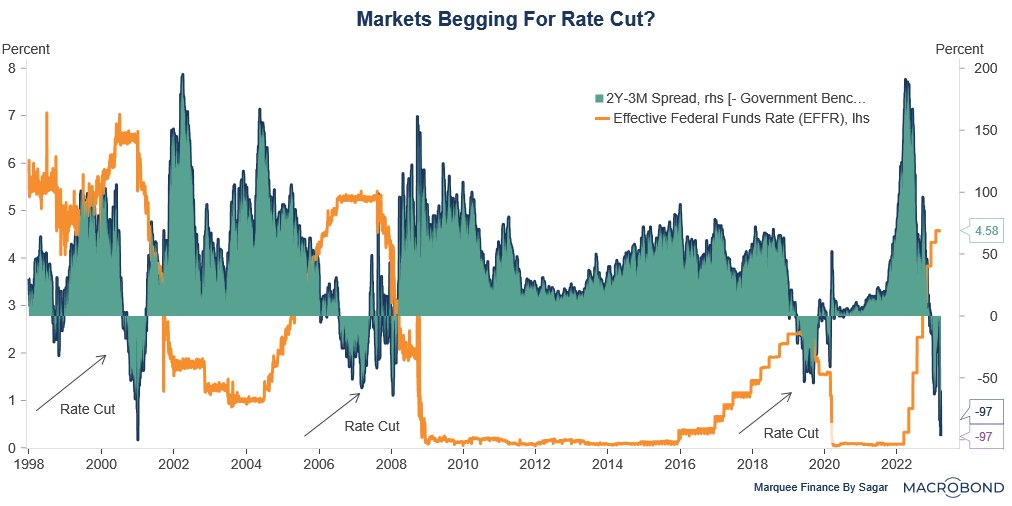
Source: Zerohedge We can’t end without discussing the movement in the yield curve. While the 2s10s steepened massively, the 2Y-3M curve suggests rate cuts are around the horizon.

Source: Bloomberg 
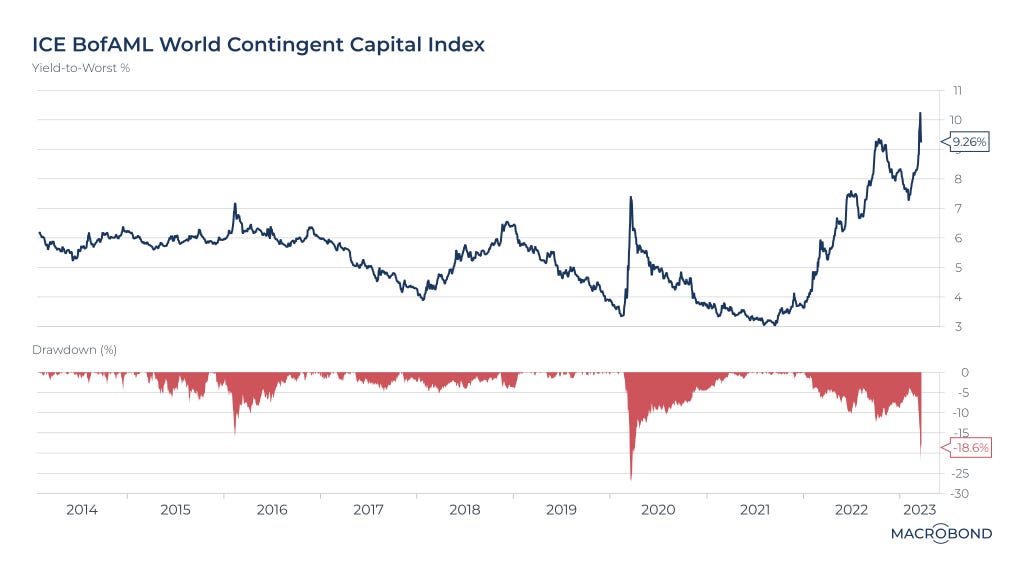
Source: Macrobond While a lot has been said and written about Credit Suisse and the AT1 mess that succeeded the merger, when you look at the repercussions in the AT1 market, you will be astounded at the insane rise in yields and the drawdown in these instruments.

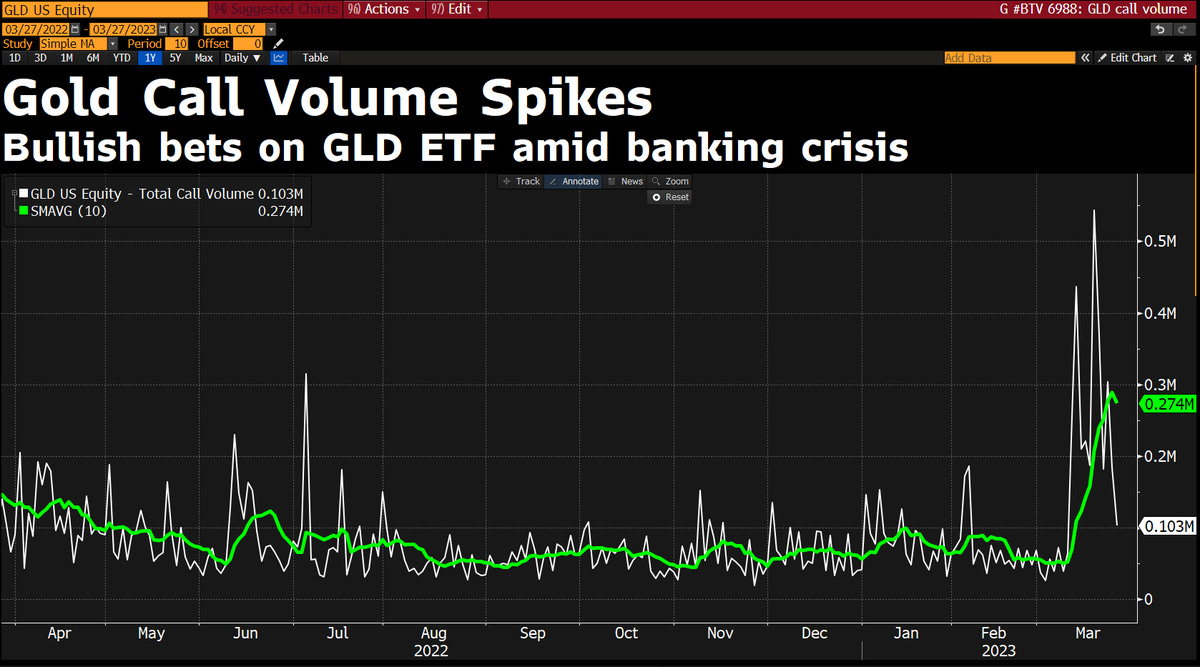
Source: Macrobond Among all the doom and gloom, the shiny metal continues to shine. As per FT: “March is set to be the first month of net inflows into gold ETFs for ten months, while the volume of bullish options bets tied to the funds has approached record levels”.

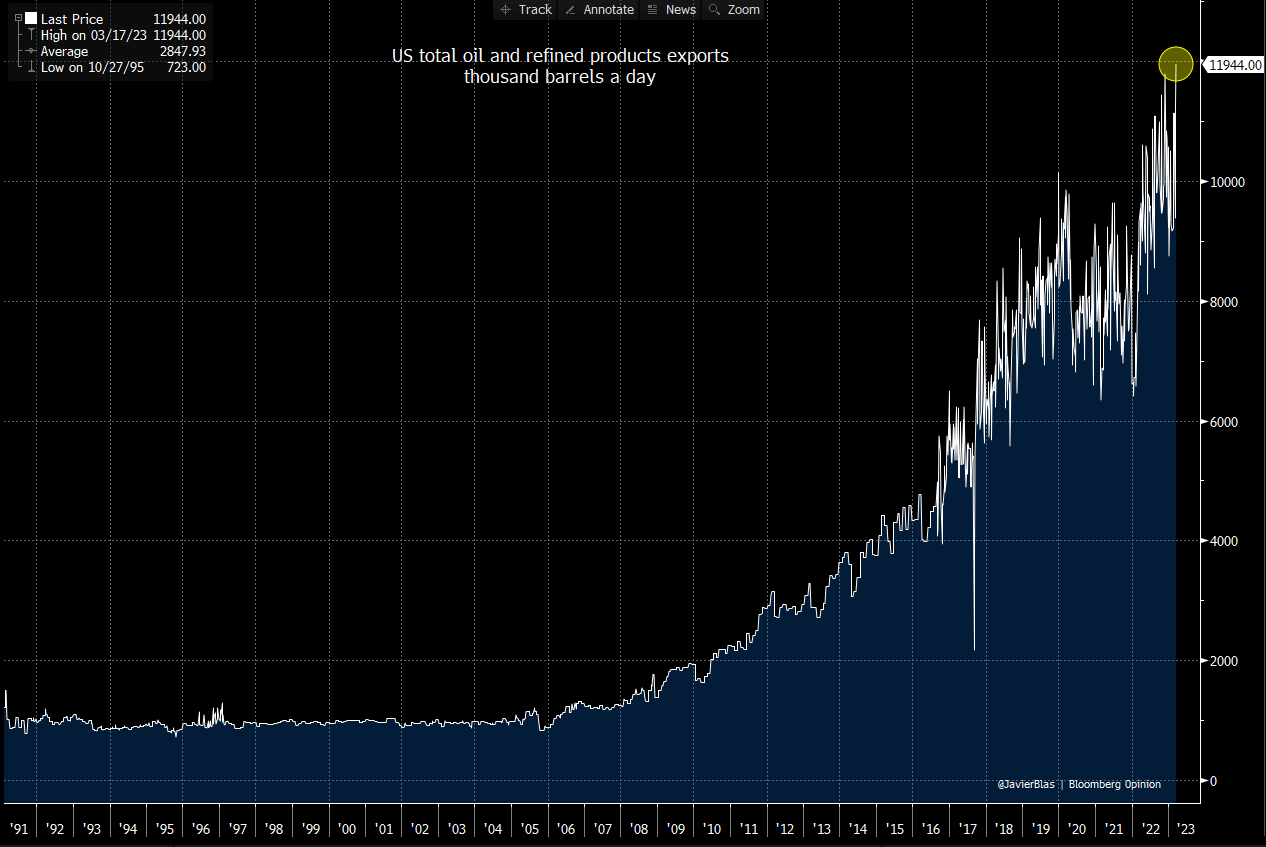
Source: Bloomberg While the energy markets remain calm, the US oil and refined products exports continue to surprise market participants. As a result, the US is now officially “the refinery of the world” as it continues pumping a record amount of refined products into the global markets.

Source: Javier Blas, Bloomberg


That’s all for this month!
Stay tuned for the Friday’s/Saturday’s Newsletter!
Disclaimer
This publication and its author is not a licensed investment professional. Nothing produced under Marquee Finance by Sagar should be construed as investment advice. Do your own research and contact your financial advisor before making investment decisions.