

The 2020s are turning out to be the decade of epic exogenous shocks.
Nobody could have modelled the “pandemic”, the 2022 Russian invasion of Ukriane, “the tariff saga” of 2025 and the most largest disruption in the energy markets in history due to the Iran-Israel/US war of 2026.
Let’s examine 15 charts to analyse the global macro and the 2026 energy shock!
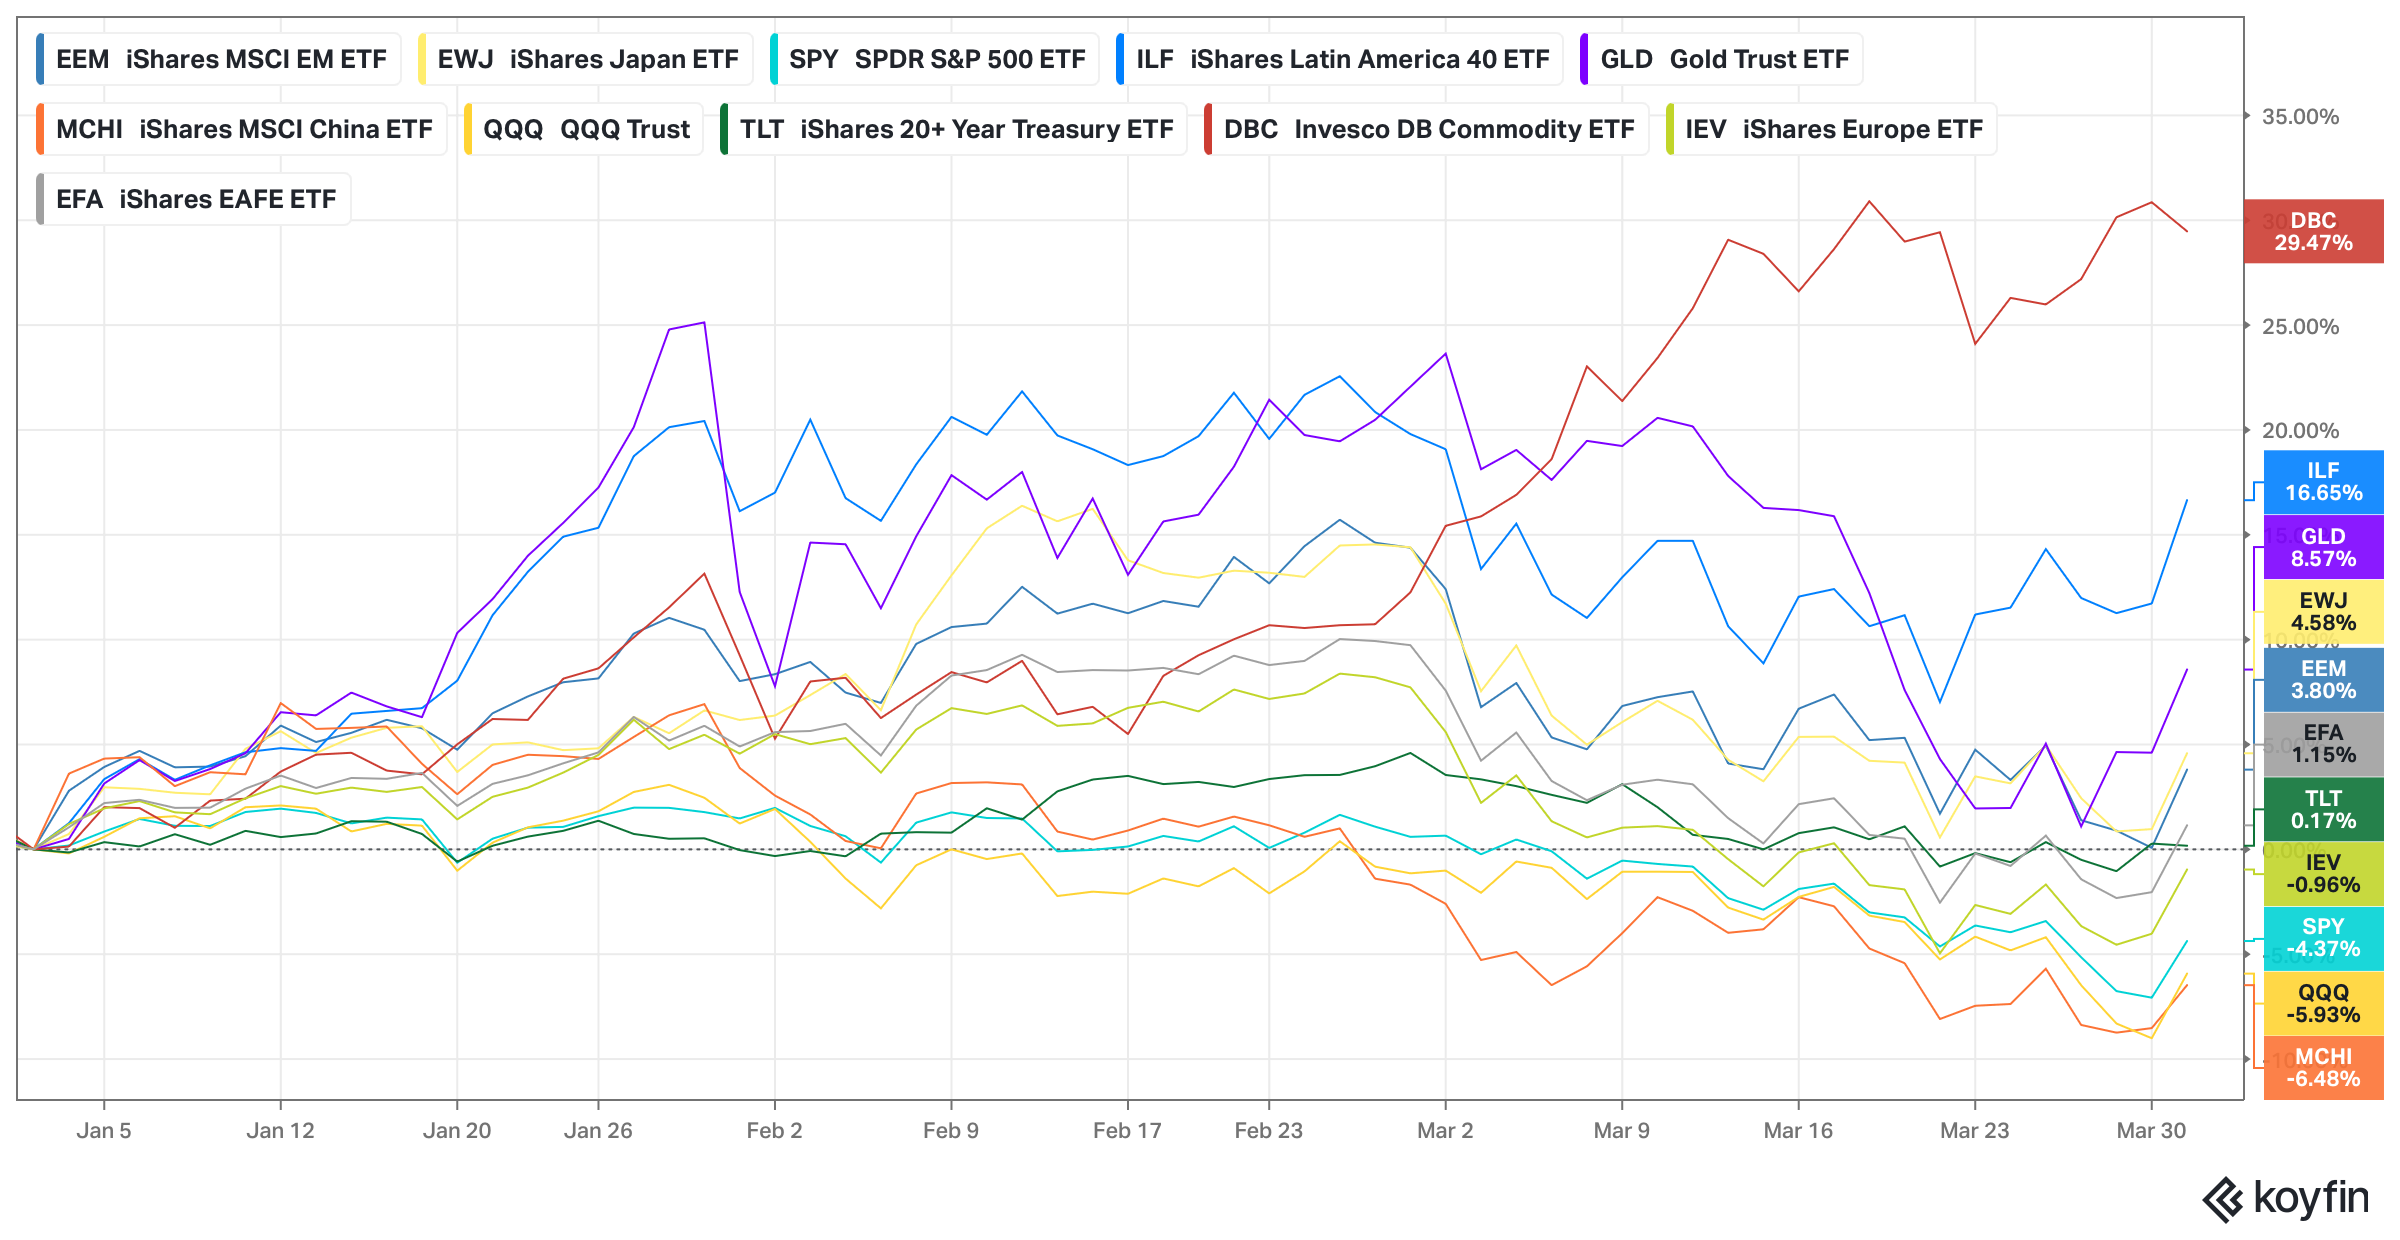
Led by a nearly 60% rise in crude oil prices in a single month, DBC is the top YTD performer.
Thanks to the commodities outperformance, LATAM markets continued their winning streak with the benchmark ETF: ILF up 17% YTD.
Gold lost its sheen after a stellar rally in January and is now up 8.6%.
The US continues to underperform both its DM and EM peers. While the Emerging Market ETF EEM is up 3.8% YTD, the MSCI European ETF IEV is down 1% compared to the 4.4% loss for SPY and the 6% loss for the QQQ.
Surprisingly, long-term bonds provided some cushion and outperformed the US equities.

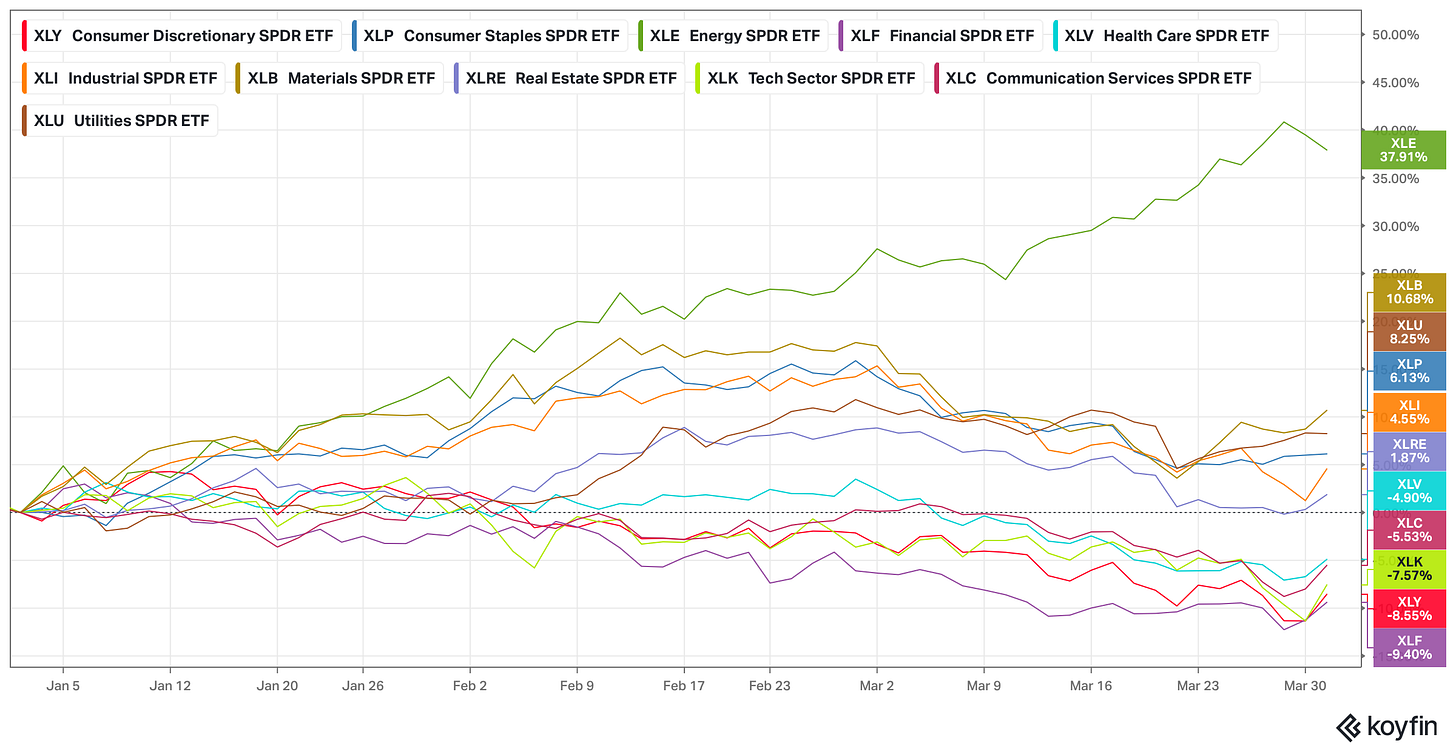
It’s not only the tech sector that has been a laggard; rising private credit concerns have also led to a massive sell-off in financials, with XLF the worst performer YTD.
Energy (XLE) has broken all records and seen the biggest outperformance relative to the S&P 500 since the 1990s.

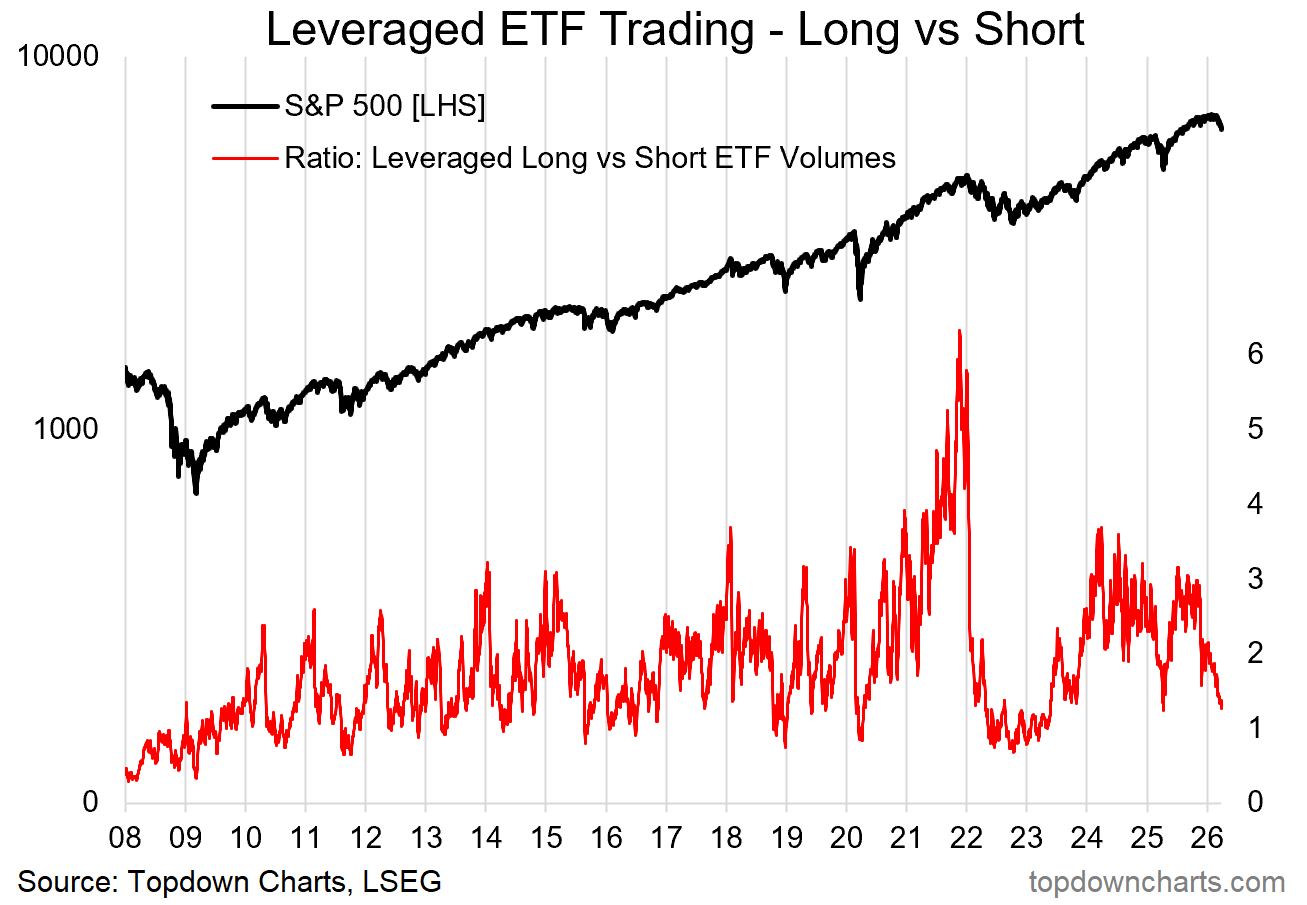
The Leveraged Long/Short ETF Volumes indicator helps predict bottoms. However, during the 2022 bear market, the indicator slumped and stayed low.
This is the one metric you should absolutely track.

Source: Topdown charts
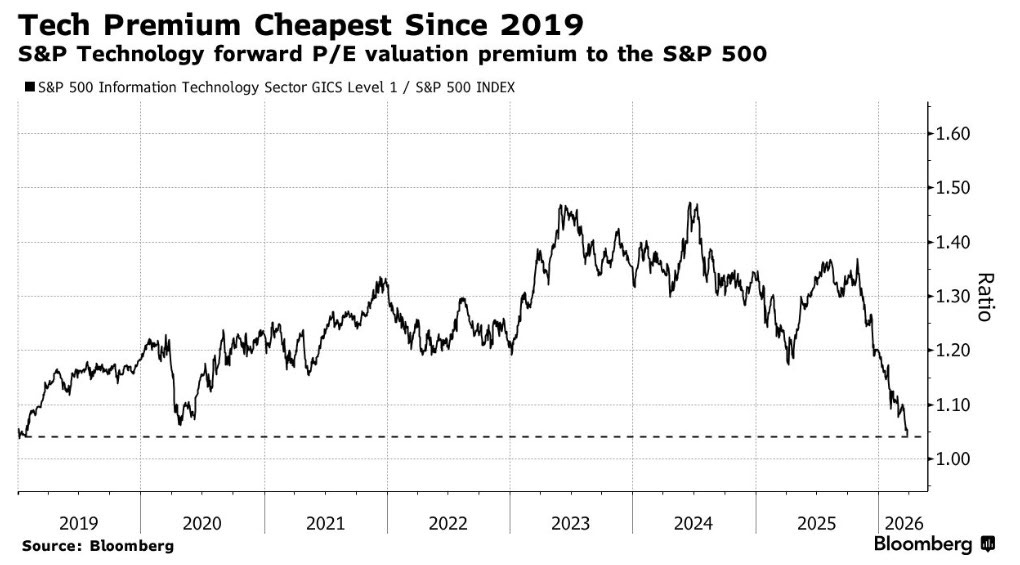
The tech investors will have to endure extreme pain over the next few months (maybe years) as Mr Market resets valuations. Once known for hoarding cash and buybacks, the big tech companies are now turning net cash negative as FCF plummets due to trillions of dollars of capex.
As a result, the S&P Tech forward PE valuation premium over the S&P 500 has compressed to 2019 levels.

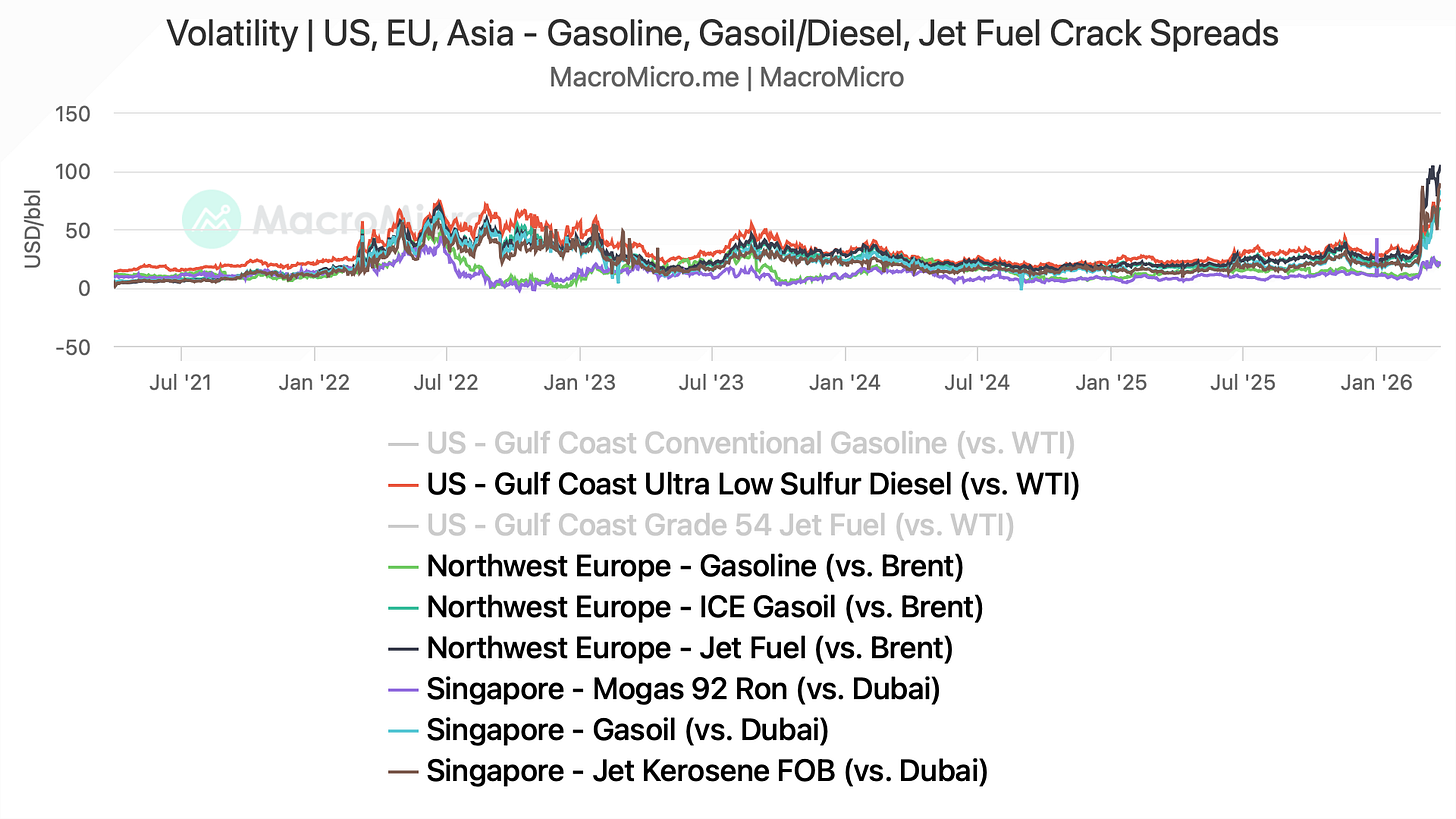
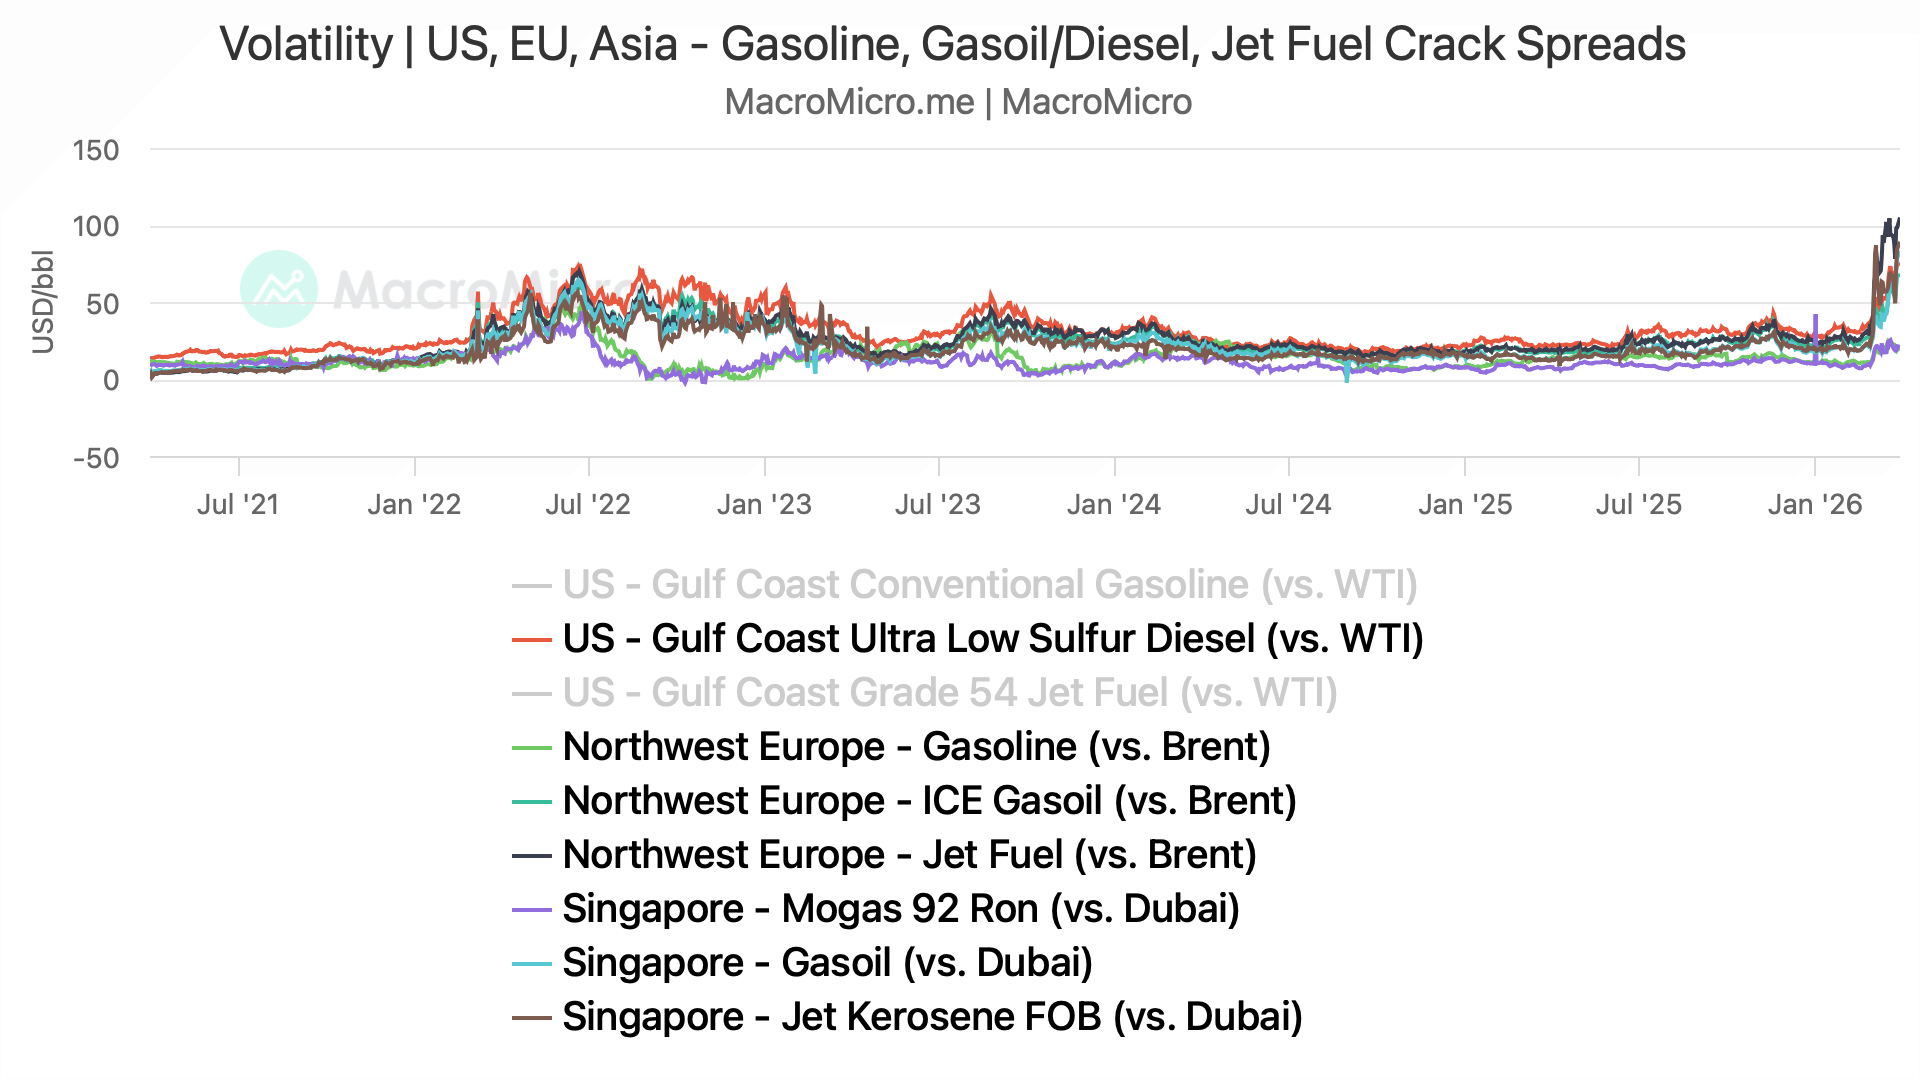
While oil prices are hovering around $100/b, product prices are off the roof and well above 2022 levels.
The biggest rise is seen in jet fuel prices, which have surpassed $250 in Singapore. We will see bankruptcies among airlines if prices persist for more than a quarter, and travellers will likely prefer short-haul destinations for vacations due to soaring airfares (inflation?).
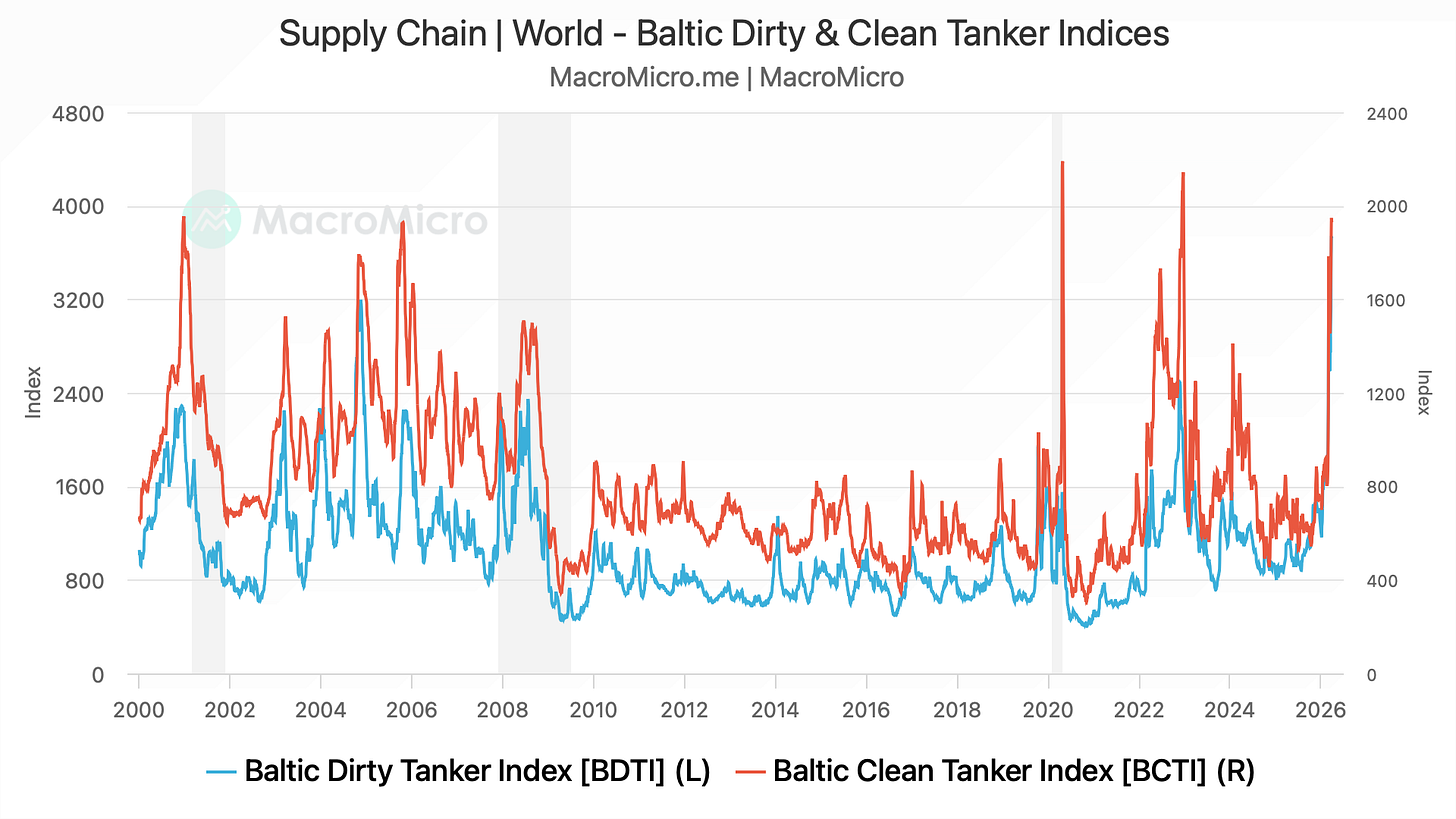
It’s not only the fuel prices, but the transportation costs have also skyrocketed.
The Baltic Dirty and Clean Tanker indices are now approaching record highs. Also note that the insurance premiums have also seen insane increases, leading to elevated freight costs.

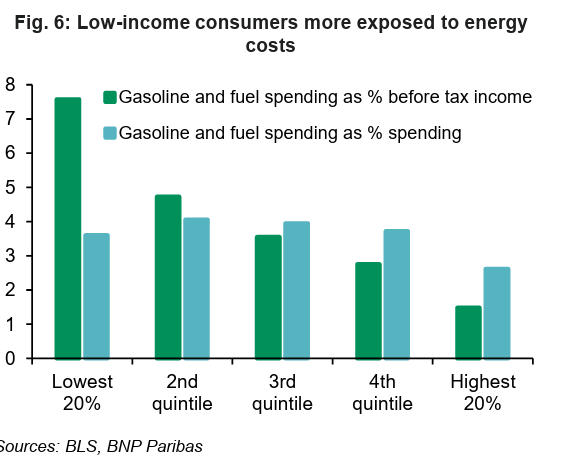
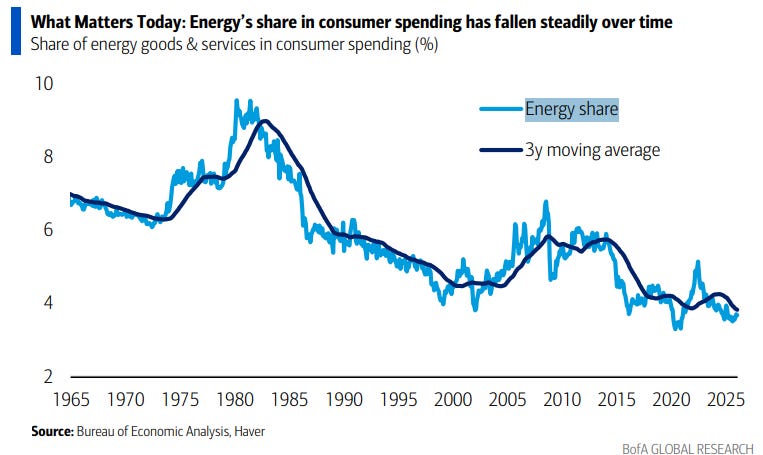
Interestingly, energy’s share of consumer spending has fallen over the past few decades and is now less than 5%.
However, the lowest 20% (bottom quintile) of consumers are the most affected by higher energy prices.
Unsurprisingly, Trump’s approval rating has plummeted to record lows.


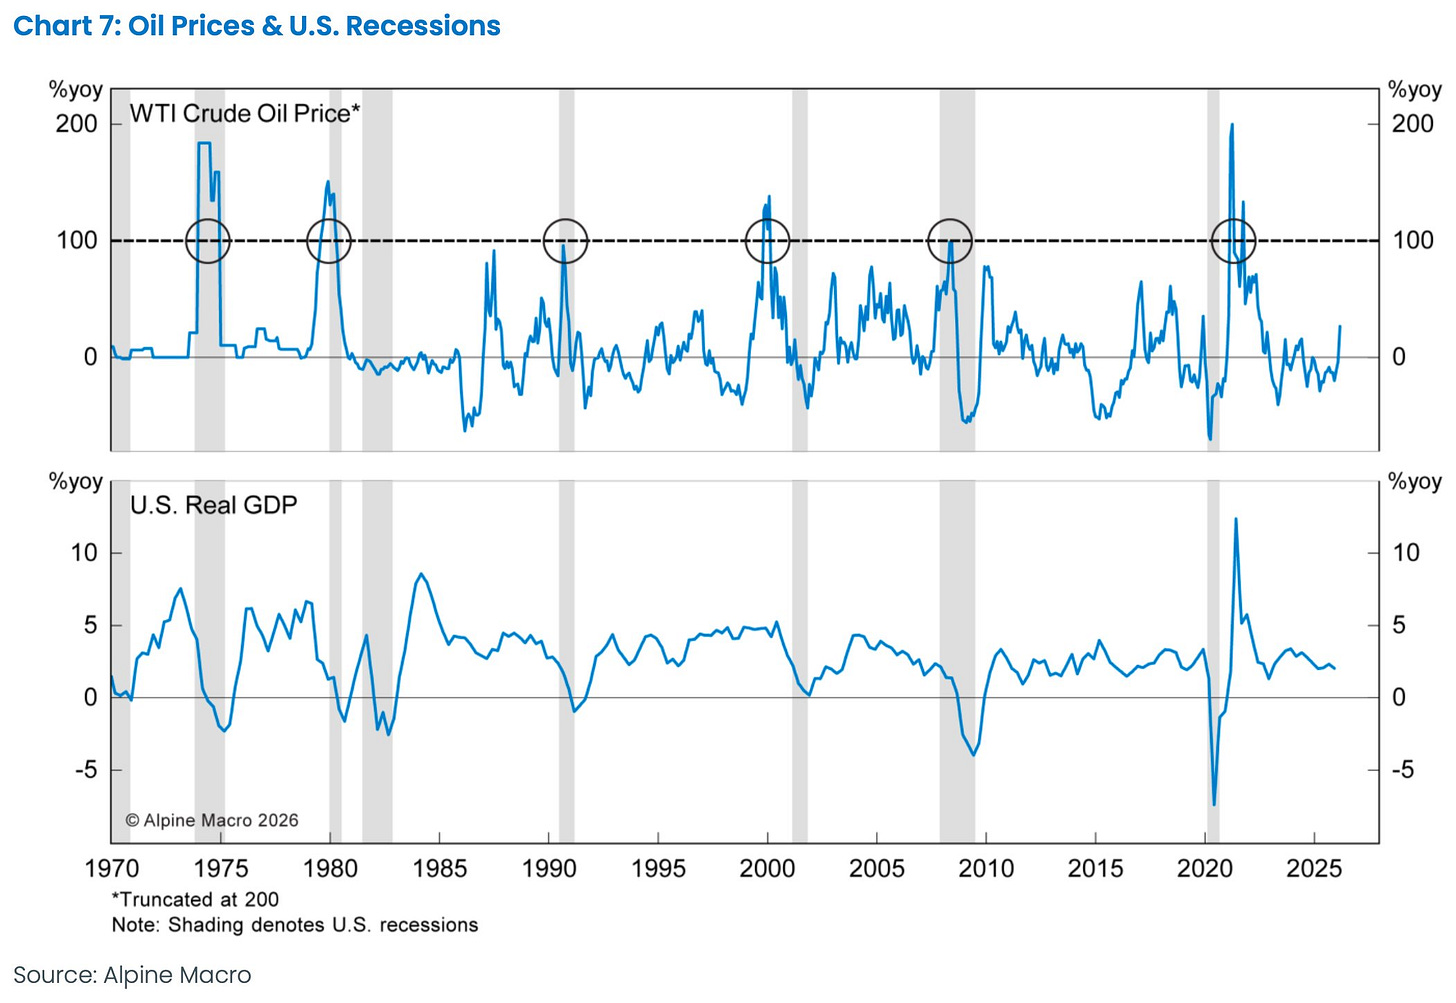
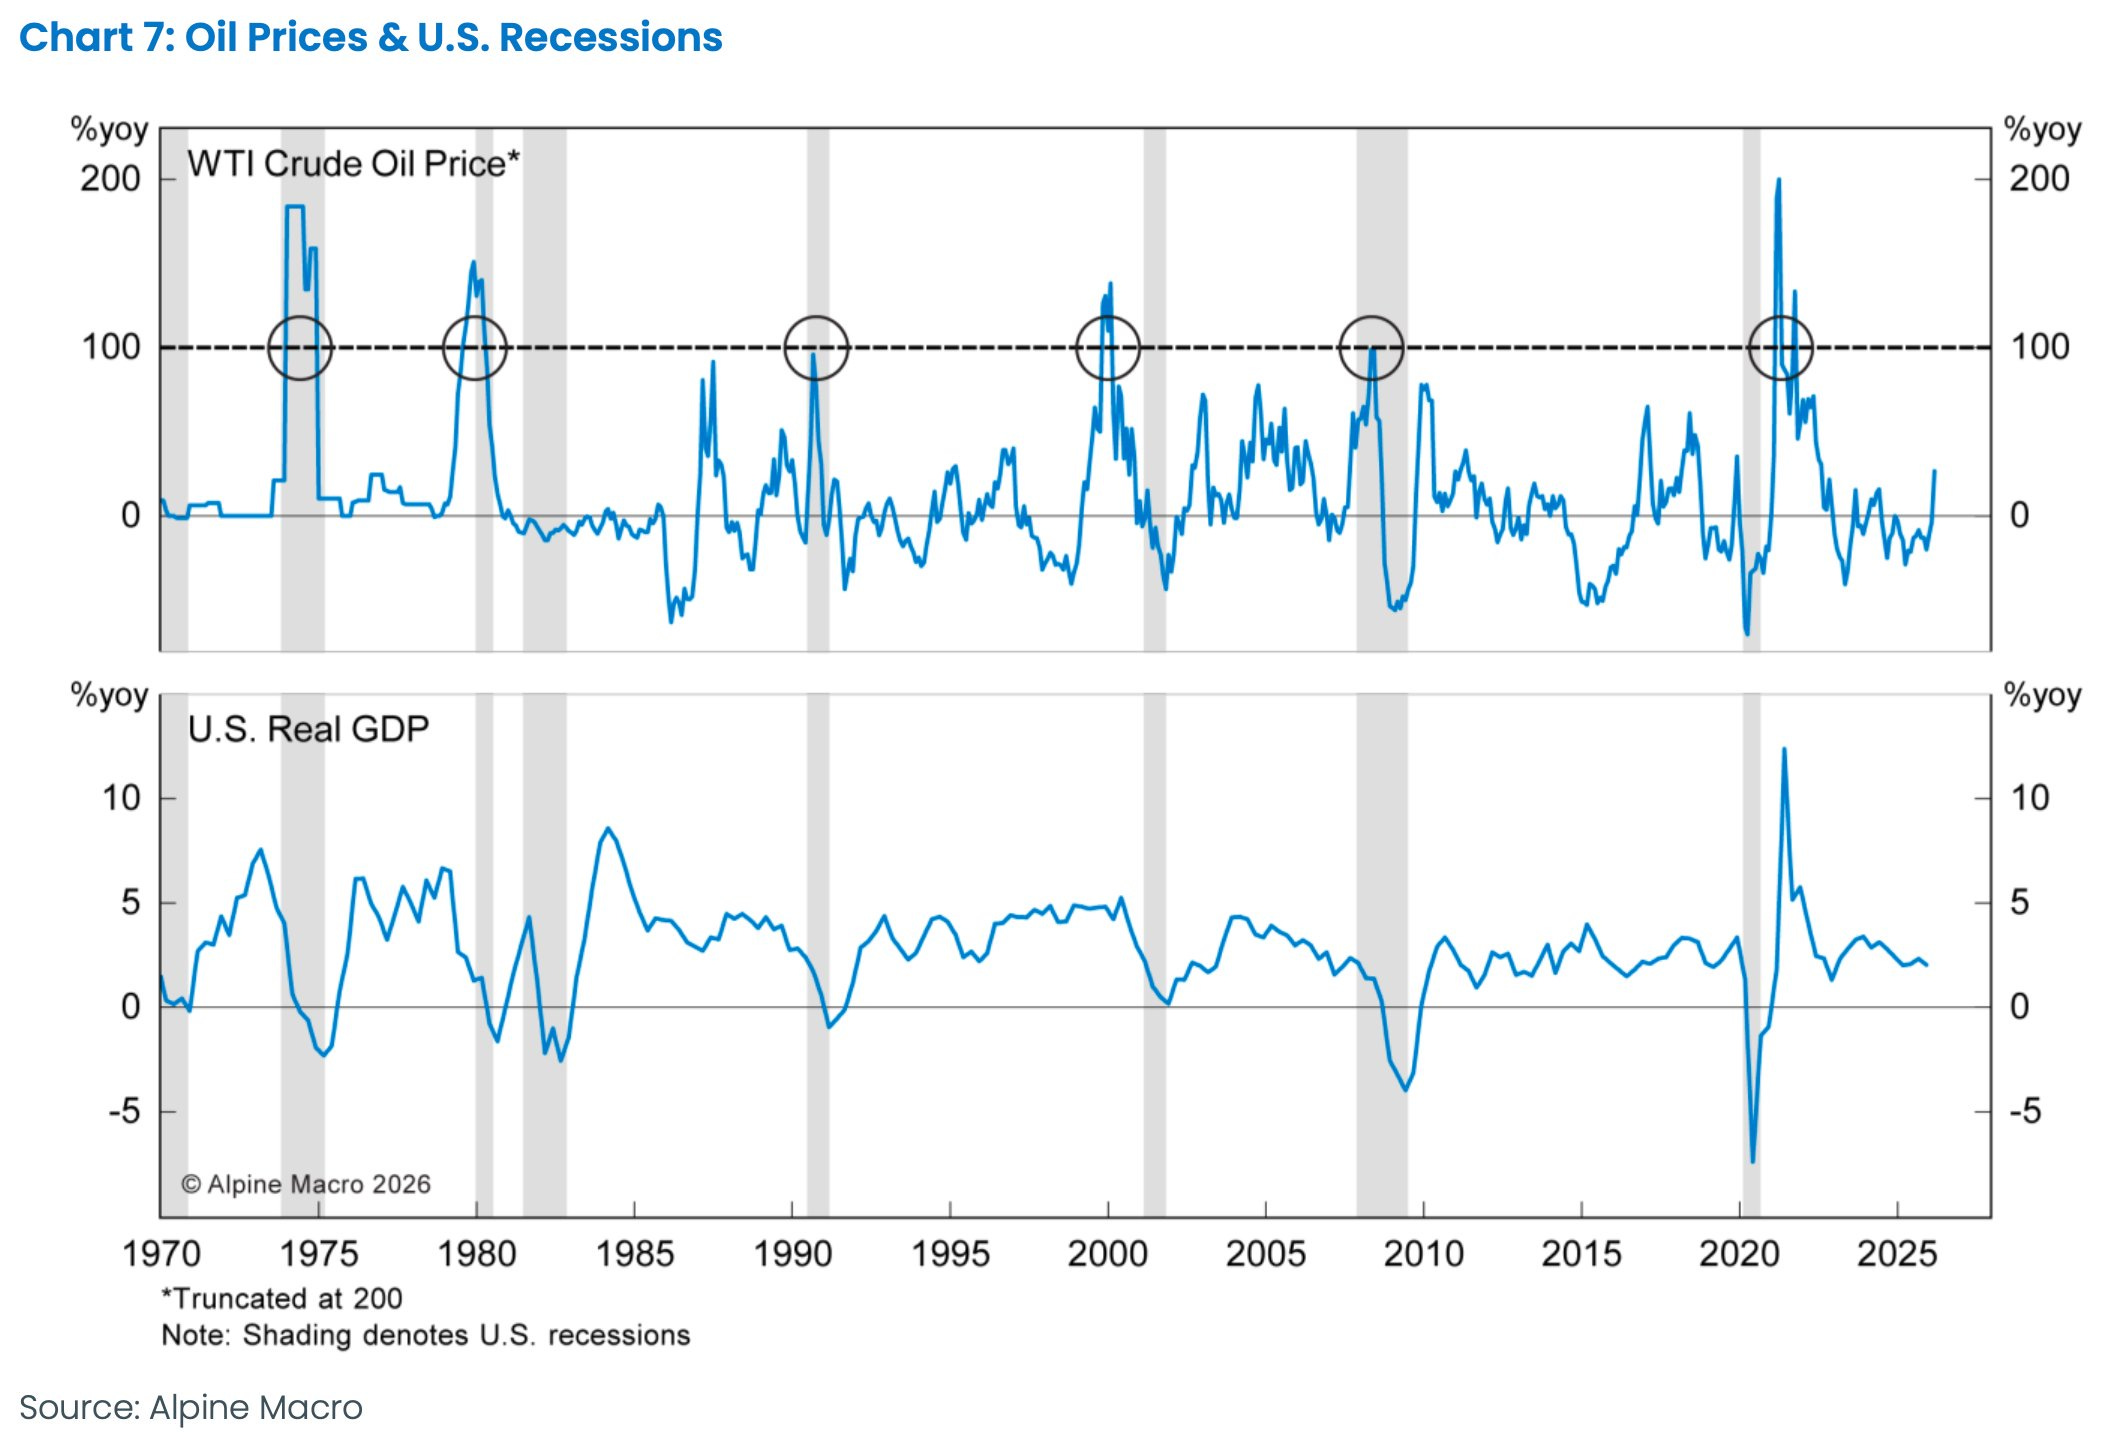
Consider it a coincidence, every US recession from the 1970s up to the Global Financial Crisis coincided with a doubling of oil prices.
The oil spike during the 2022 Russia–Ukraine conflict did not trigger a recession due to the fiscal impulse and pandemic savings; however, as you remember, economists also called for a recession in 2022.
Will we be second time lucky?
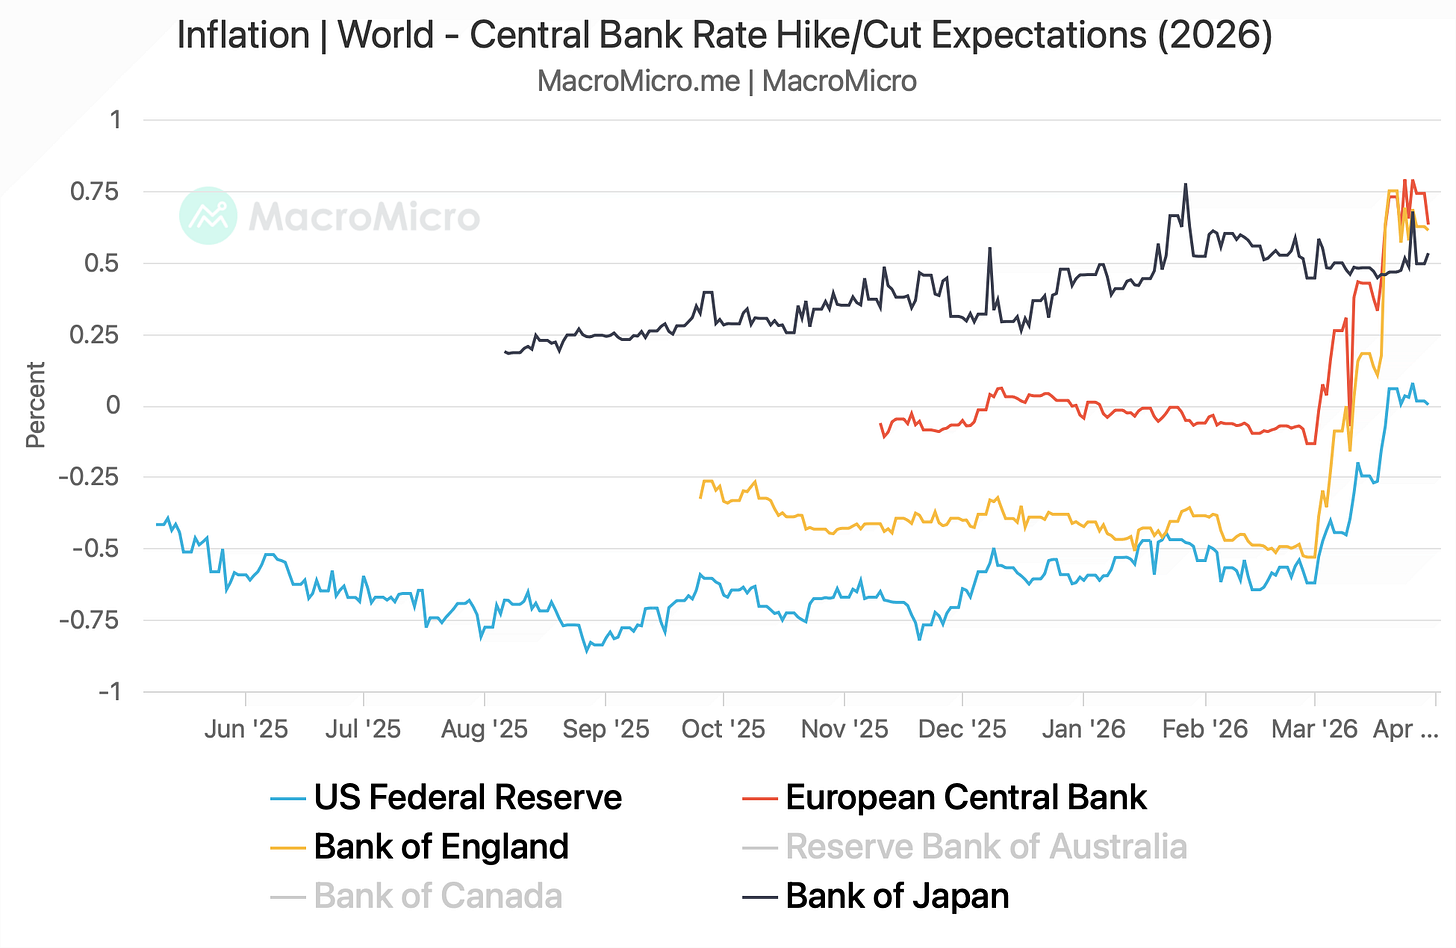
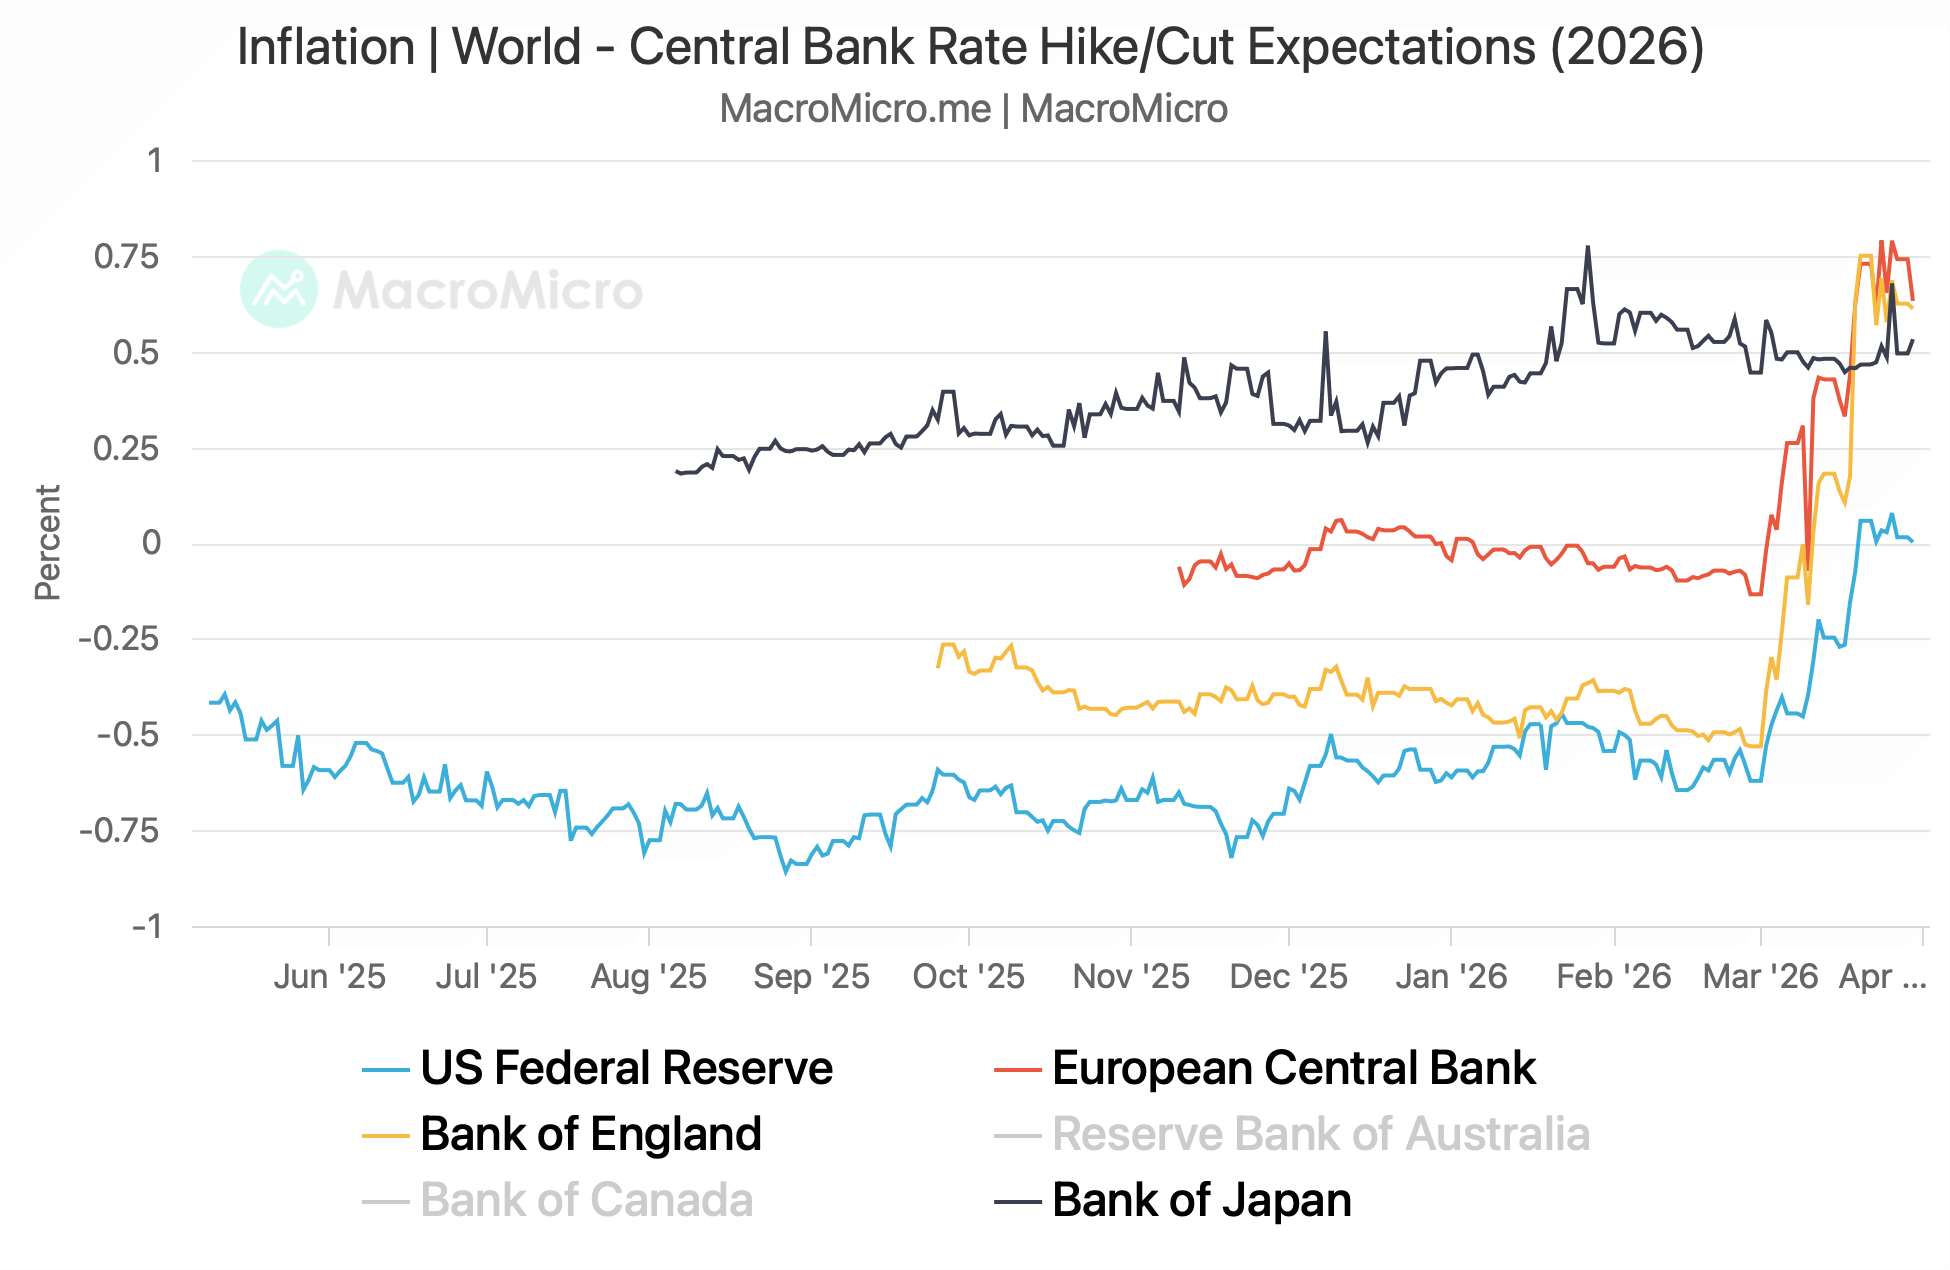
Thanks to the rise in energy prices, bond vigilantes wreaked havoc in the bond markets as Mr Market prices in a “RATE HIKE”.
The moves have been extremely aggressive, with markets pricing in more than an 80 bps hike by the ECB due to energy-induced inflation.
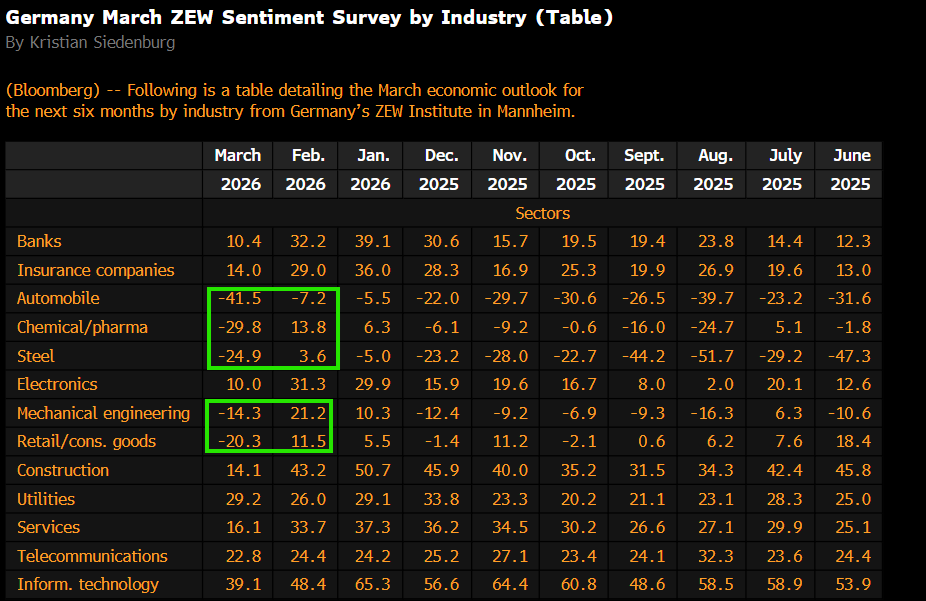
The war’s macroeconomic aftereffects were visible in Germany, with the latest ZEW Survey shocking the street. ZEW Economic Sentiment collapsed to the negative territory (-0.5) from 58.3 reported in February.
When we look at the internals, the manufacturing sector was responsible for the negative readings.
Furthermore, chemicals will be the worst hit in the coming months as supply chain disruptions lead to force majeure and production cuts.

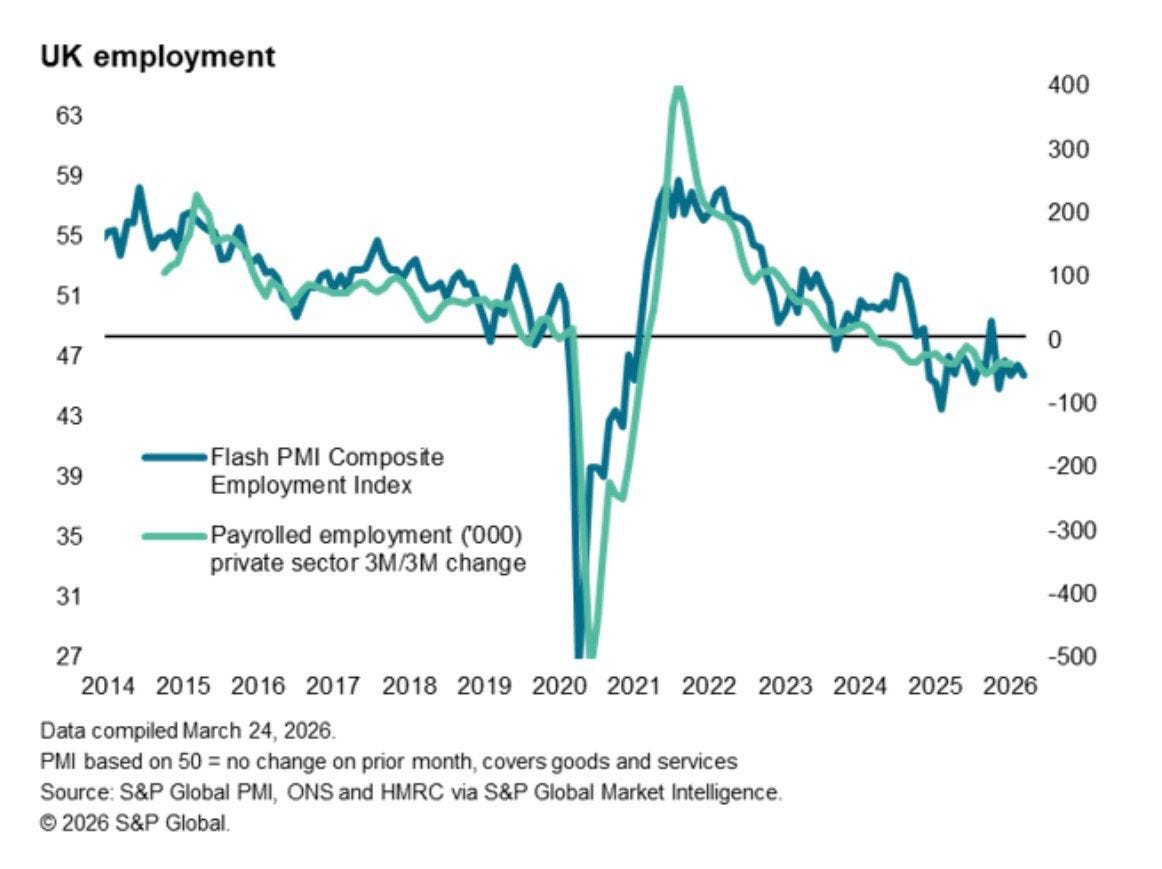
One of the biggest differences between the energy shocks of 2022 and 2026 is consumer health. Consumers were flush with excess savings accumulated during COVID-19 when the 2022 energy shock hit Europe.
However, the UK’s labour market is extremely weak today, and consumer health has deteriorated significantly.
Although markets are currently focused on the inflation shock, they have yet to fully price the potential growth shock.

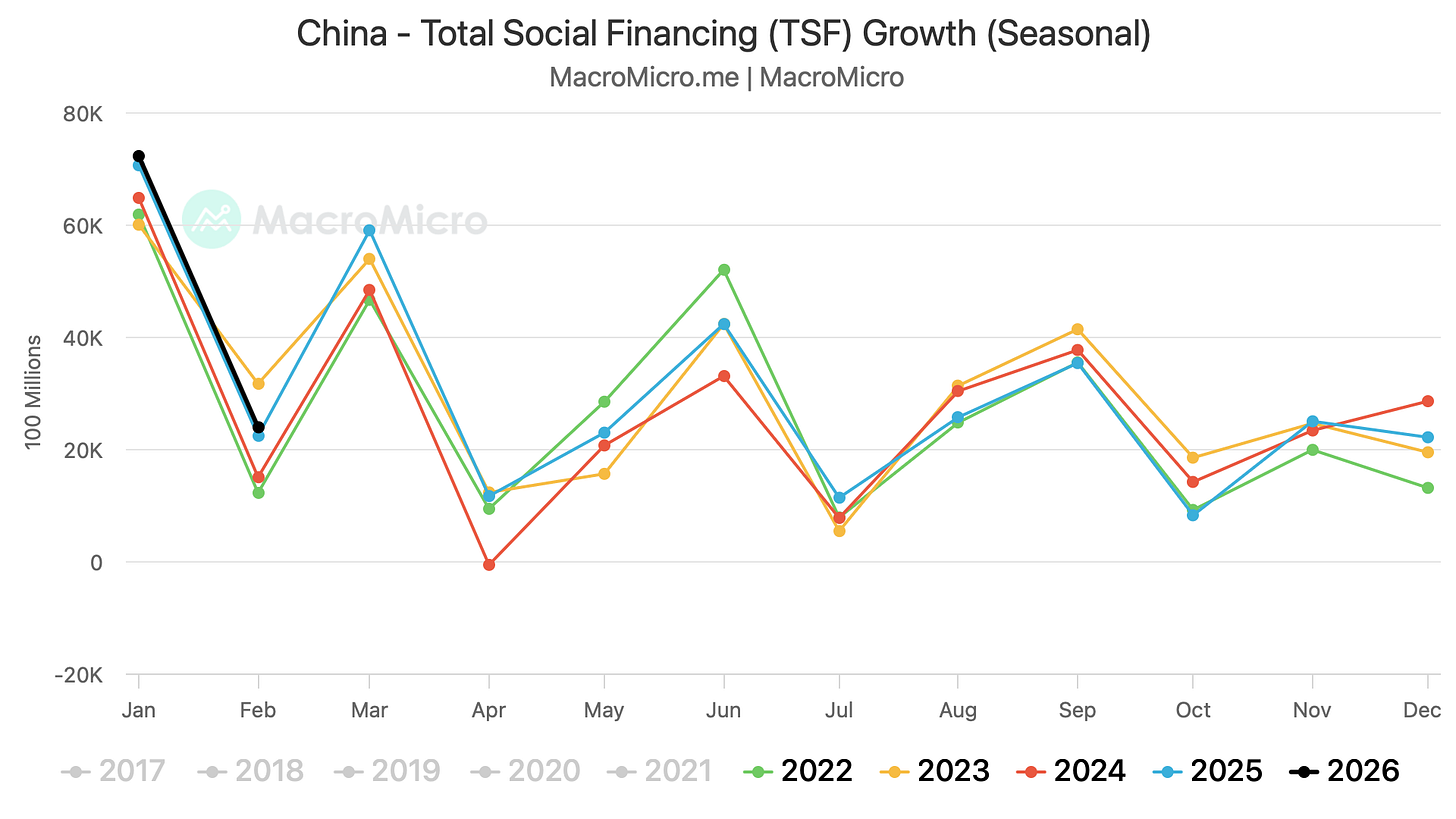
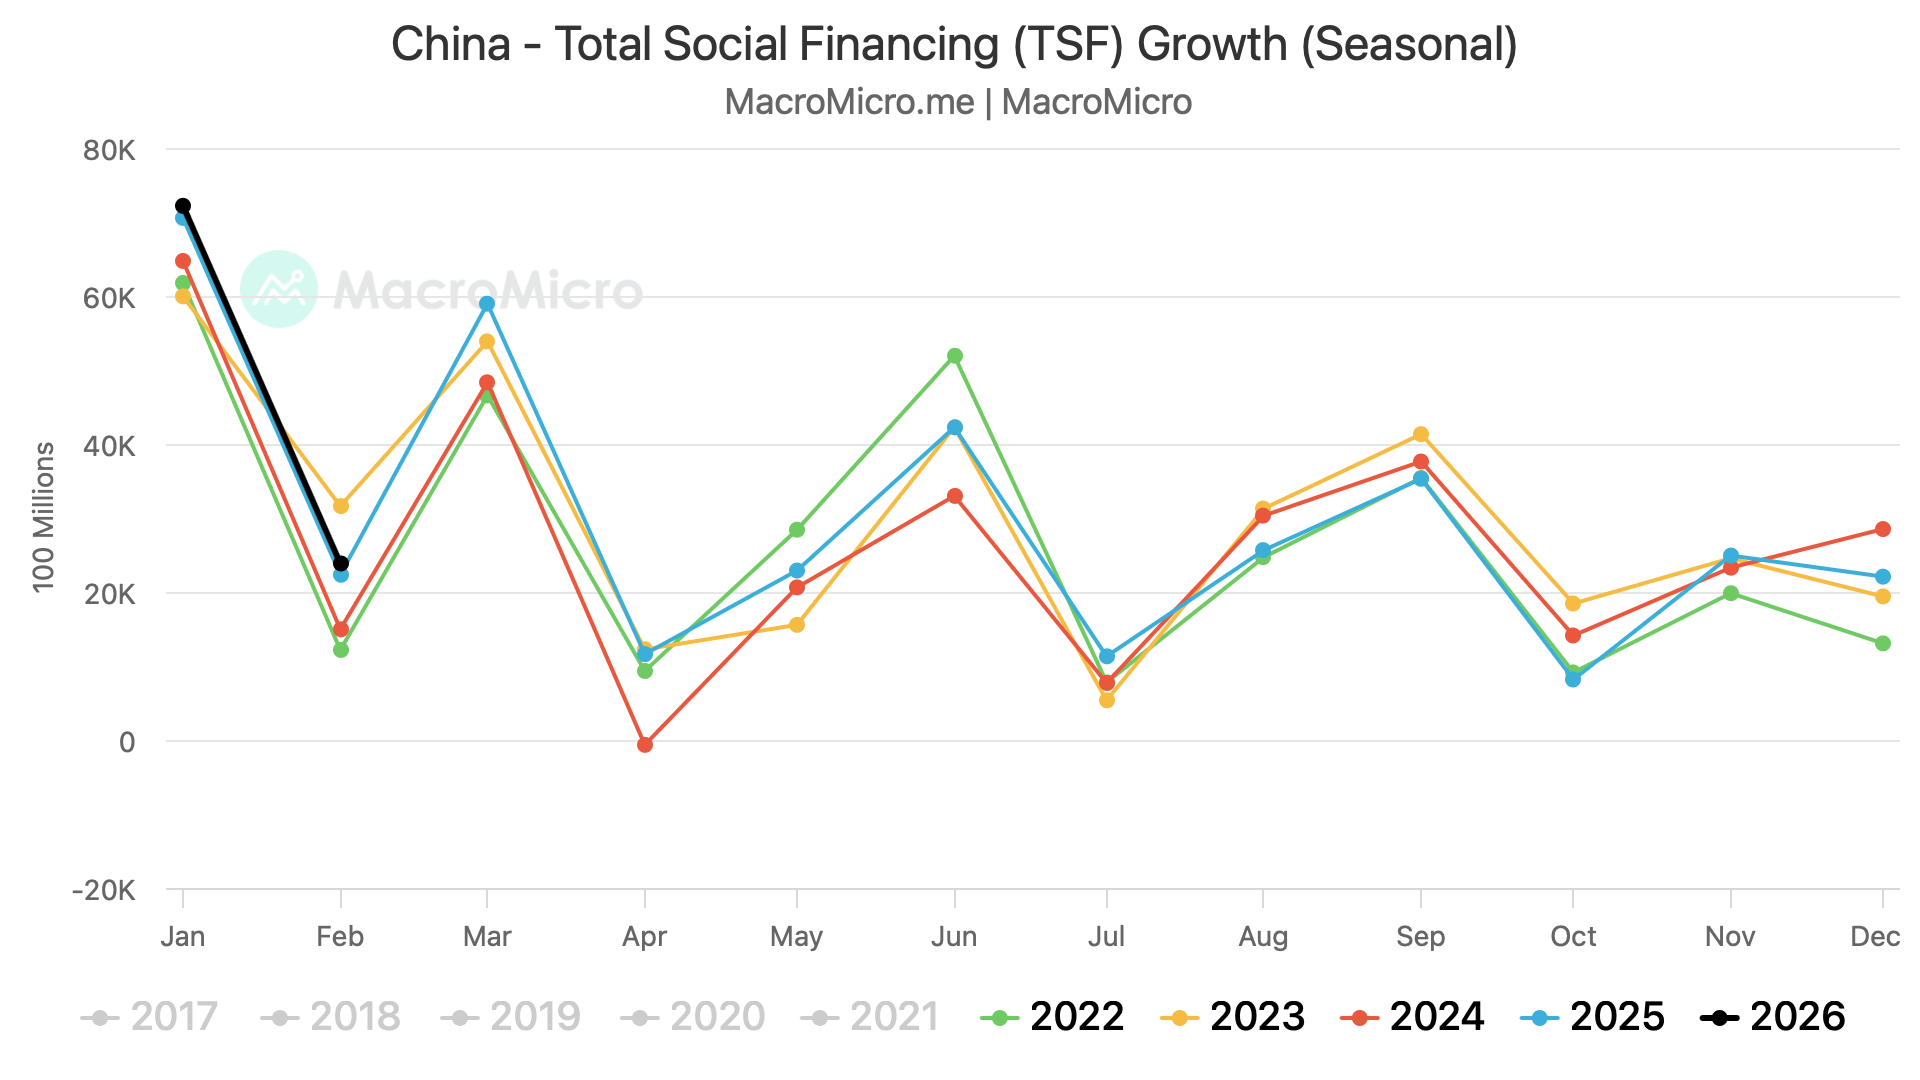
One of the data points we place a lot of weight on for China is Total Social Financing (TSF).
China’s banks extended 900 billion yuan ($130 billion) in new yuan loans in February, down from 4.71 trillion yuan in January and missing estimates.
PS: Total social financing growth typically shows seasonal increases at quarter-end.
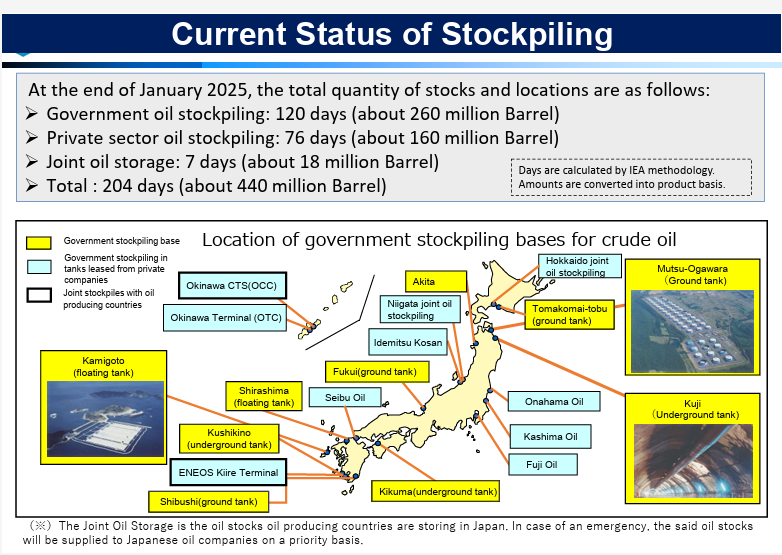
Two of the largest manufacturing giants in Asia, which depend on the Middle East for 80% of their needs, are Japan and South Korea.
Furthermore, Japan receives the majority of its oil imports via the Strait of Hormuz, but if it utilises its SPR (which it has announced), it can manage its oil needs for more than six months.

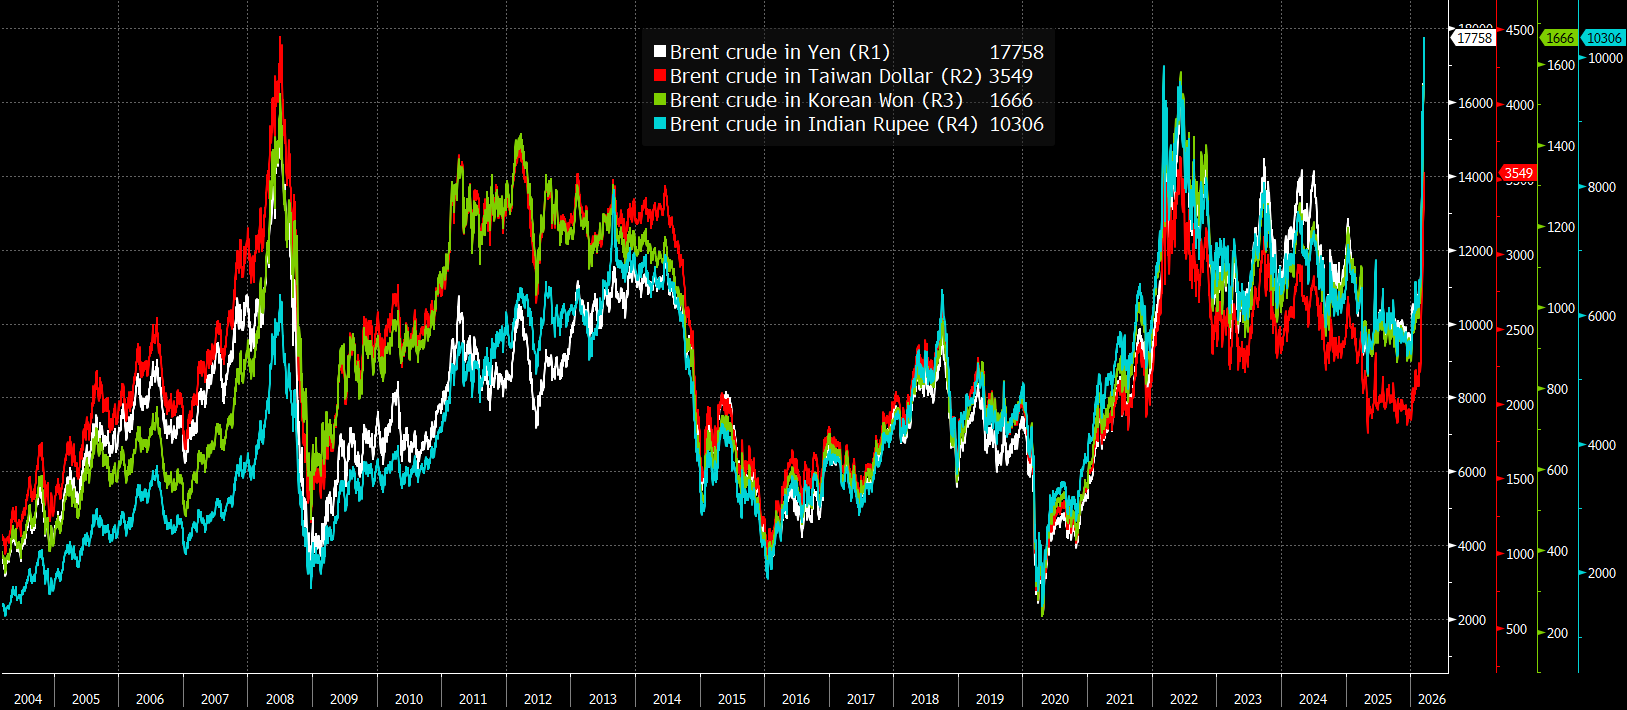
While Oil in $$$ (Brent) is still miles away from its 2008 ATH ($150), oil prices in local currency have surpassed their ATHs.
Ironically, except for the Taiwan Dollar ("heavily managed float"), among major non-China Asian economies, Brent crude has never been this expensive.
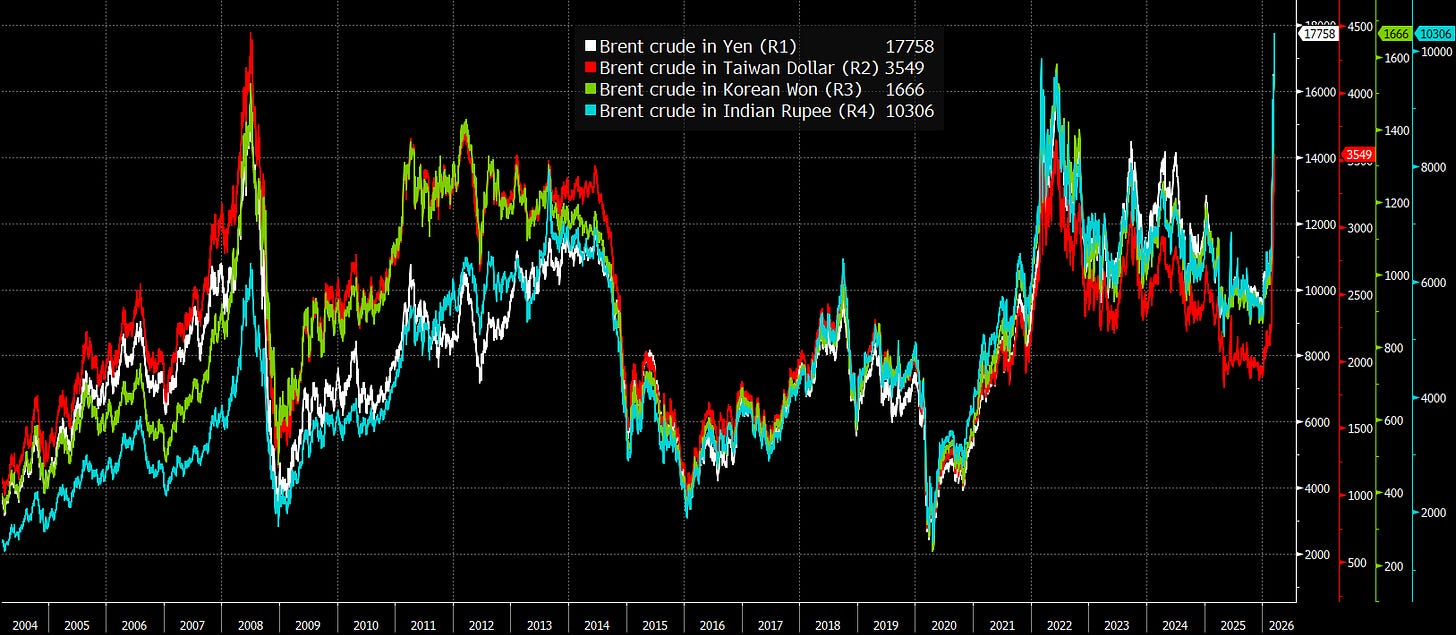
Source: BBG
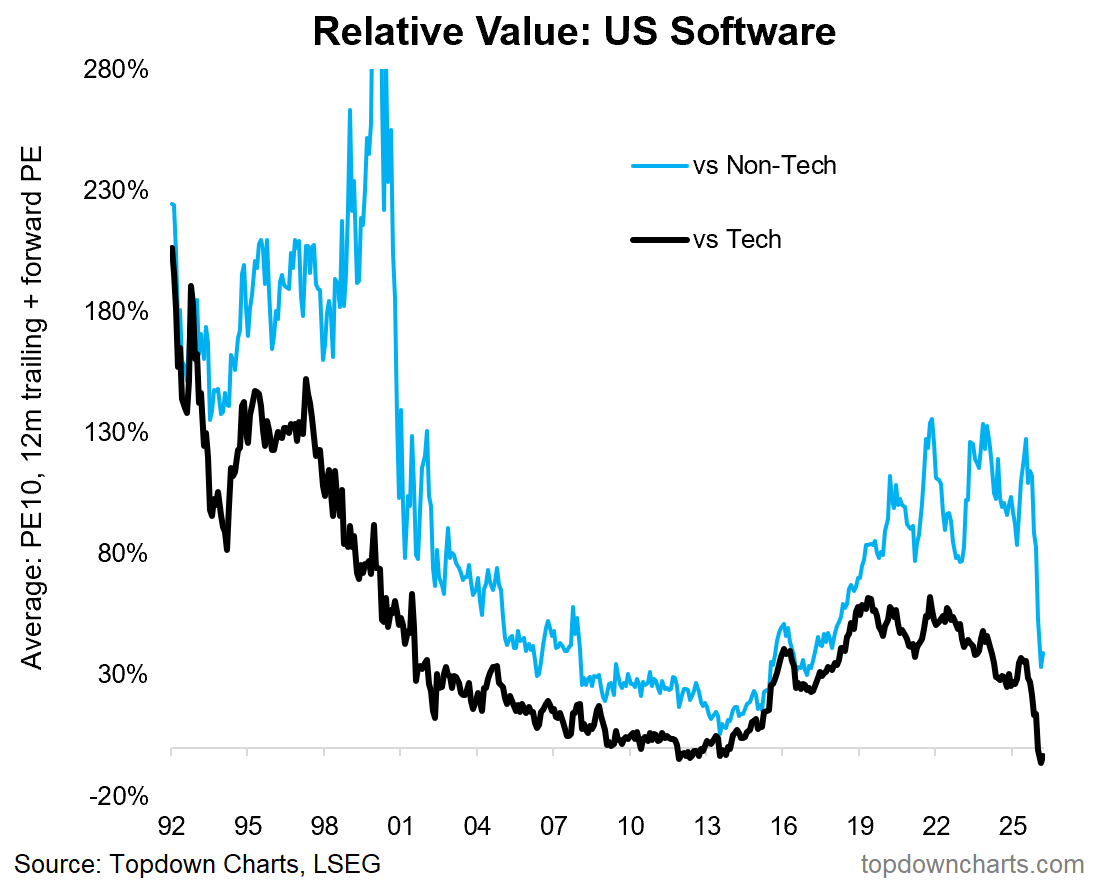
BONUS CHART: US software has witnessed a bloodbath as concerns rise post the release of Anthropic’s new models. As a result, US software v/s tech is now the cheapest on record.
Some of the companies are trading at valuations last witnessed in the GFC or Covid. Time for bargain hunting?

Disclaimer
This publication and its author are not licensed investment professionals. The author & any other individuals associated with this newsletter are NOT registered as Securities broker-dealers or financial investment advisors with the U.S. Securities and Exchange Commission, Commodity Futures Trading Commission, or any other securities/regulatory authority. Nothing produced under Marquee Finance by Sagar should be construed as investment advice. Do your research and consult with your certified financial planner or other dedicated professional before making any investment decisions. Investments carry risk and may lose value; Marquee Finance By Sagar LLC, Marqueefinancebysagar.substack.com or Sagar Singh Setia is not responsible for loss of value; all investment decisions you make are yours alone