

November saw a major scare as the AI story got an intriguing twist.
Sam Altman hinted that the Federal Government should backstop trillions of dollars of AI Investments.
Furthermore, the private credit scars from “cockroaches” were still afresh in investors’ minds.
As a result, we saw more than a 5% fall in the benchmark US indices, led by AI names.
Let’s examine 14 charts to analyse the global macro and cross-asset movements in the global financial markets.
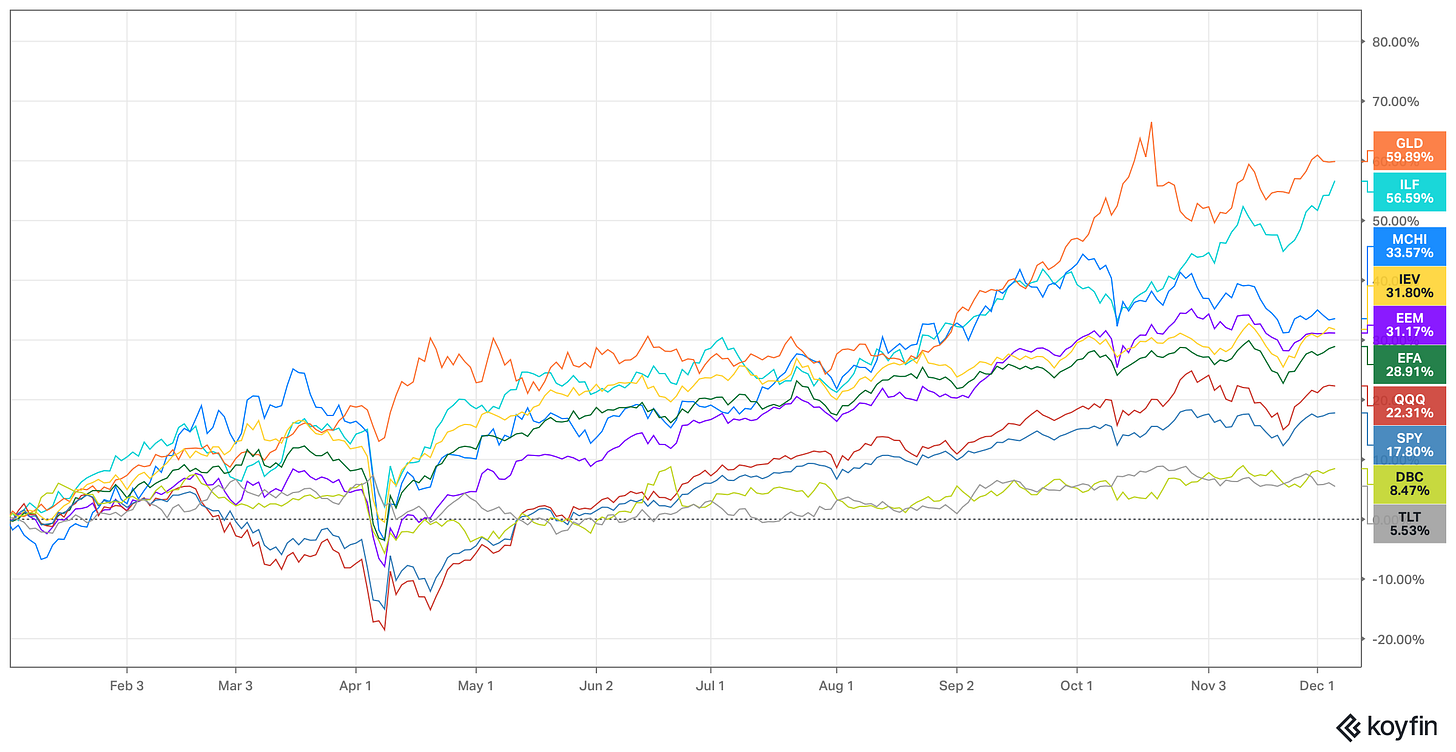
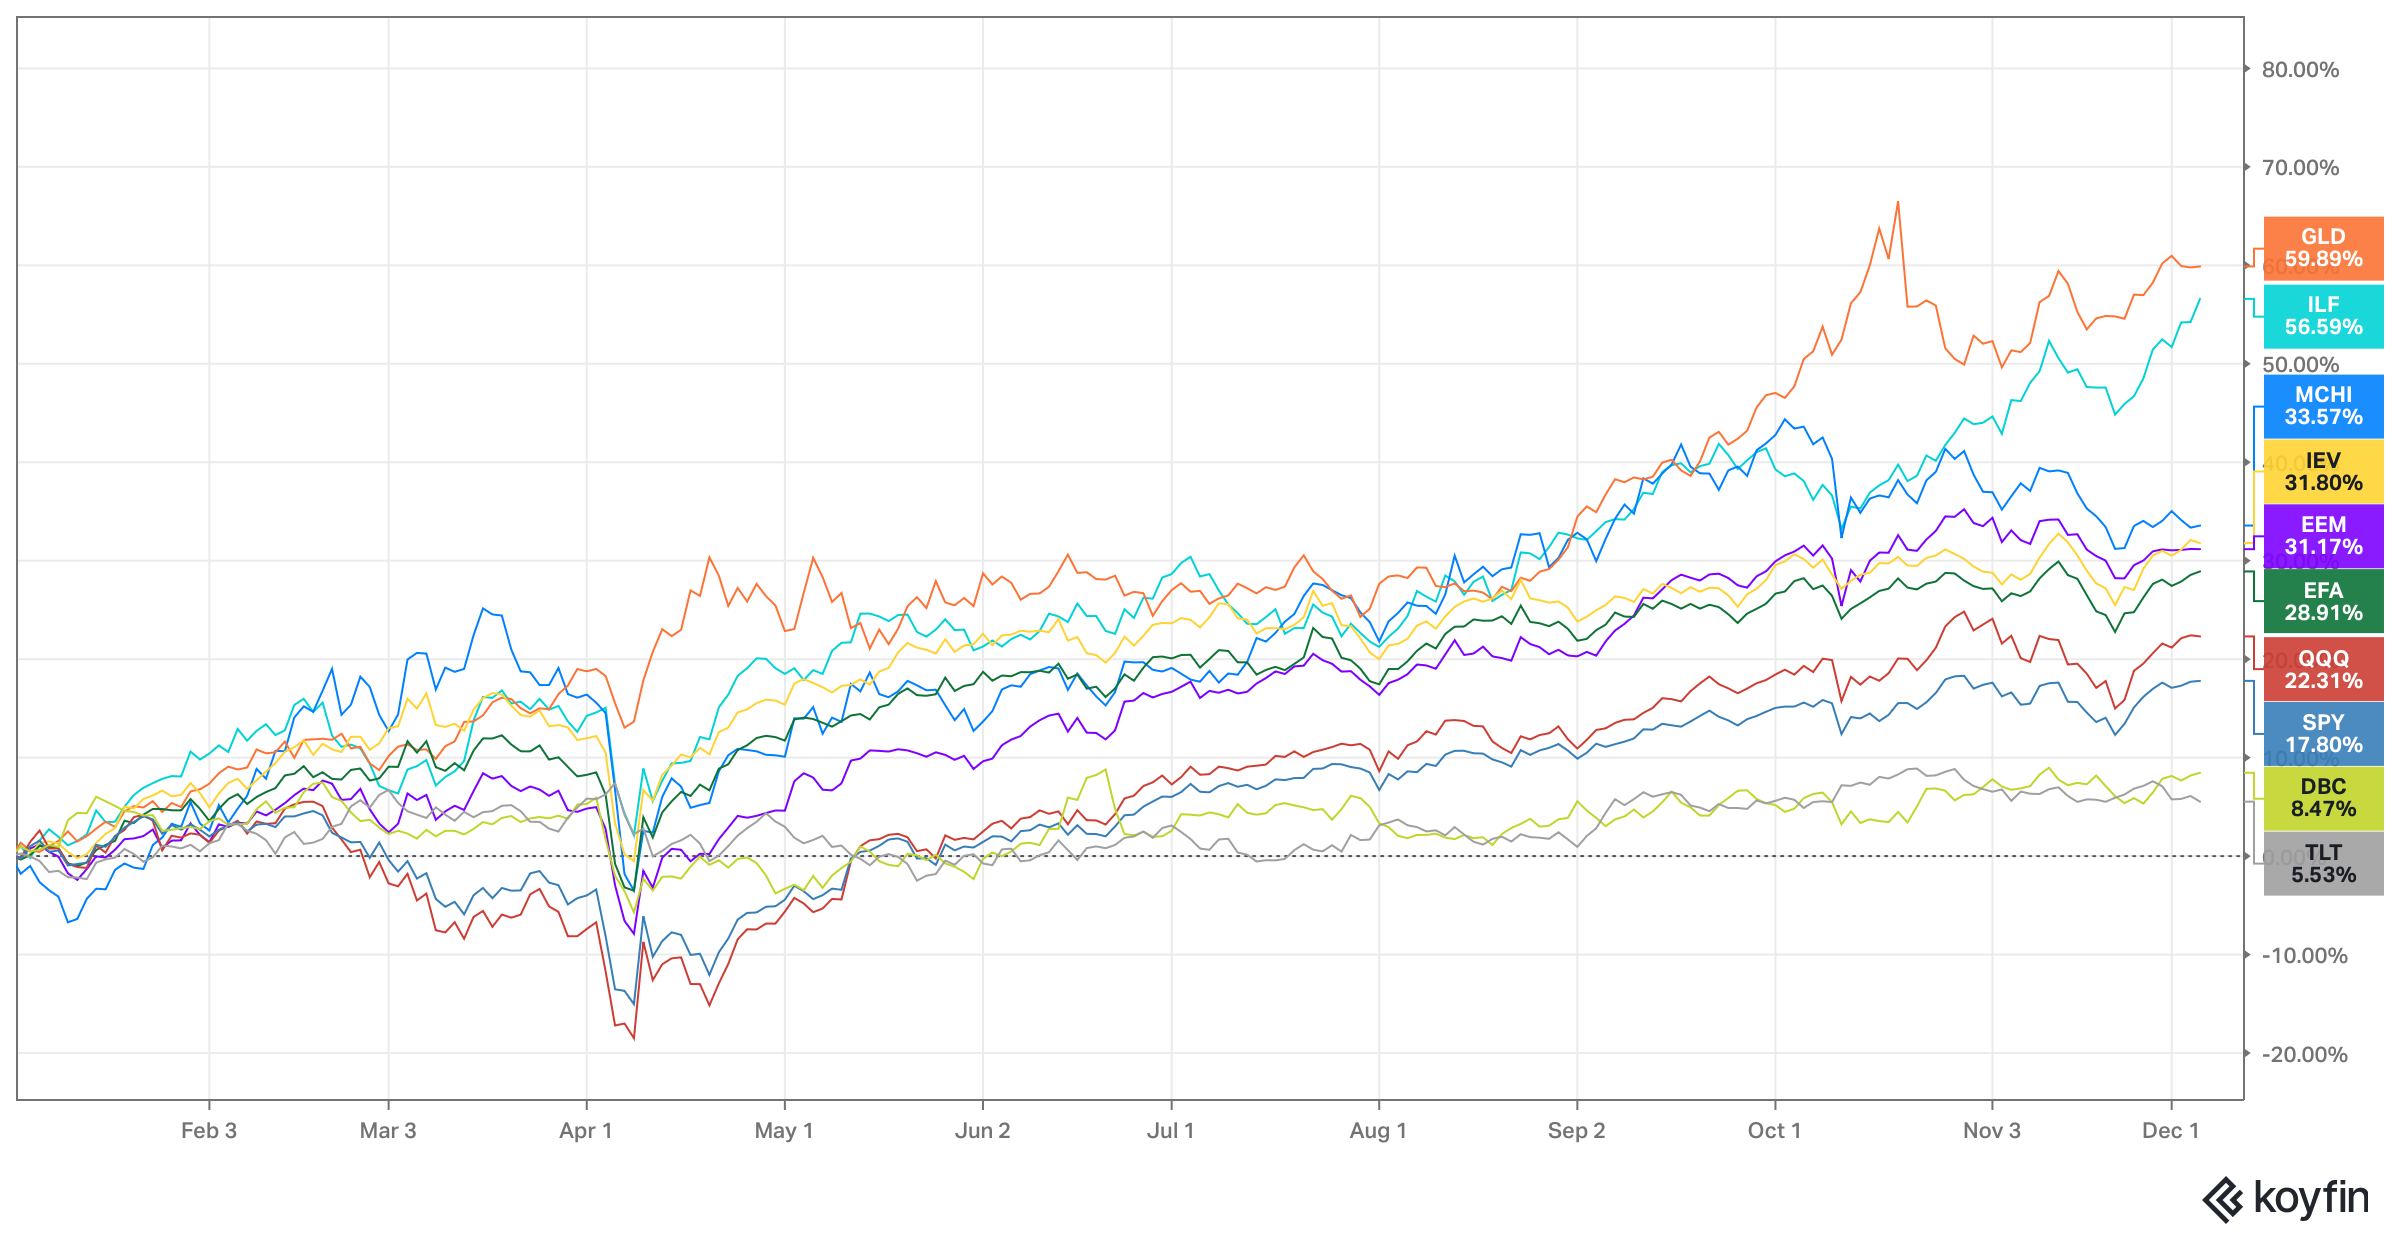
Gold is on track to have its best year since the 1970s. Furthermore, the shiny yellow metal is at the top of the list with 60% YTD returns.
As right-wing renaissance sweeps LATAM, the equity markets are cheering the political transition. As a result, the benchmark ILF ETF is up 57% YTD.
Despite macro challenges and a trade war, Chinese equity markets, for the second consecutive year, continue to outperform their developed-market peers. Overall, the Emerging Market ETF EEM is up 31% YTD compared to IEV (Europe) 32%.
Despite AI bubble fears, the US remains a stark underperformer with the S&P 500 sup only 18% YTD (S&P 500).
Due to various headwinds, long-term bonds remain the biggest underperformers, with the flagship TLT up only 5.5% (total return).
Commodities (ex-PMs) have also lagged, as oil has been in a bear market.
Due to structural reasons, the neutral rate is now expected to be significantly higher than the pre-COVID era. As a result, bonds fail to provide the cushion that they used to in an equity drawdown (60/40 PF).
Nevertheless, bond allocations reached major lows at both the last two major stock market peaks (2000, 2007) and served as bear-market harbingers.
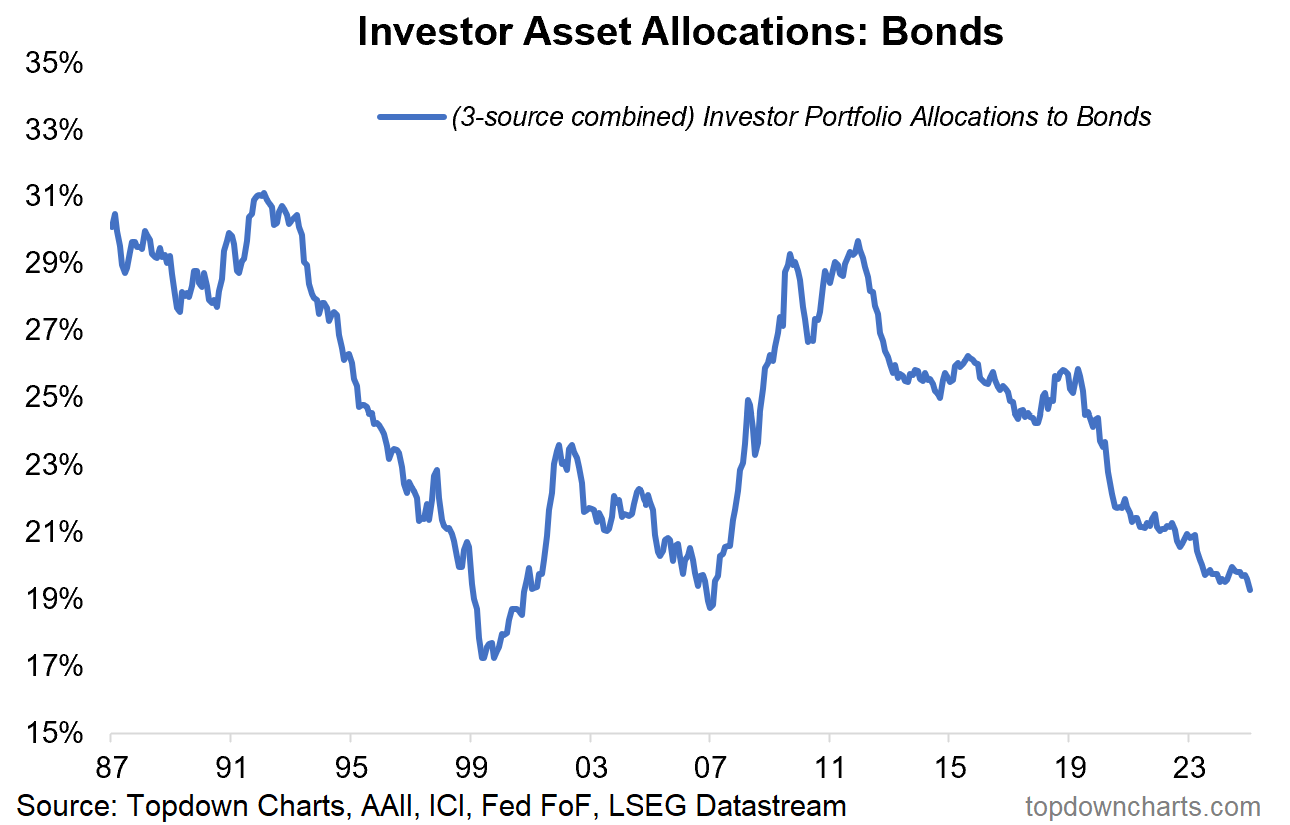
Source: Topdowncharts.com

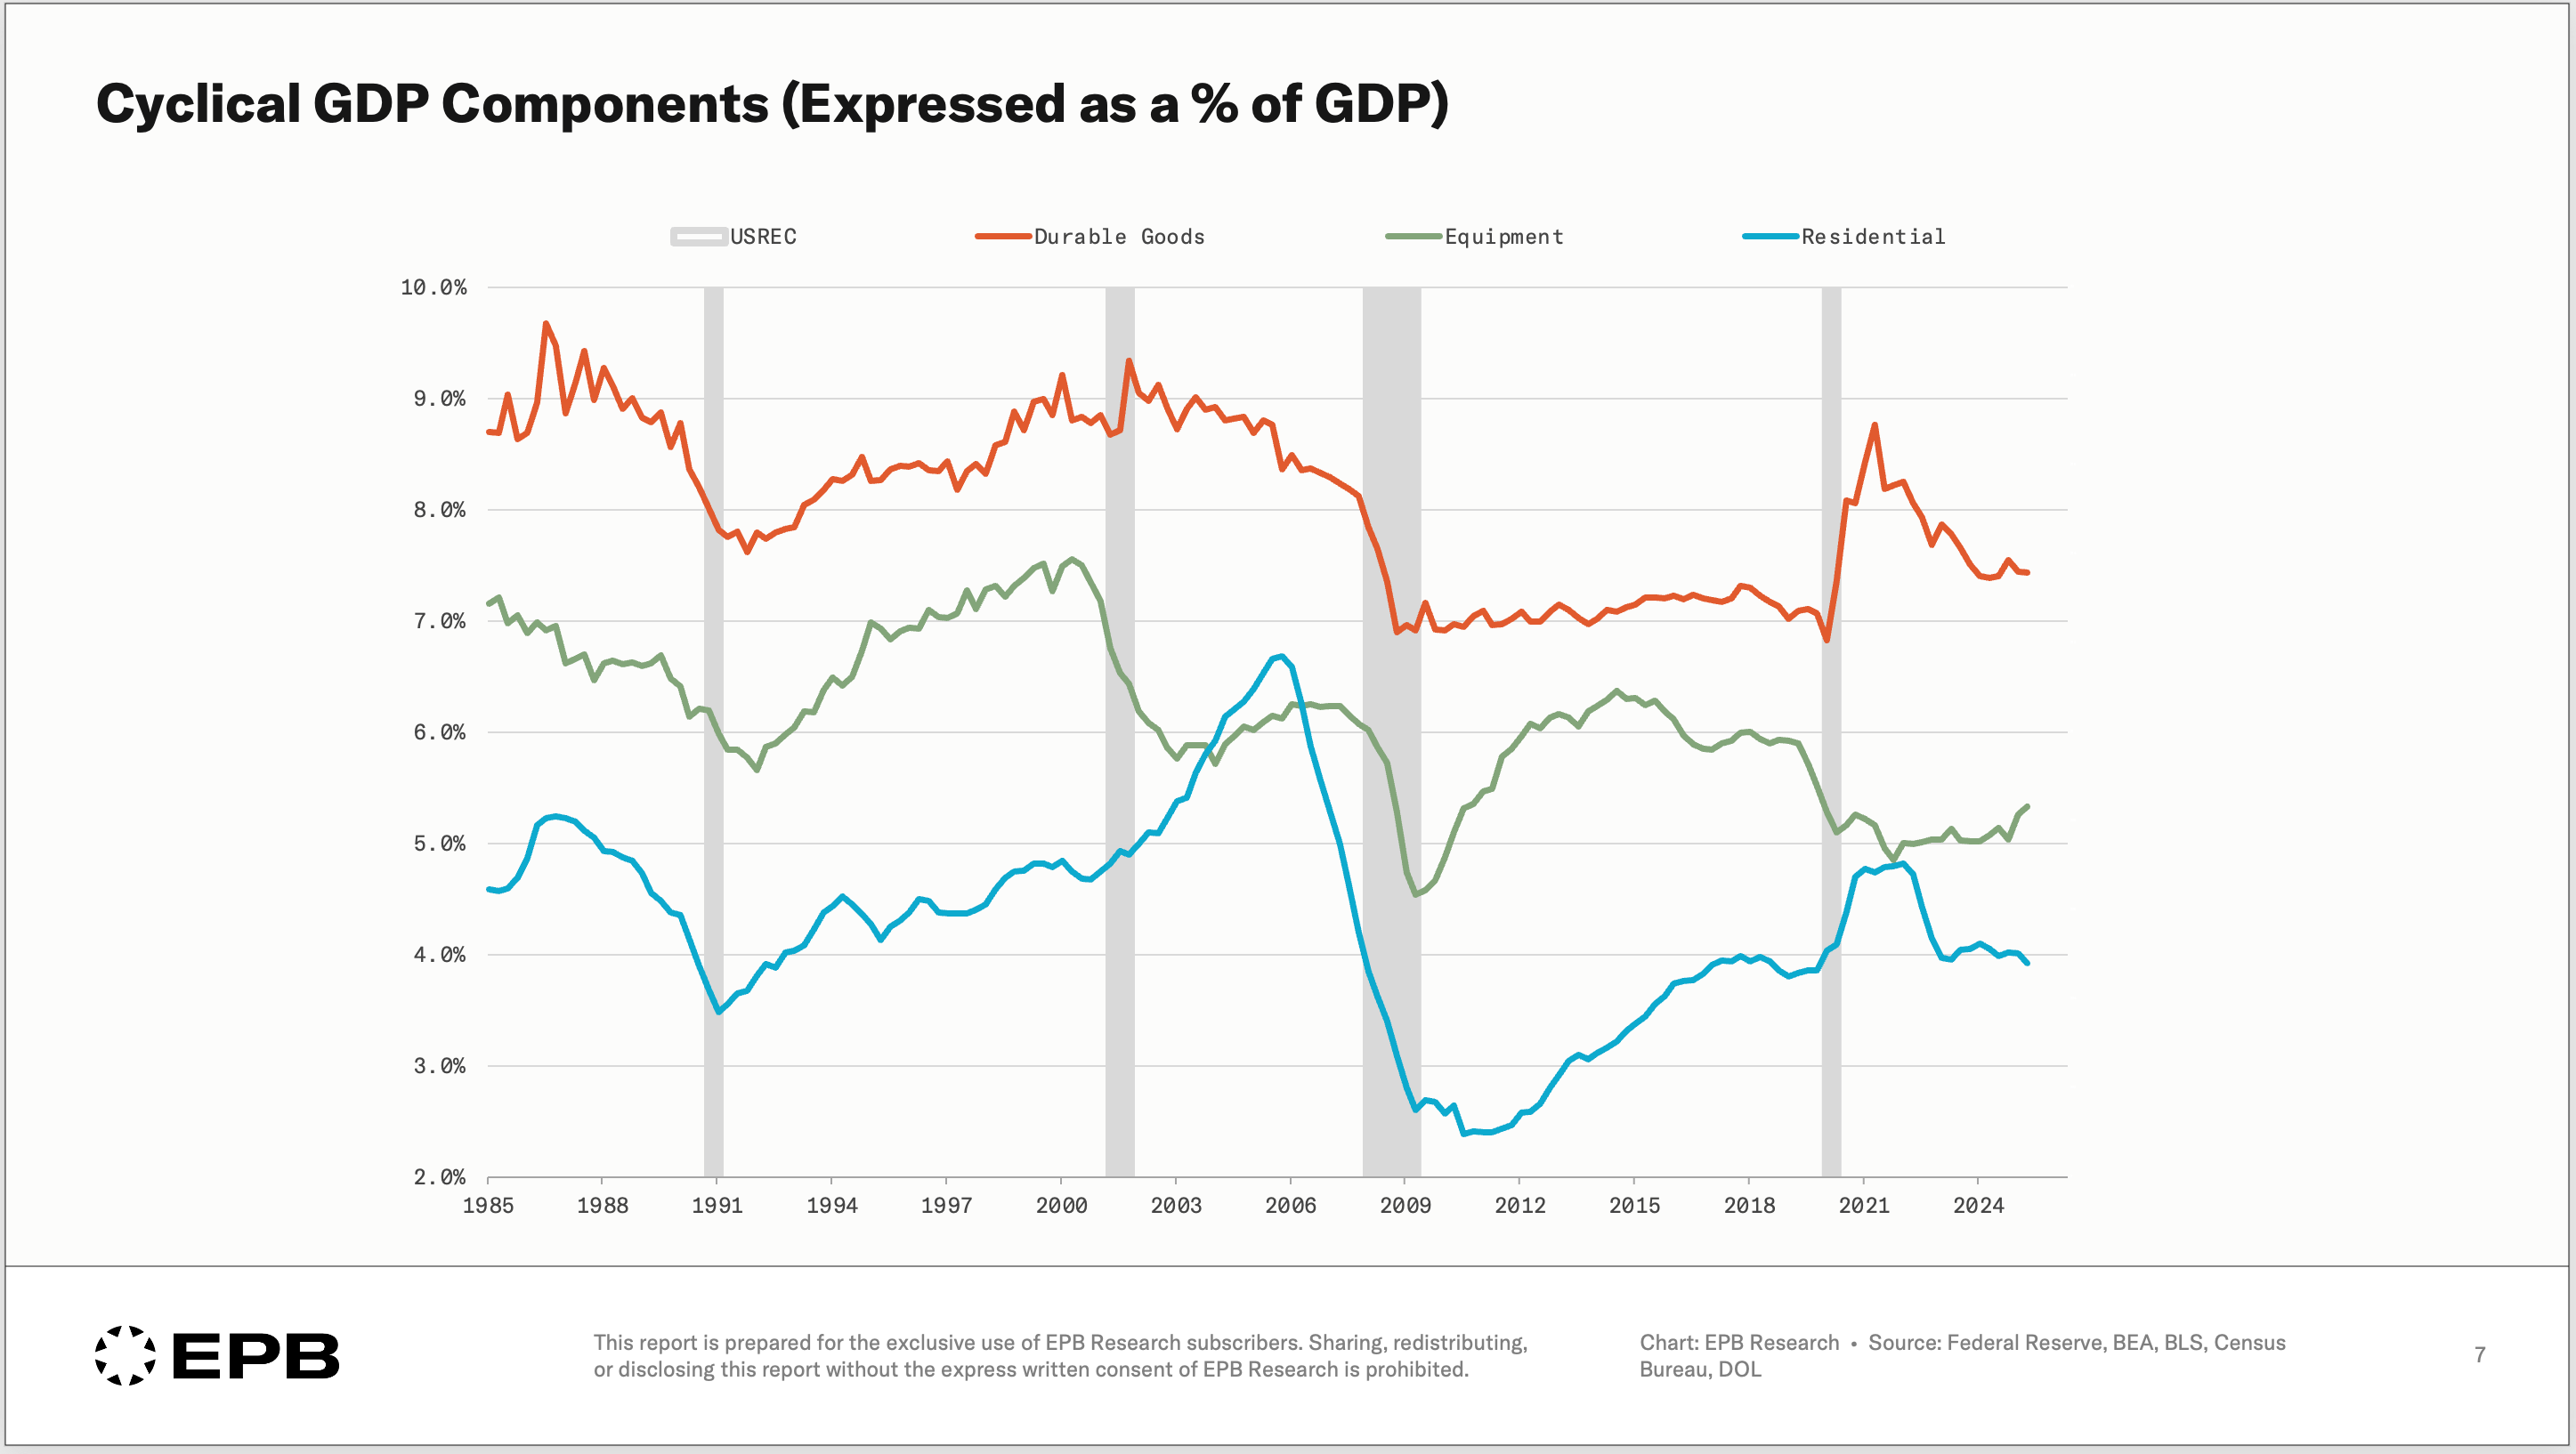
An intriguing divergence is observed when we dig deeper into the cyclical GDP components (responsible for a recession).
During the 2001 recession, we saw a massive decline in equipment as the dot-com bubble burst, leading to a sharp drop in tech capex. Today, we are witnessing the opposite: residential (housing) is gradually contracting, while AI capex is driving a surge in equipment.

Source: EPB Macro
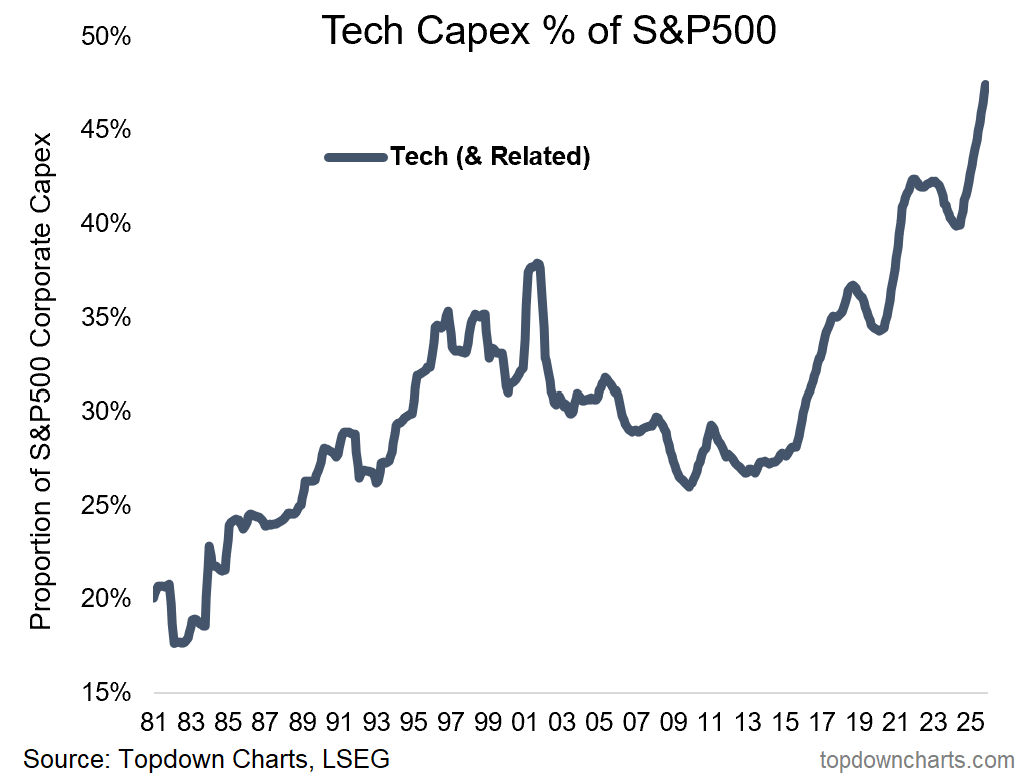
The AI capex, which has raised concerns in the investment community due to its circular nature, has seen a parabolic rise and now accounts for nearly half of the total capex of S&P 500 companies.
Thus, unsurprisingly, the AI-related names have been the drivers of the mega bull market since the launch of ChatGPT.

Source: Topdowncharts.com
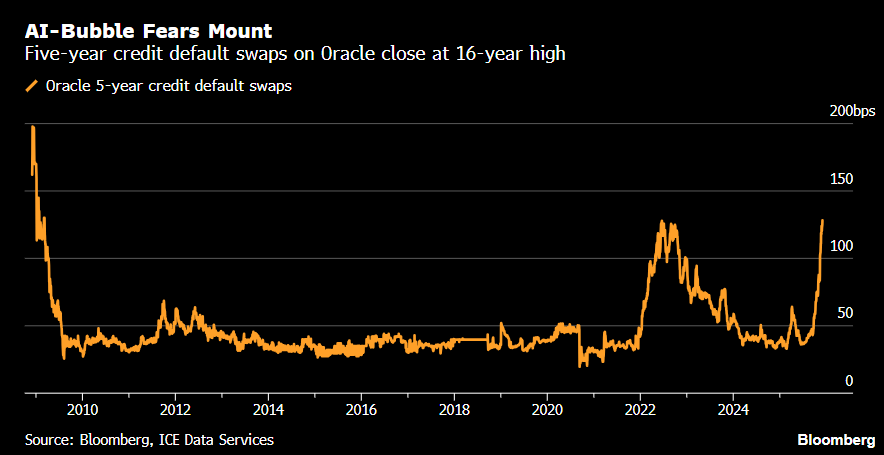
Initially, AI CAPEX was funded by equity; however, we are now witnessing a significant rise in debt issuance by companies engaged in the AI race, especially in data centres.
As a result, investors have been buying insurance (CDS) to hedge their AI exposure, thereby raising CDS prices for highly leveraged names such as Oracle.

Source: BBG
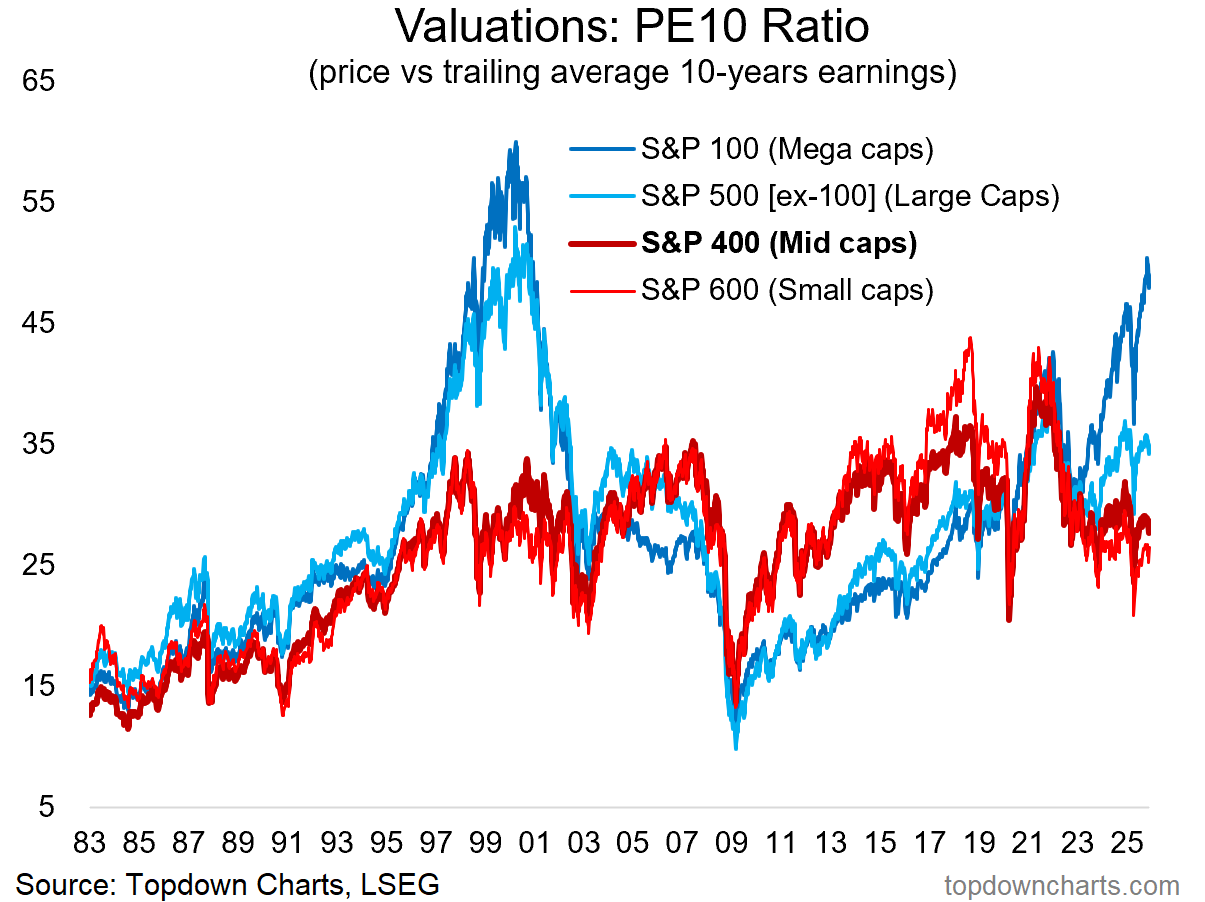
When we leave the large-cap AI names, the market internals paint a very different picture.
Midcaps and Small caps are reasonably valued compared to mega caps or large caps.

Coming to the labour markets, we are witnessing stress building up as the unemployment rate reached a fresh cycle high in the latest NFP reading (September).
As the layoffs rise due to AI-related productivity gains, the job gains are on a gradual decline, as often seen before past recessions.
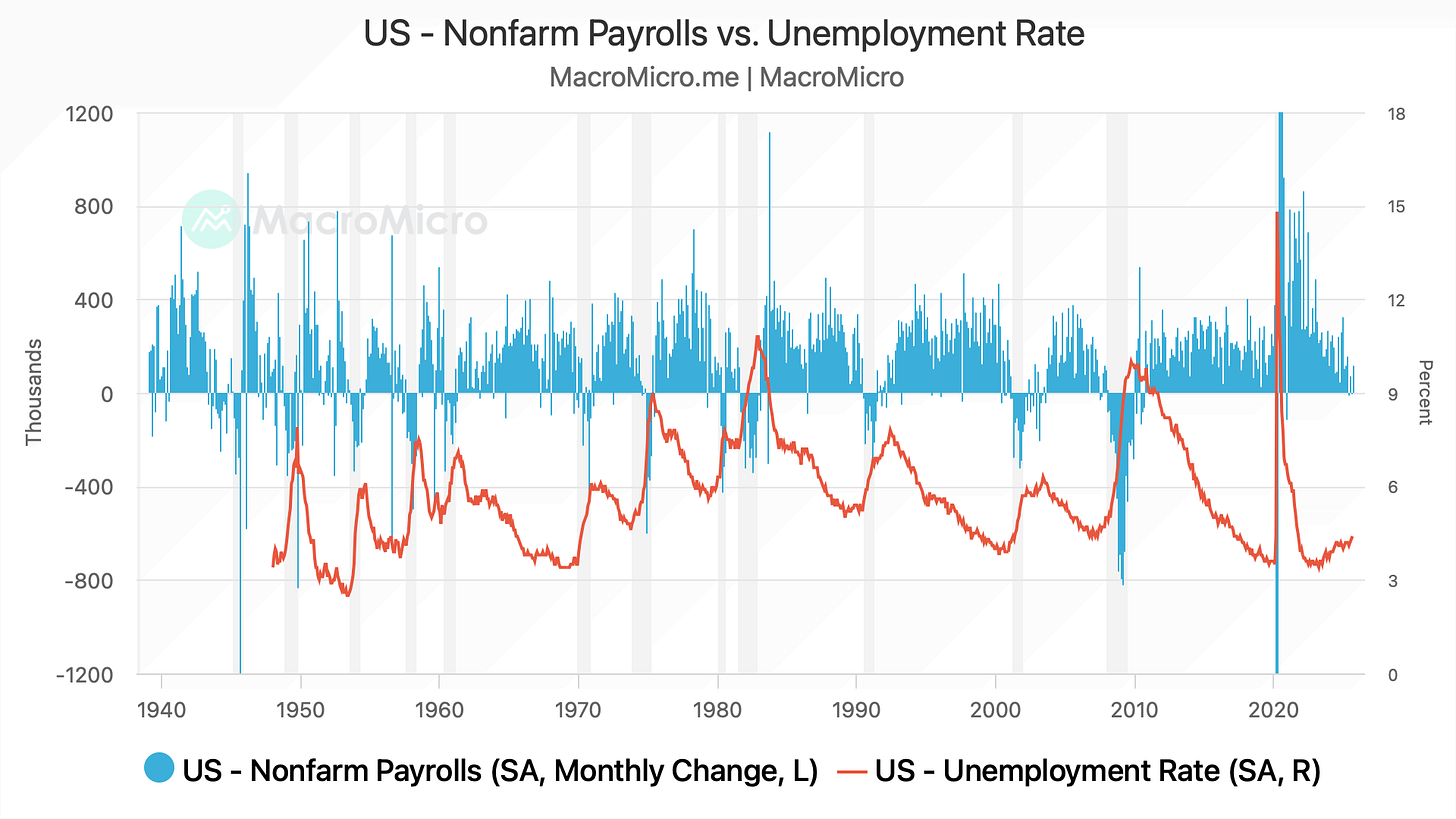
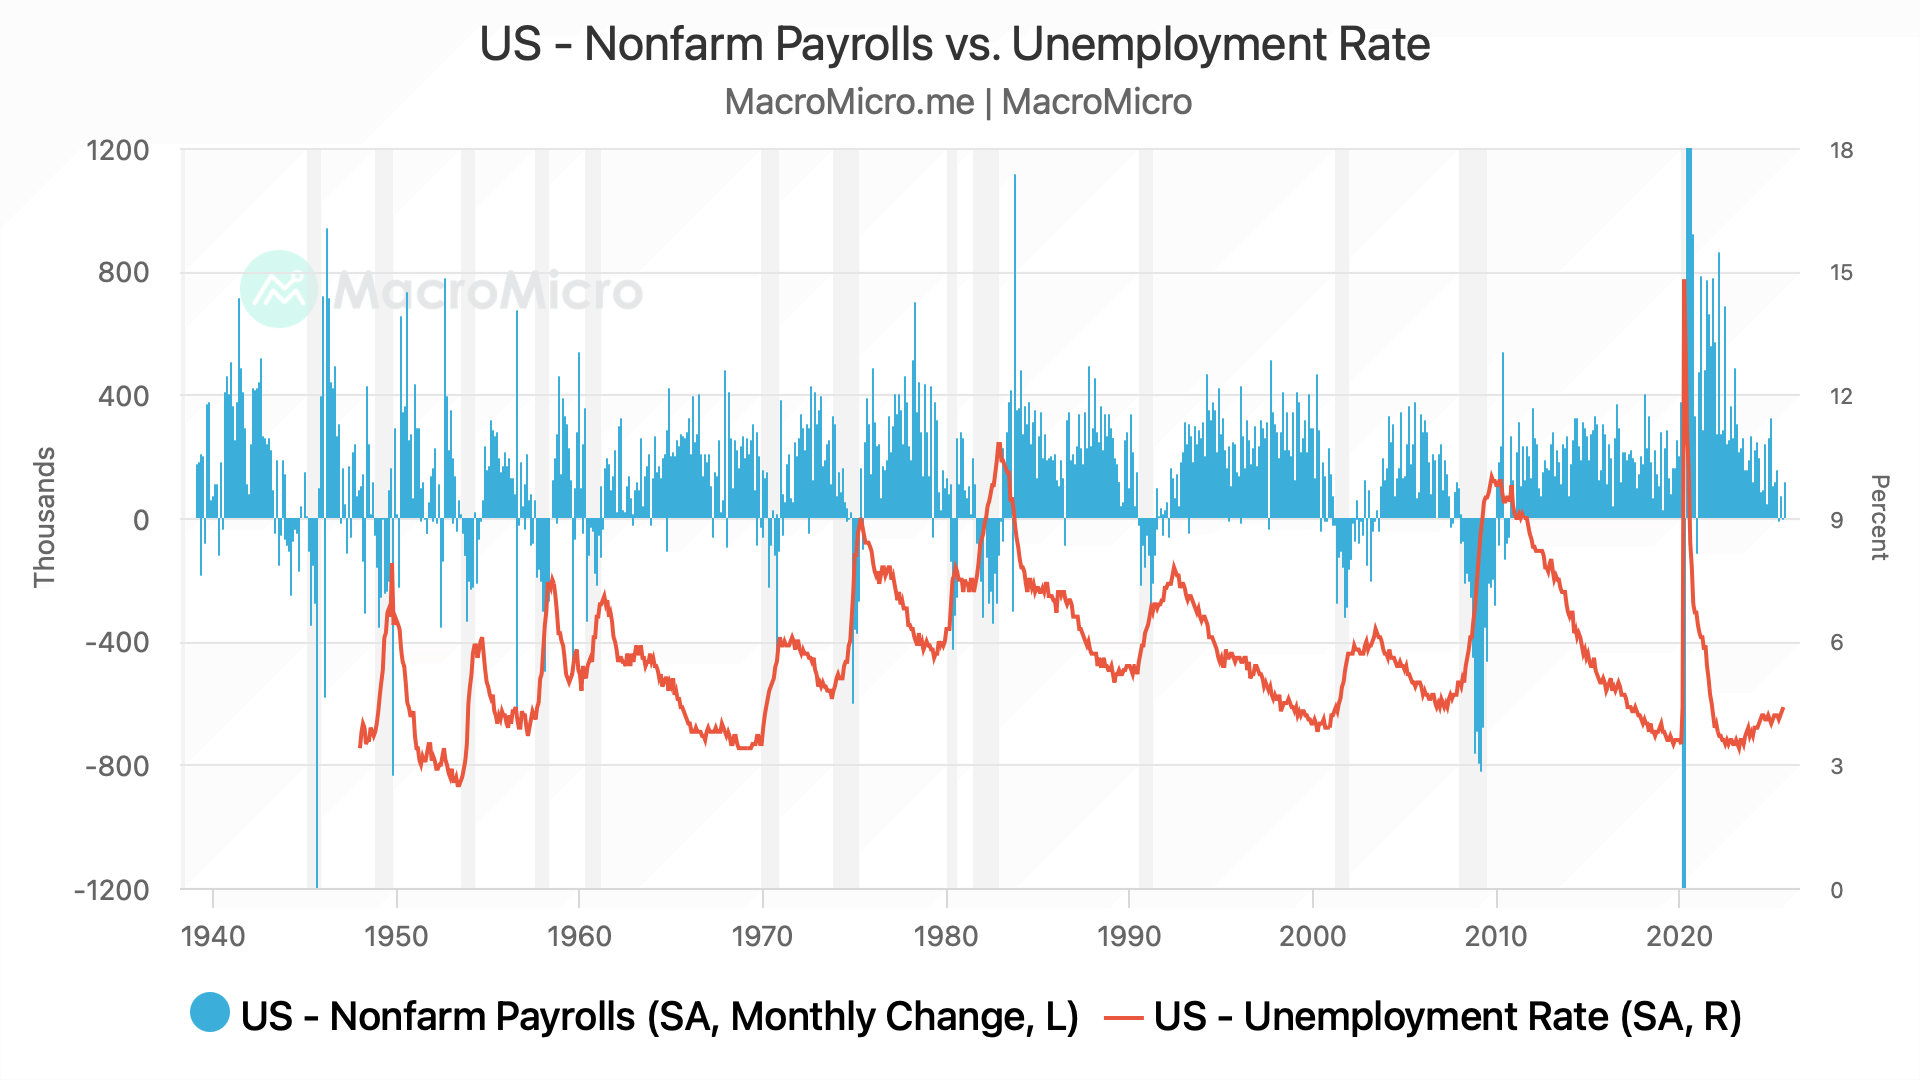
Digging deeper, we can conclude that the softening in the labour market has been rising since last year, with no improvement.
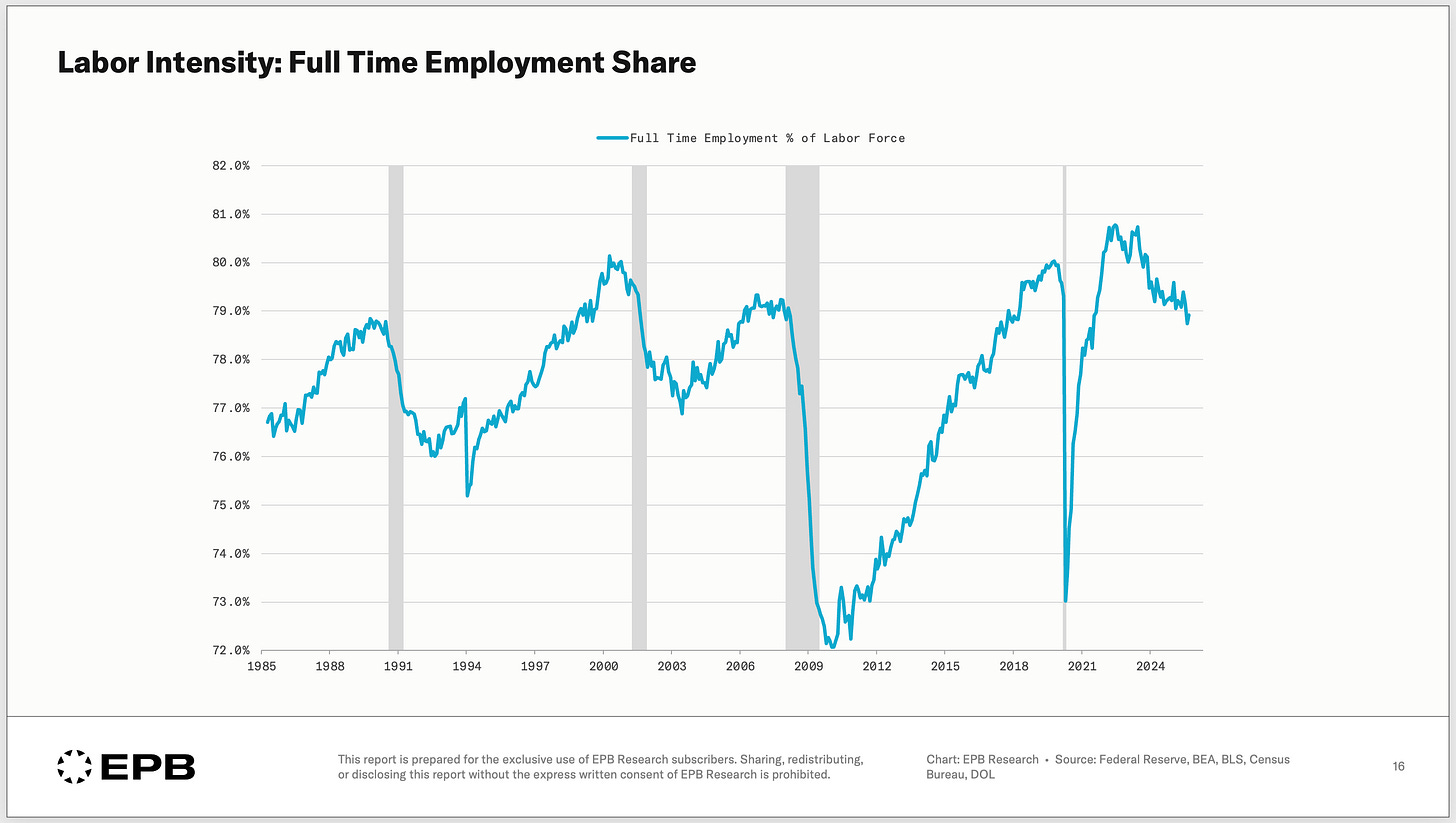
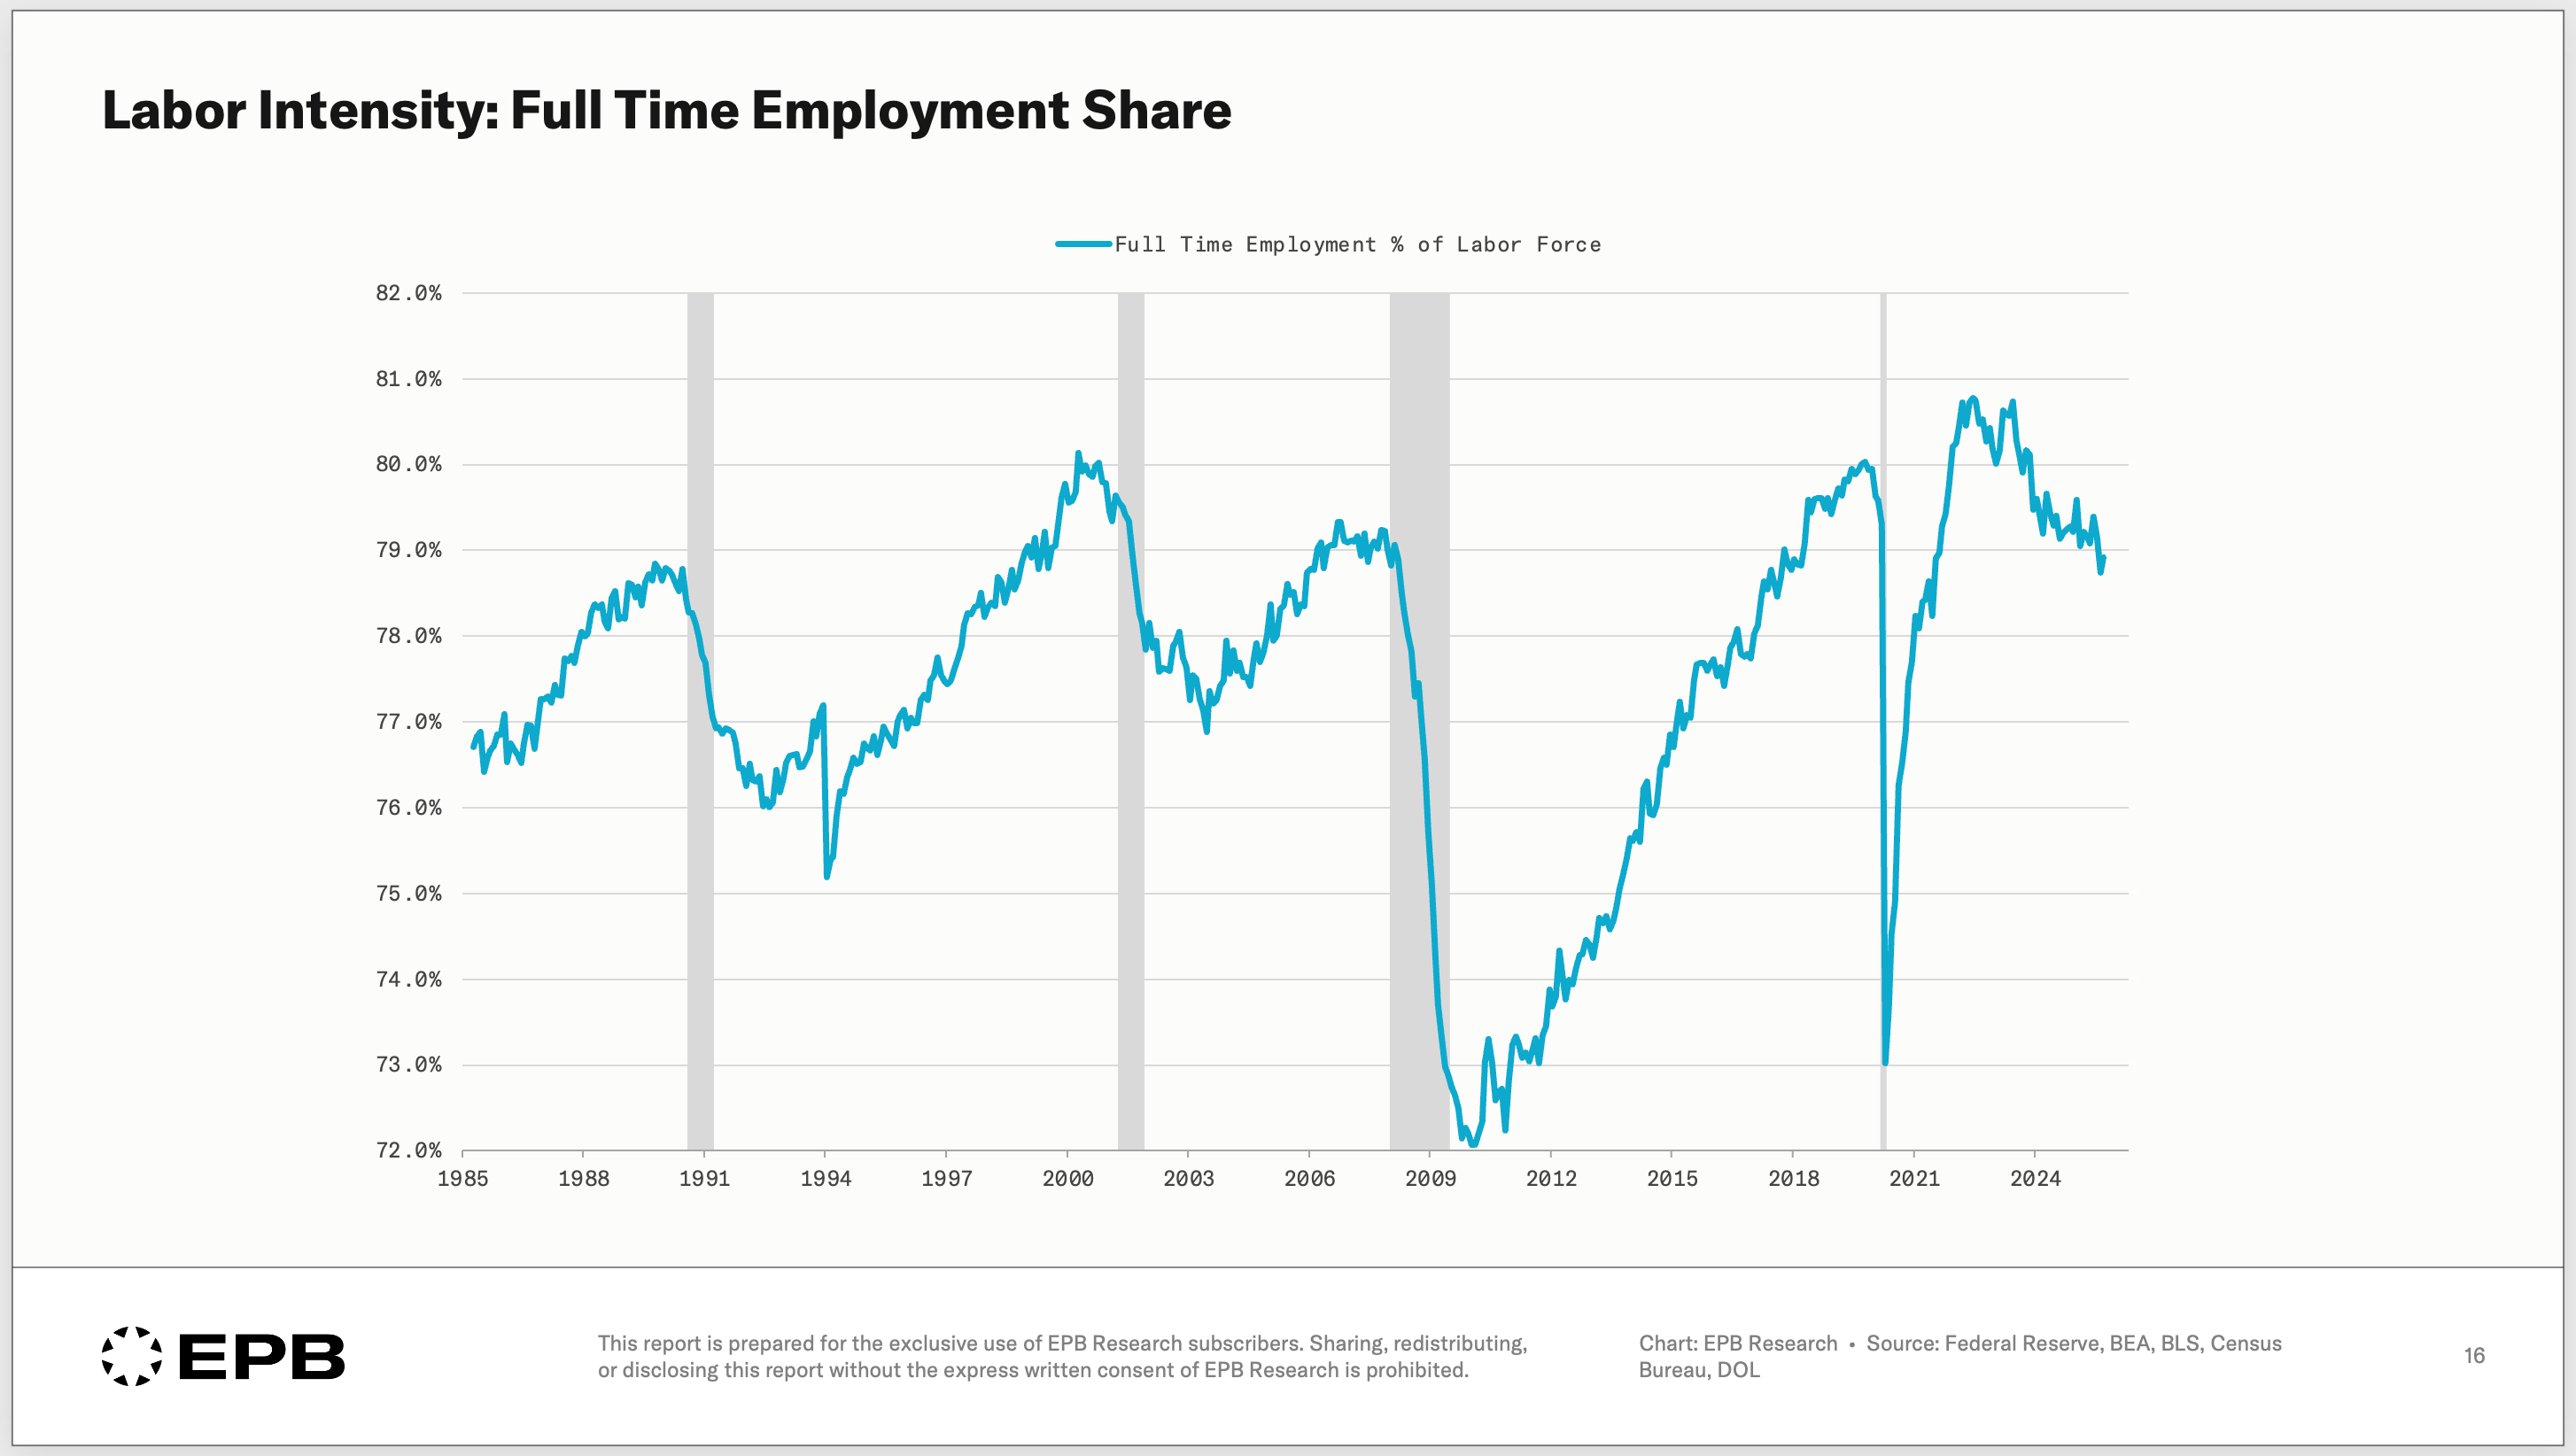
Full-time employment as a % of the labour force, excluding the COVID era, is now back to 2018 levels.
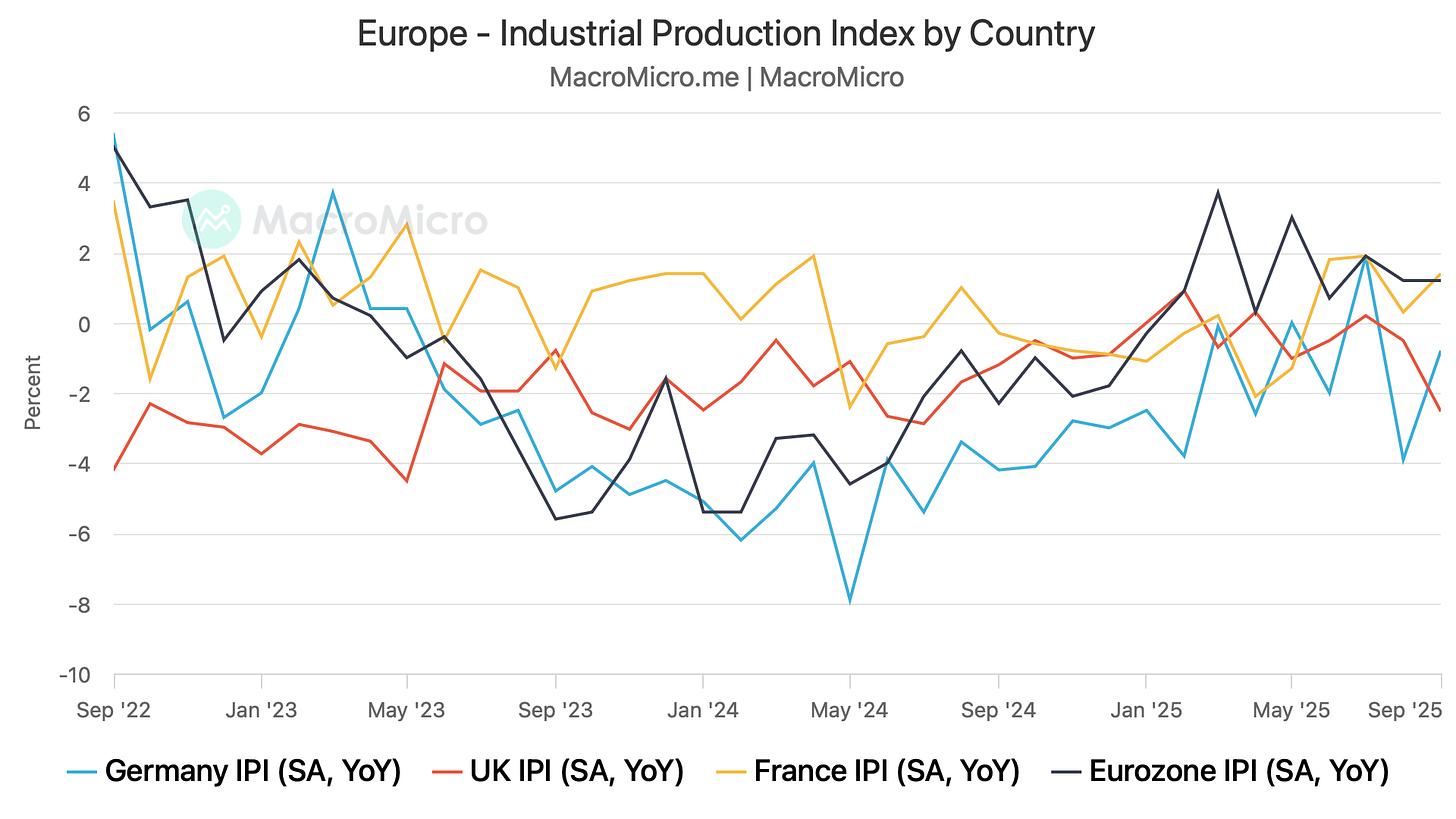
Across the Atlantic, we are detecting divergent trends in the cyclical economy.
While the UK is undergoing a significant deceleration in Industrial Production, we are witnessing a gradual recovery in France and Germany’s industrial production.

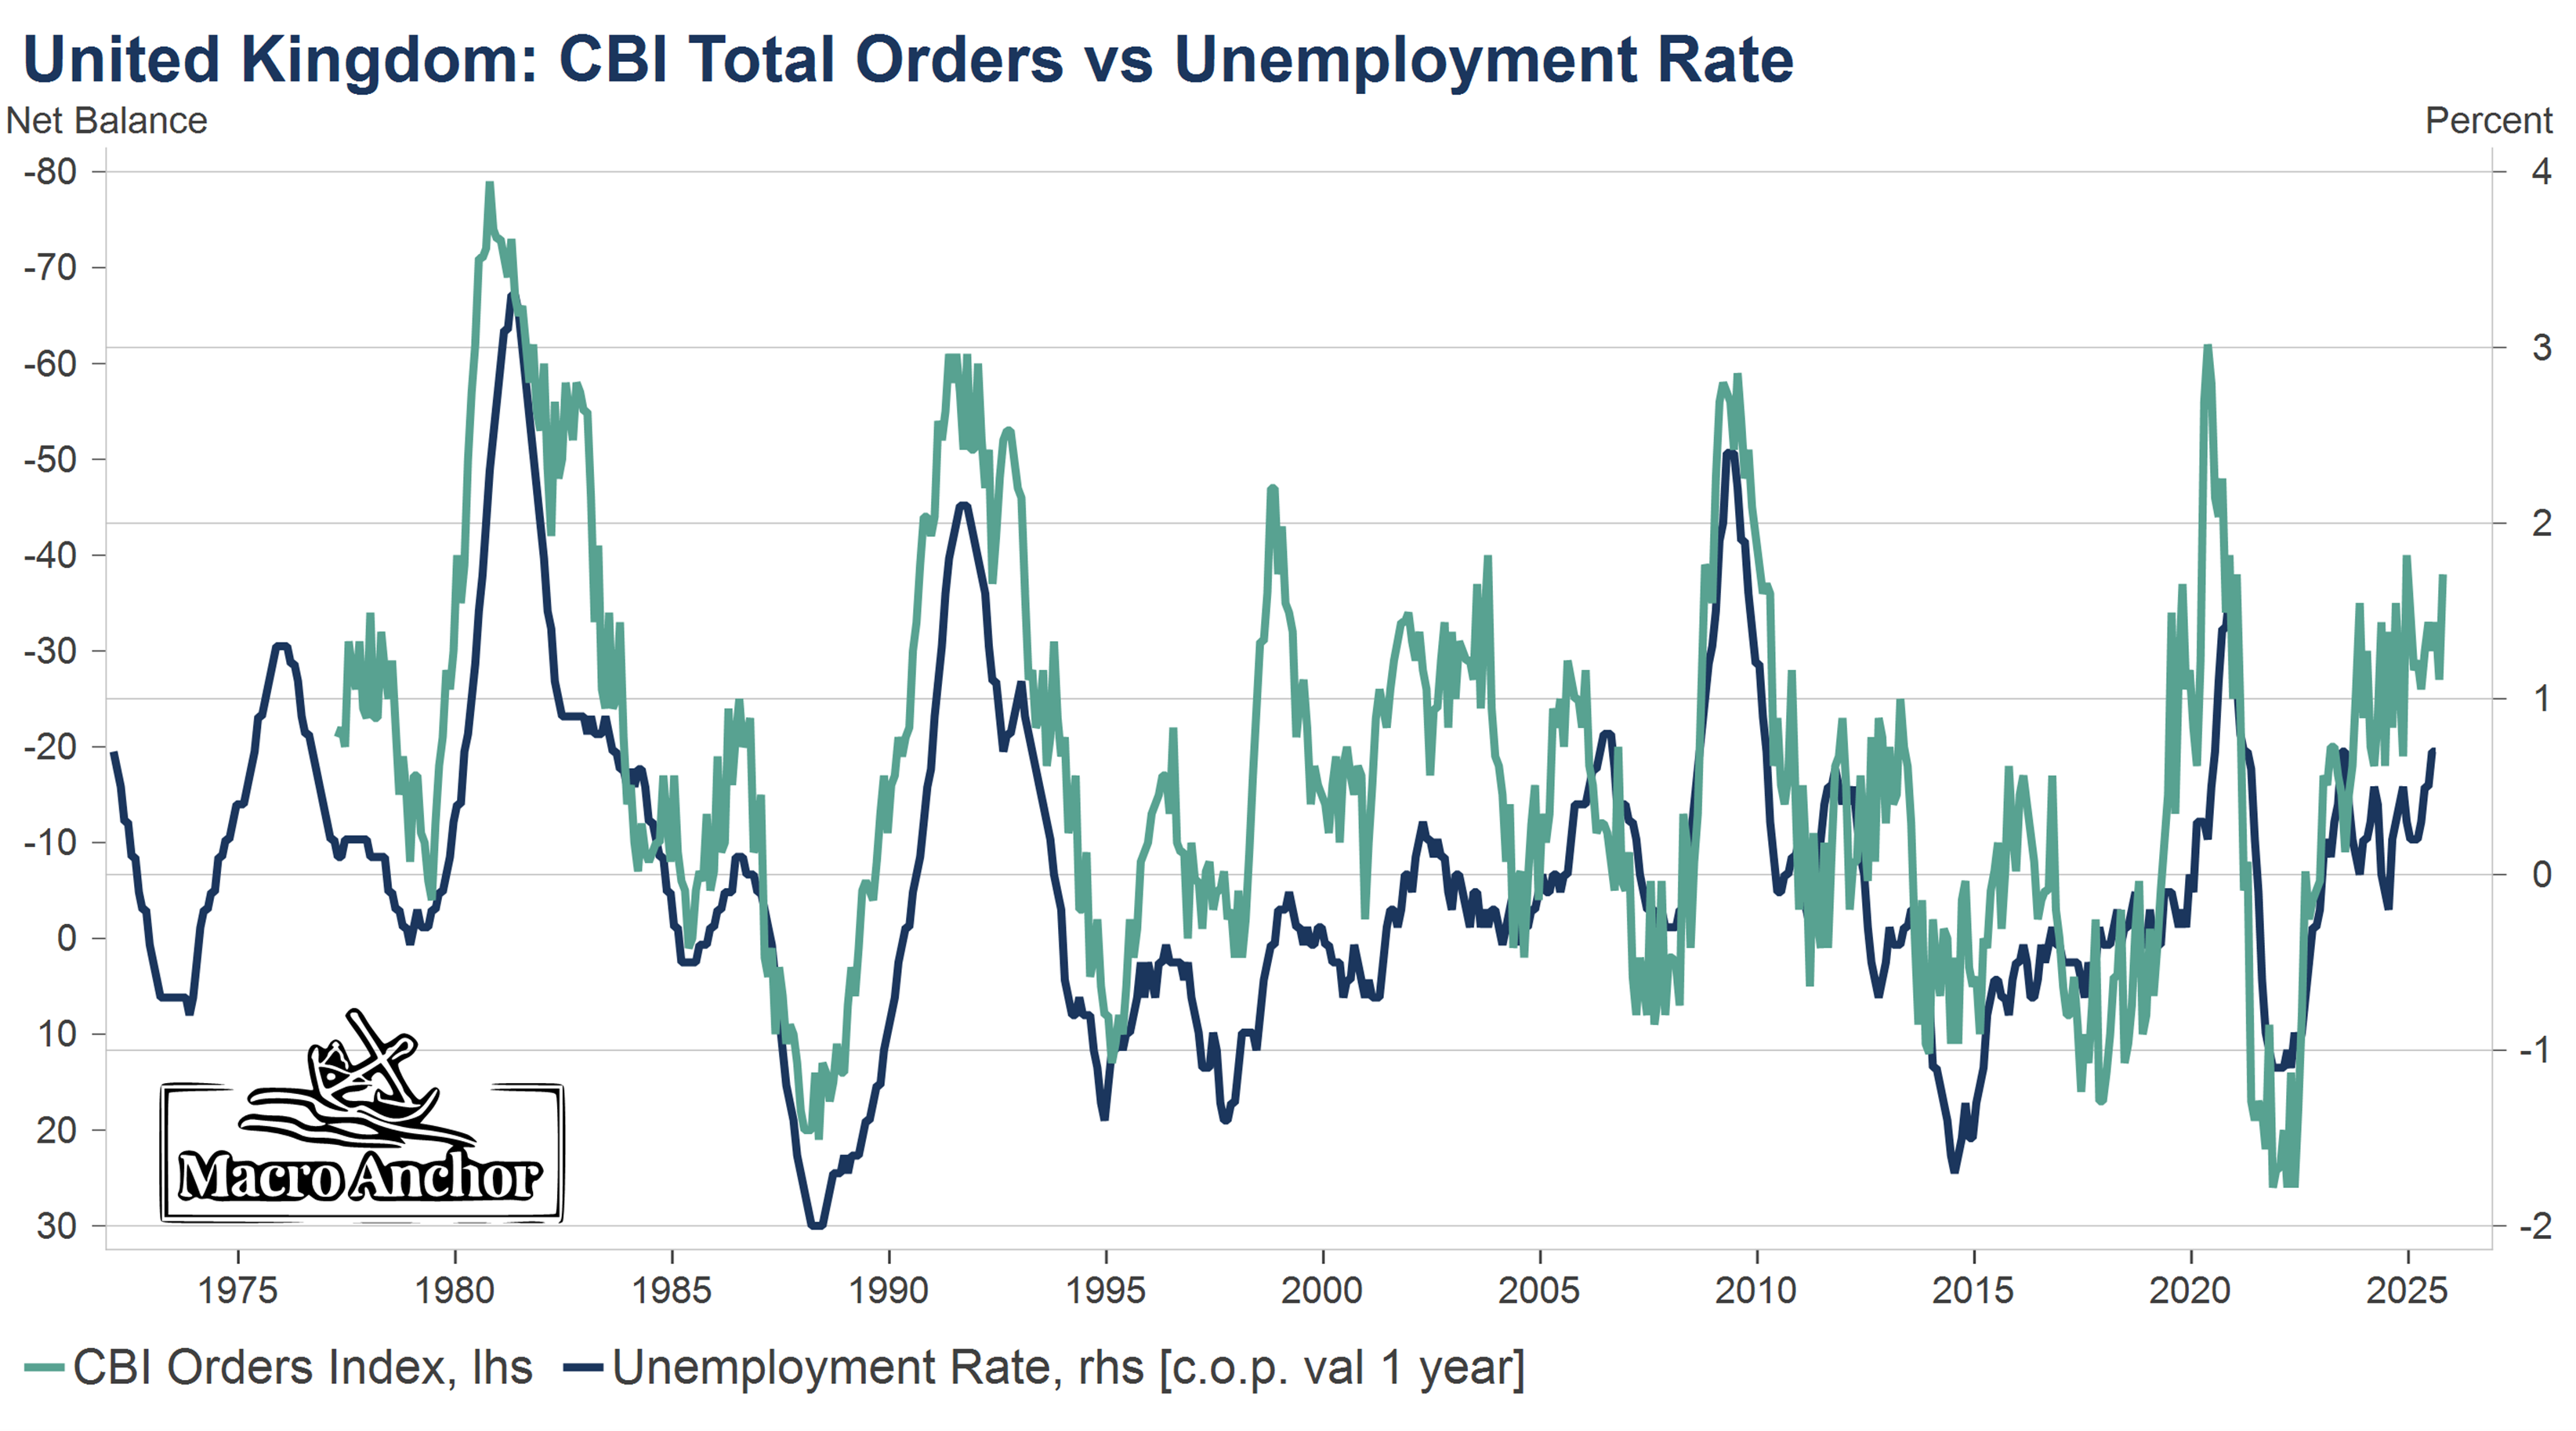
The situation in the UK is alarming, as weakening labour market is now raising eyebrows.
The CBI Industrial Trends Total Orders indicate that the Unemployment Rate will rise by more than 100 bps soon, leading to a recessionary outcome.

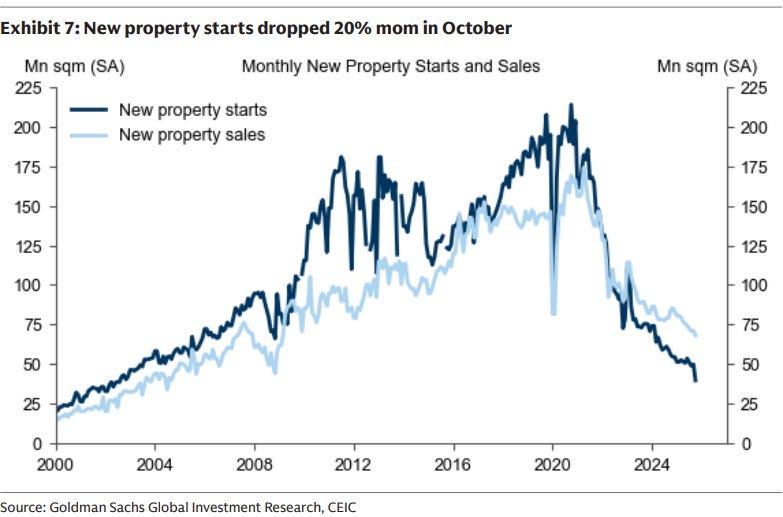
The property bubble is still deflating in China, as data reveal that new activity has stalled completely.
The new property starts (absolute) has fallen to the levels last seen in 2004. Furthermore, the New Property Sales have also plunged to the levels last seen more than a decade ago.

Source: GS
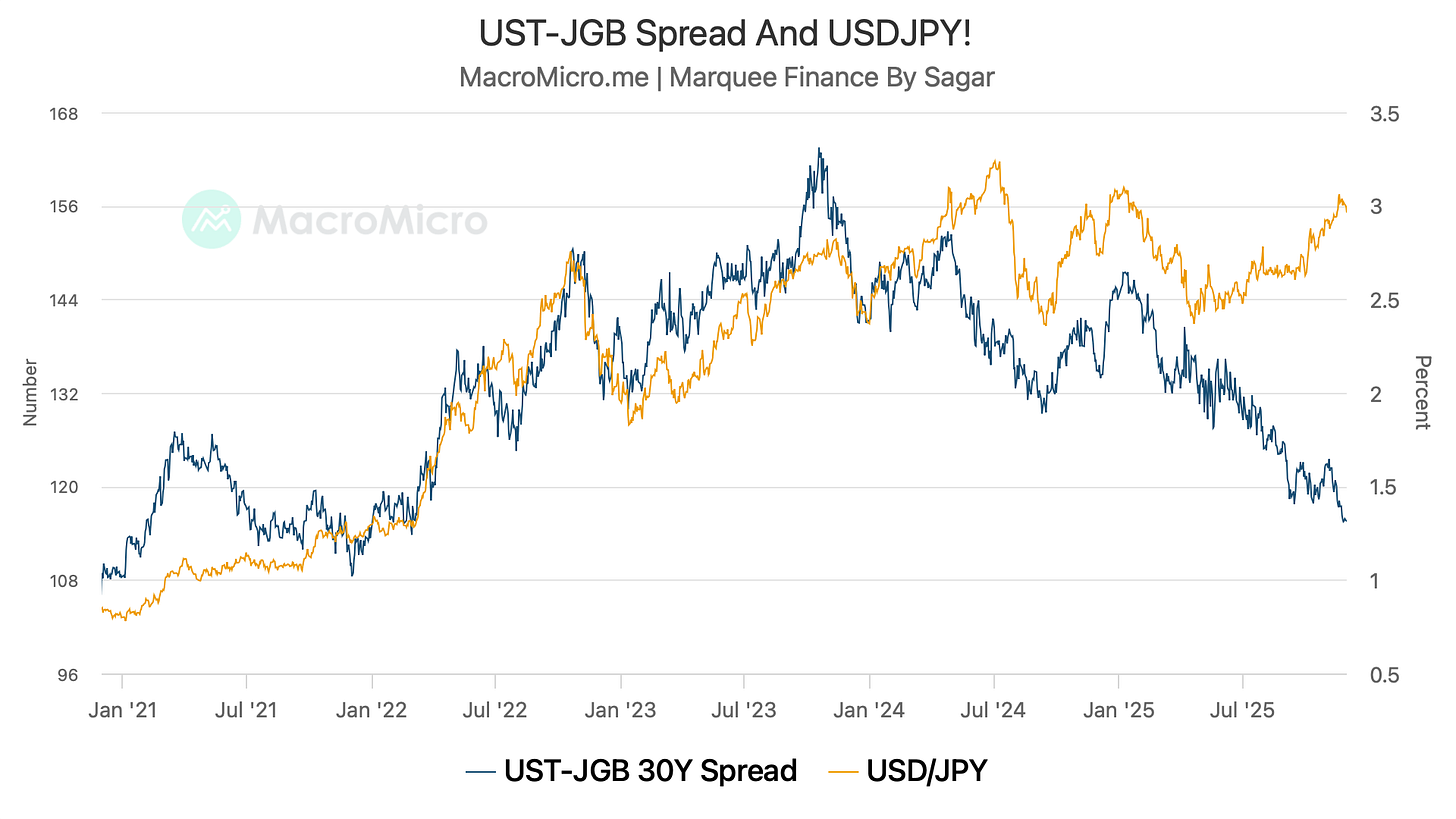
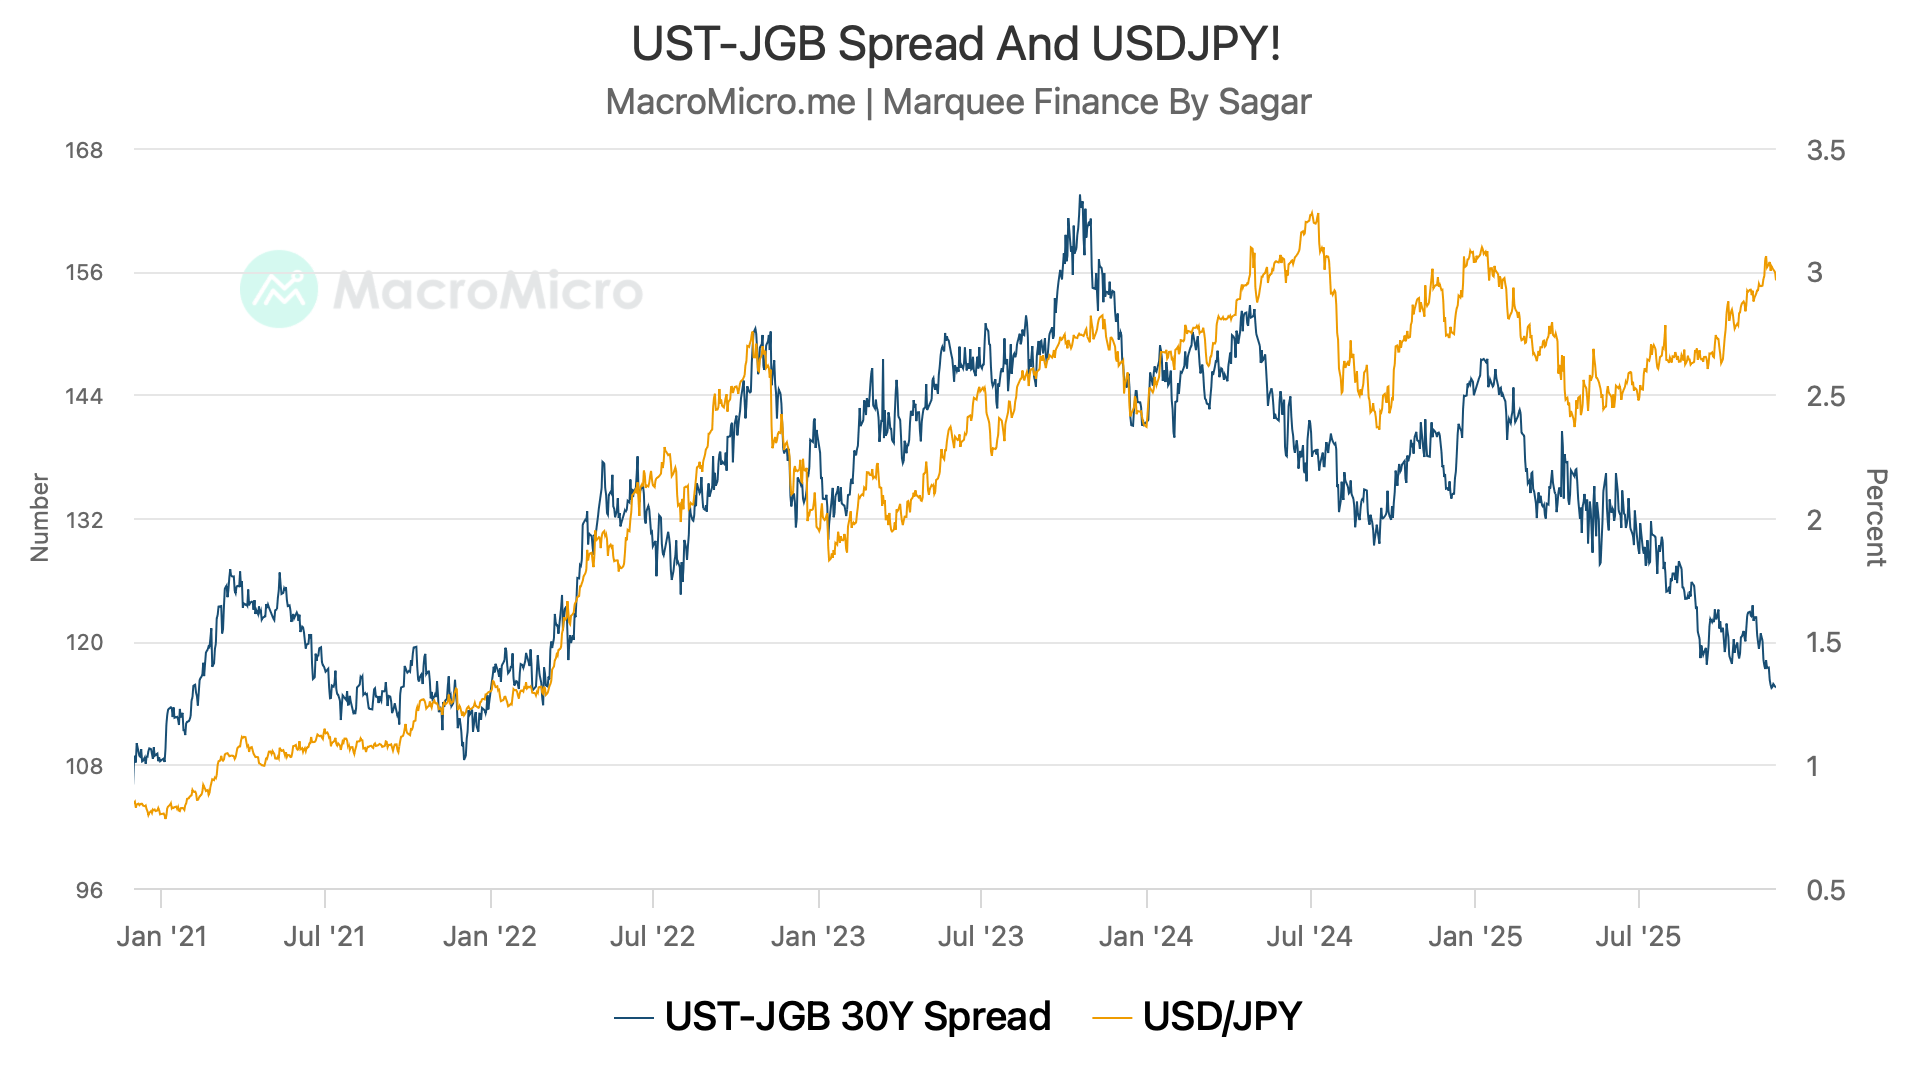
The UST-JGB 30 Year spread has been tightly correlated with the move in the USDJPY pair, with a rising spread leading to higher USDJPY.
This was primarily due to a hawkish Fed and the BOJ's “contrarian” view (dovish).
However, since June this year, we have seen the spread tighten significantly as USTs outperformed JGBs for reasons known to everyone.Mean reversion soon?
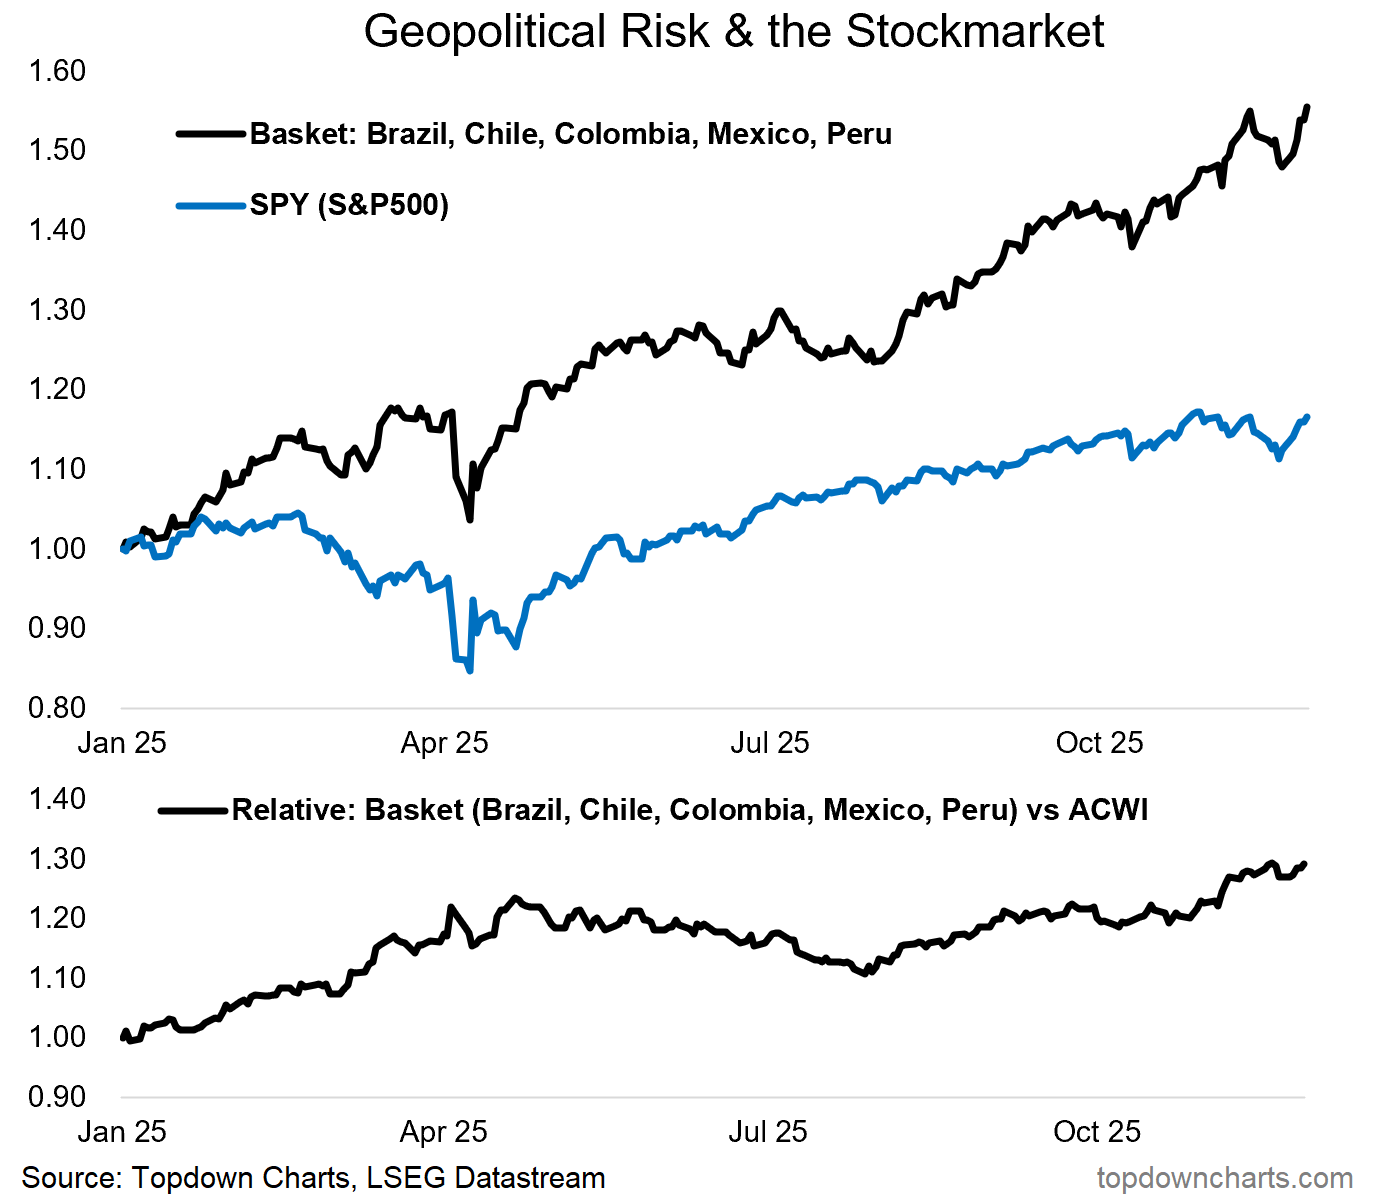
As mentioned earlier, LATAM equity markets have been a stark outperformer.
A custom basket of the top 5 markets (including Mexico) has outperformed the benchmark ACWI Index by more than 20%.
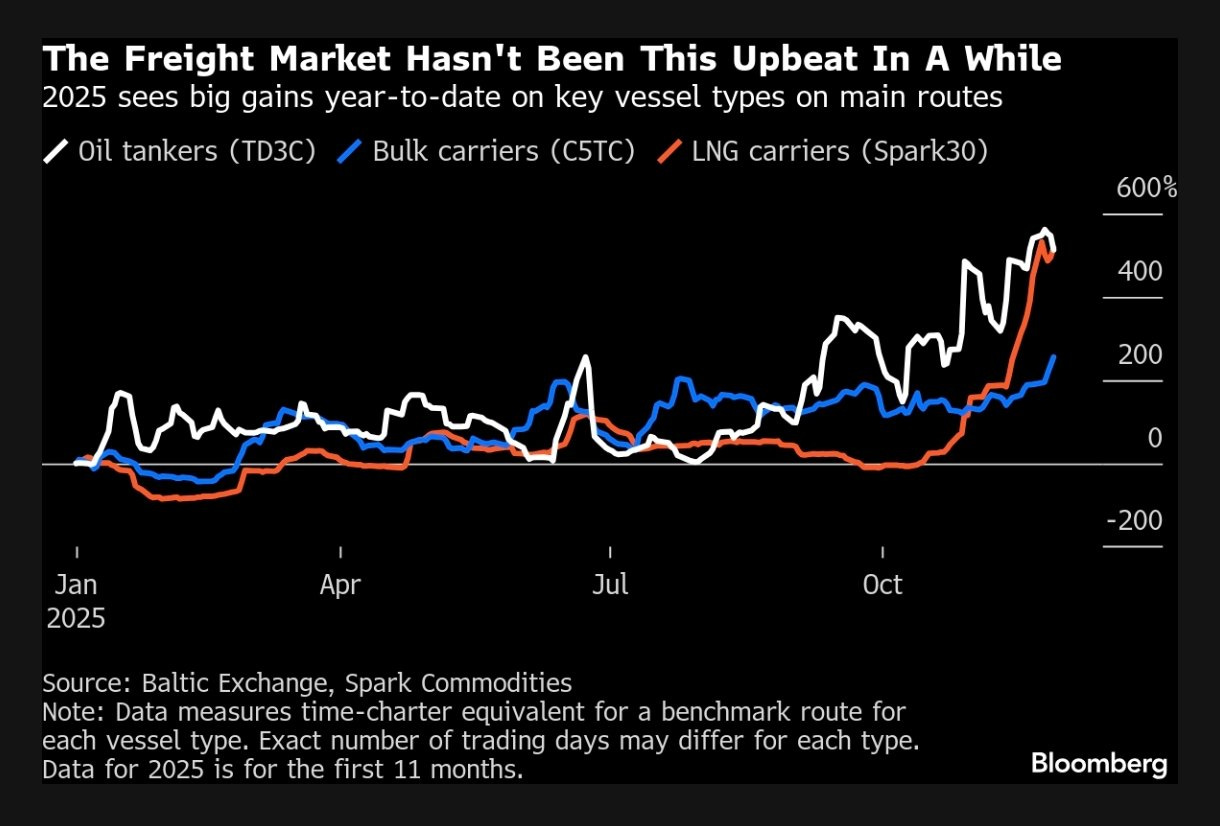
BONUS CHART: The freight markets are witnessing a massive spike in freight rates across the board. Although oil prices are at multi-year lows, higher freight rates, higher insurance (especially for Russian oil), and higher refining margins suggest that pump prices might have bottomed out.

Source: BBG
Disclaimer
This publication and its author are not licensed investment professionals. The author & any other individuals associated with this newsletter are NOT registered as Securities broker-dealers or financial investment advisors with the U.S. Securities and Exchange Commission, Commodity Futures Trading Commission, or any other securities/regulatory authority. Nothing produced under Marquee Finance by Sagar should be construed as investment advice. Do your research and consult with your certified financial planner or other dedicated professional before making any investment decisions. Investments carry risk and may lose value; Marquee Finance By Sagar LLC, Marqueefinancebysagar.substack.com or Sagar Singh Setia is not responsible for loss of value; all investment decisions you make are yours alone