

As the world’s largest equity market gears up for one of the biggest IPOs, dark clouds are looming over the AI story.
We have always mentioned that AI remains the most transformational technology of our lifetime.
Nonetheless, only time will tell who the biggest AI beneficiaries are.
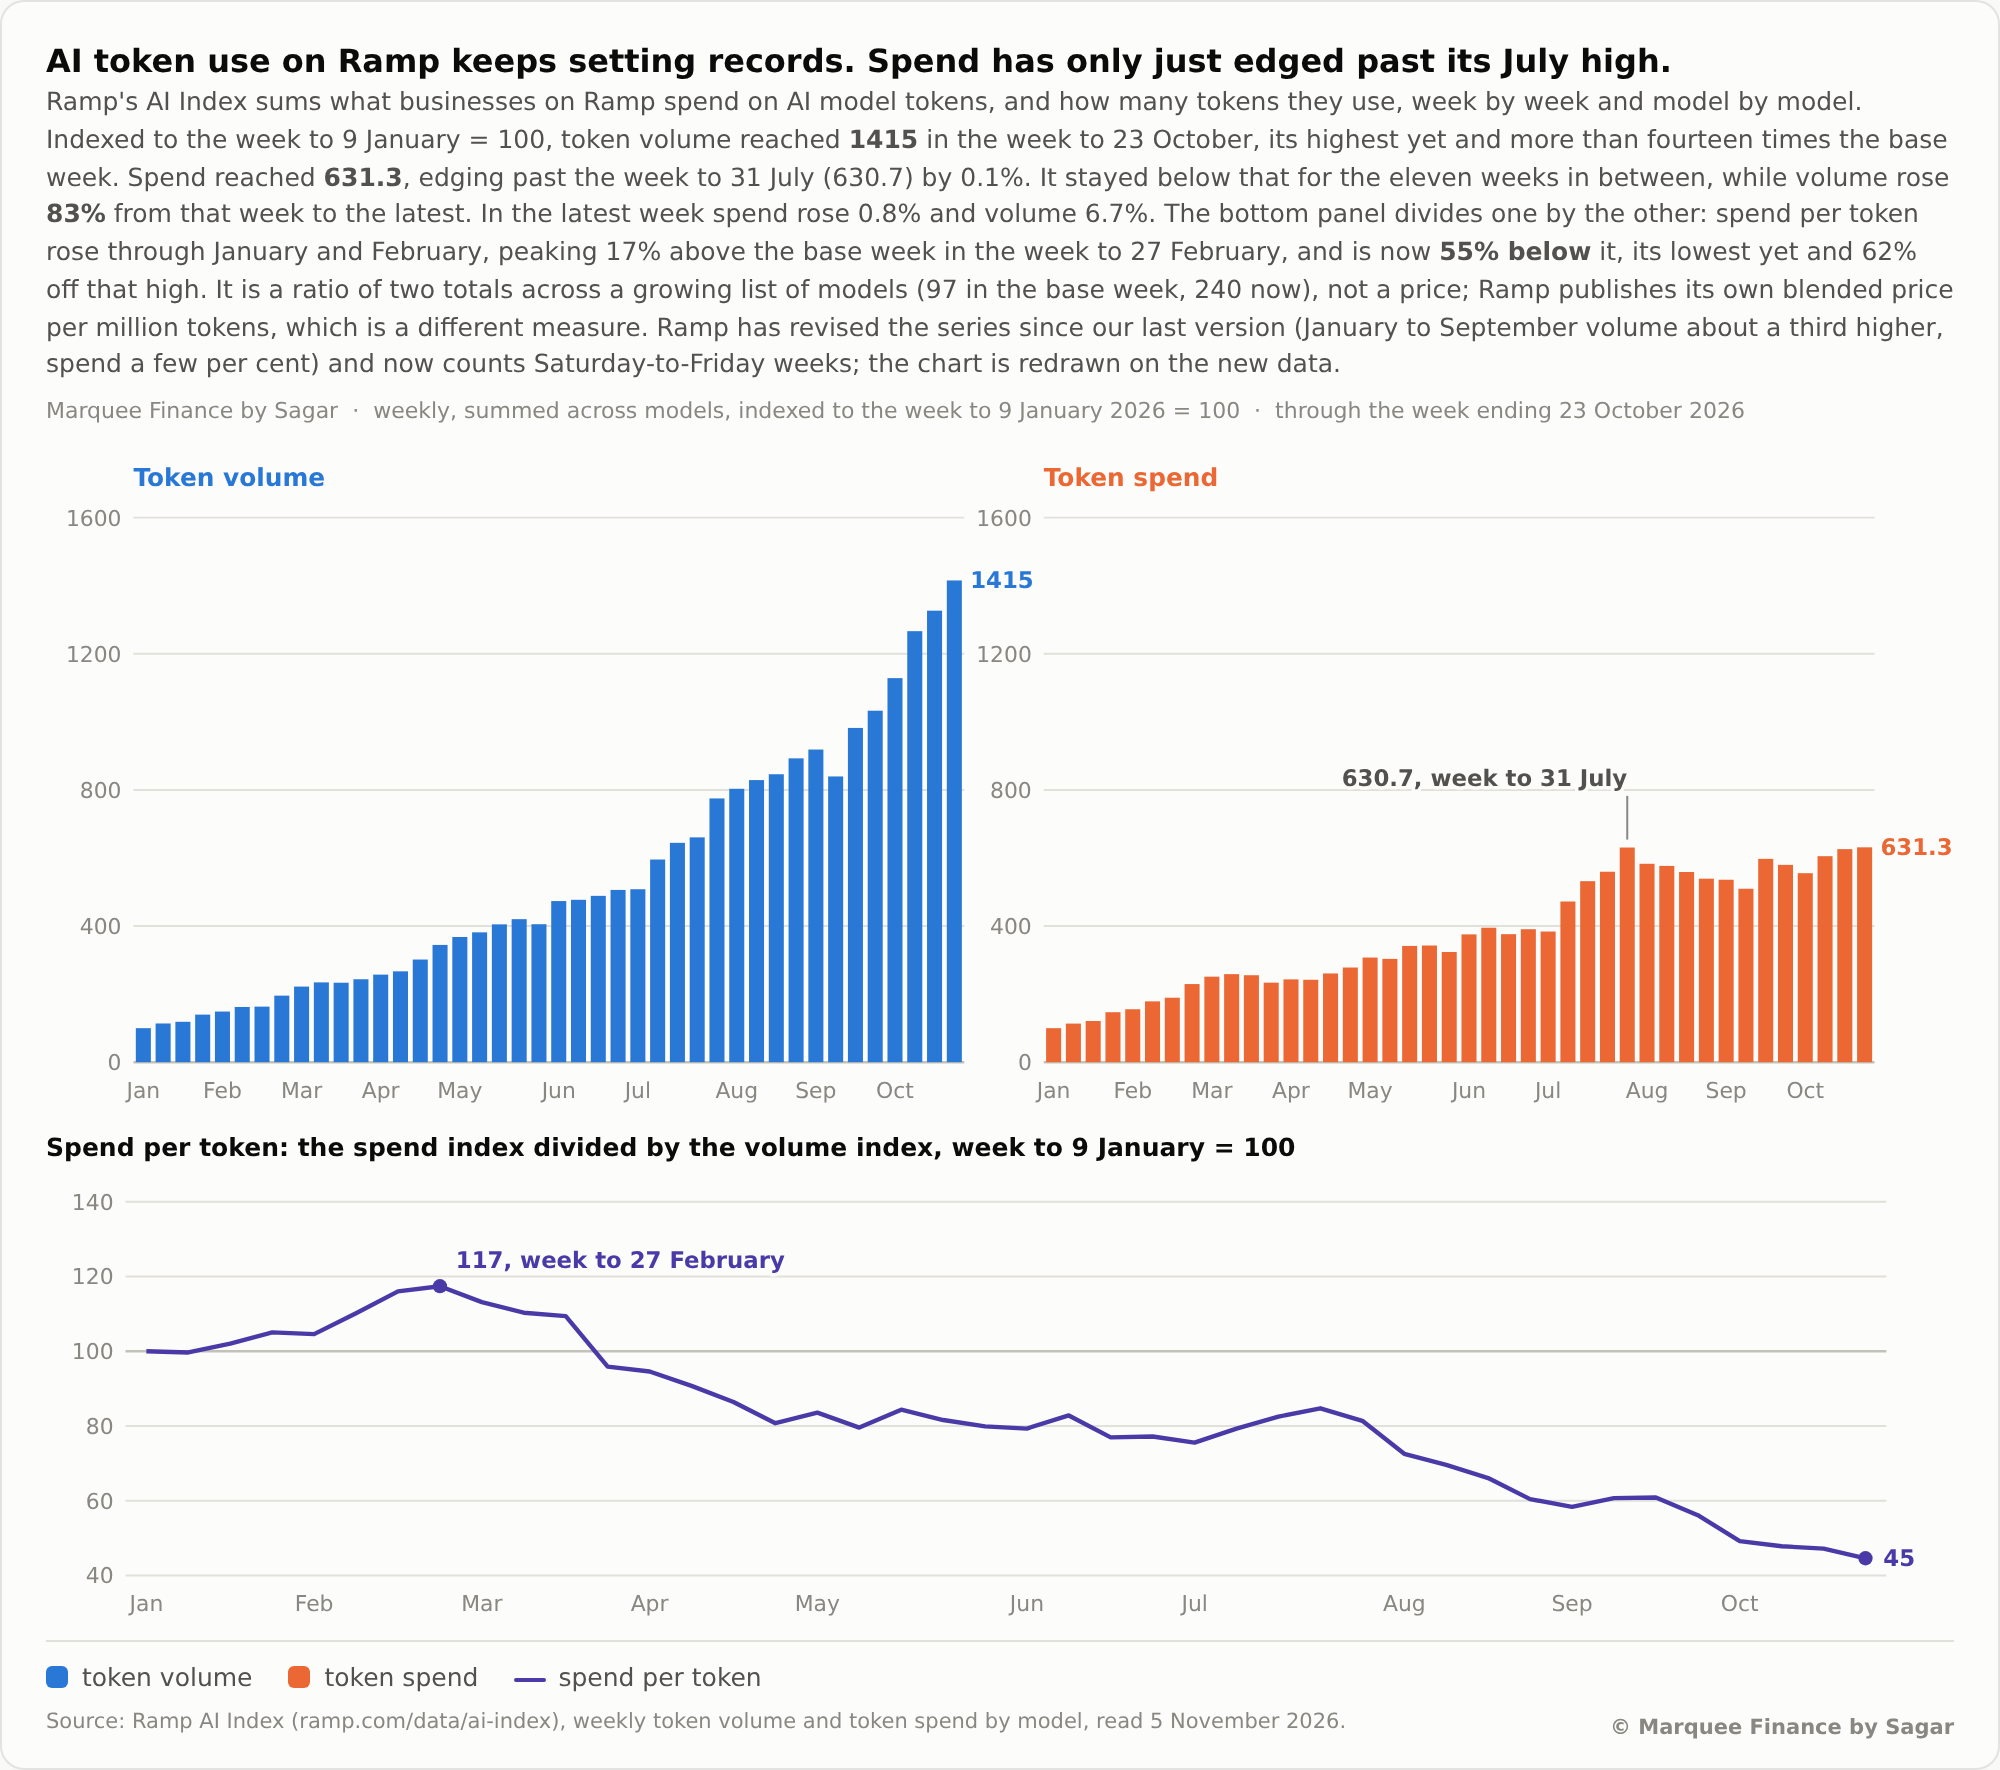
The AI token volume continues to explode after the Chinese OS models flooded the market.
While AI token volume has more than doubled since July, token spend is flat, indicating a rise in the market share of Chinese OS models.
Let’s examine 14 charts to analyse global macro and financial market internals!
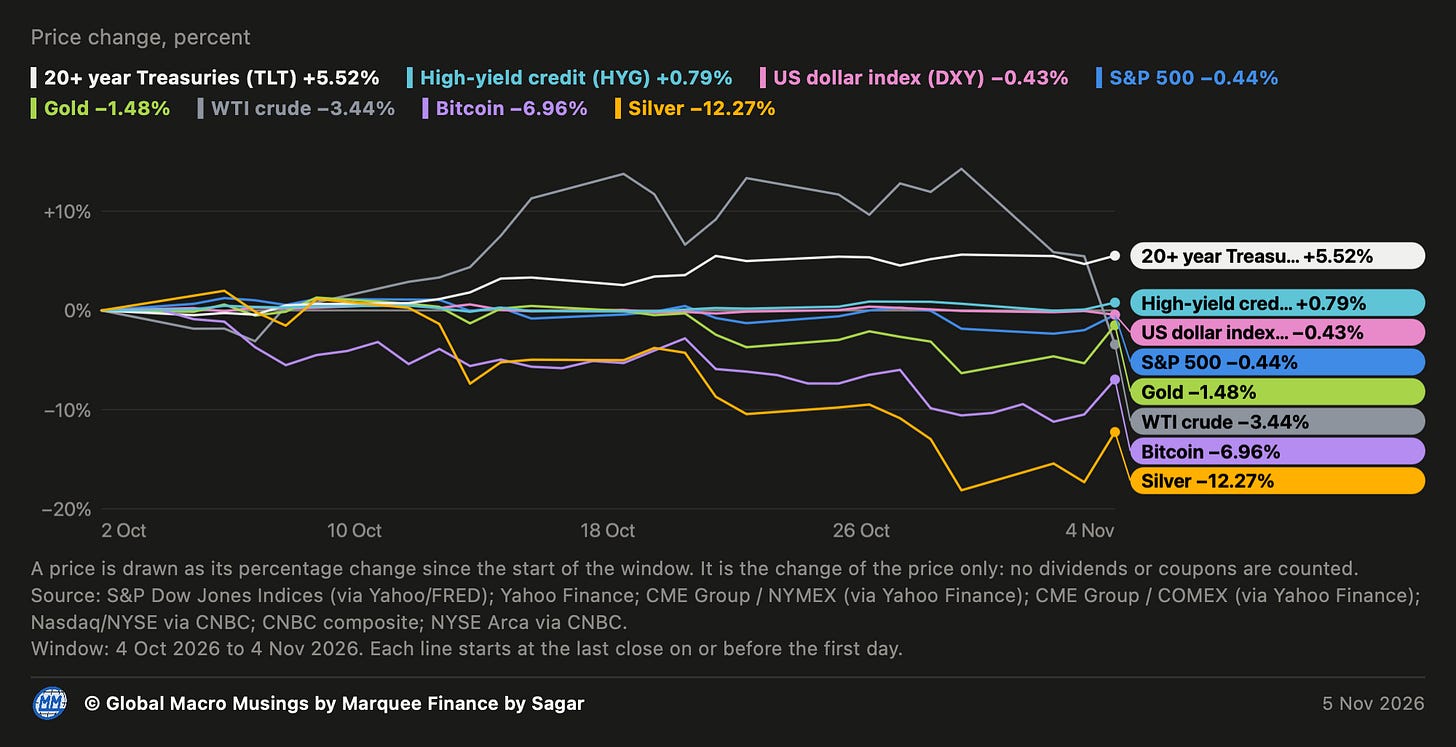
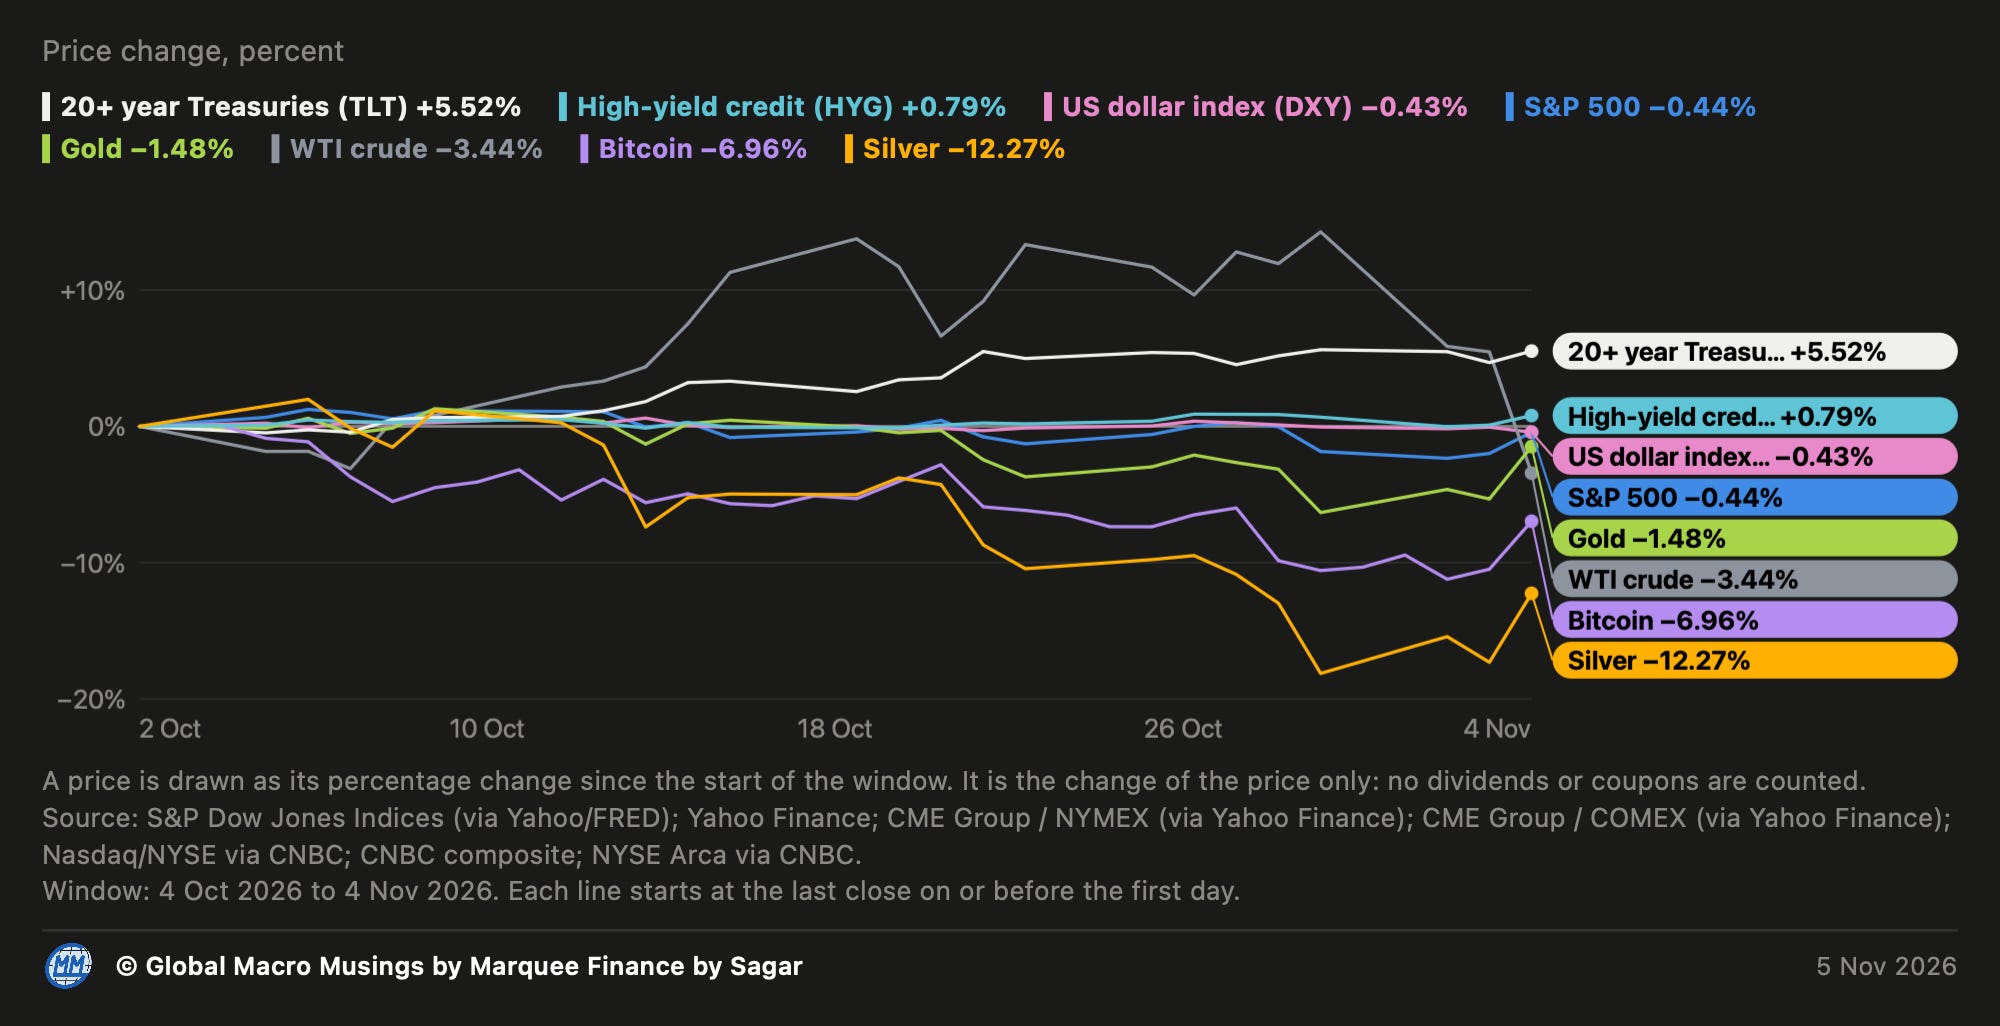
Surprisingly, as the doomsday narrative spread about bond markets, long-term bonds were the top performers last month.
While TLT was up 5.5%, the commodities arena saw absolute carnage, as silver plunged 12%.
BTC was a relative underperformer, down 7%.
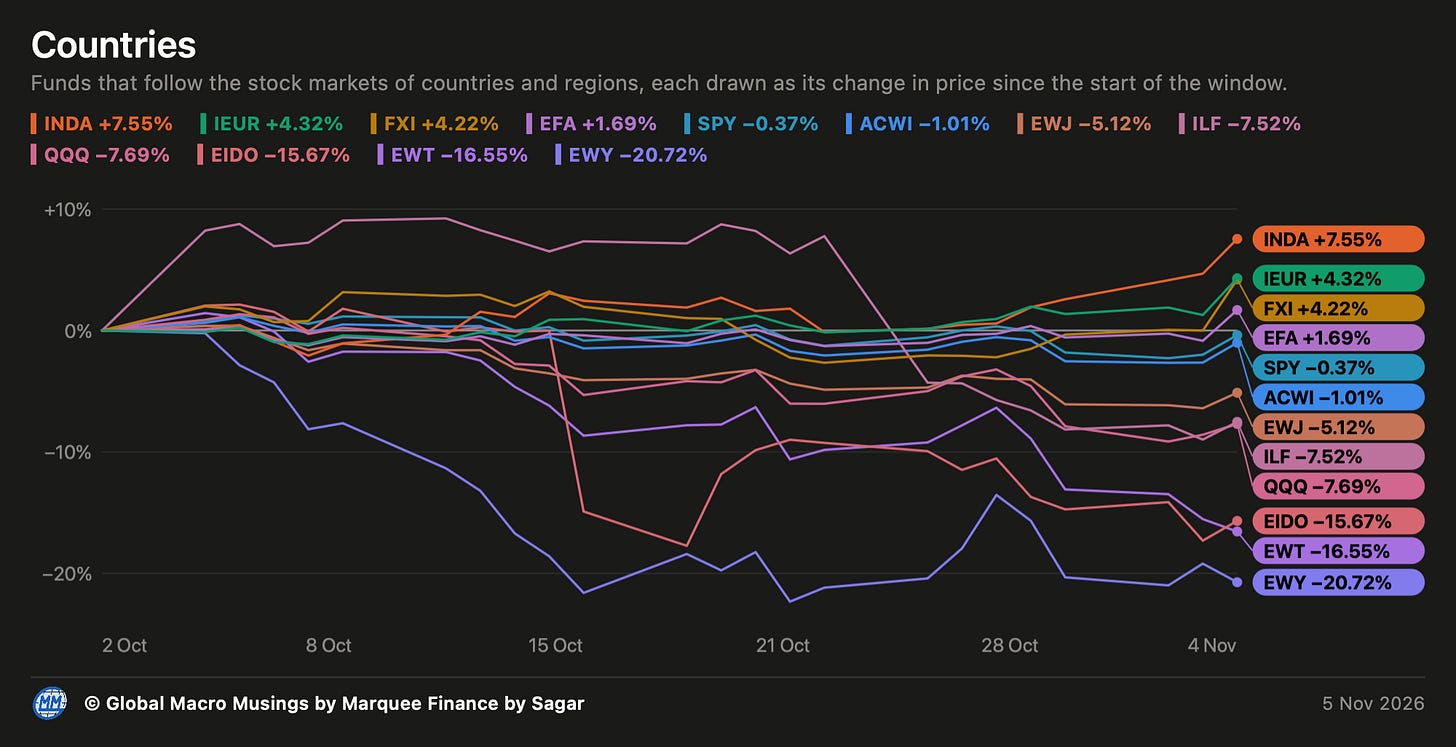
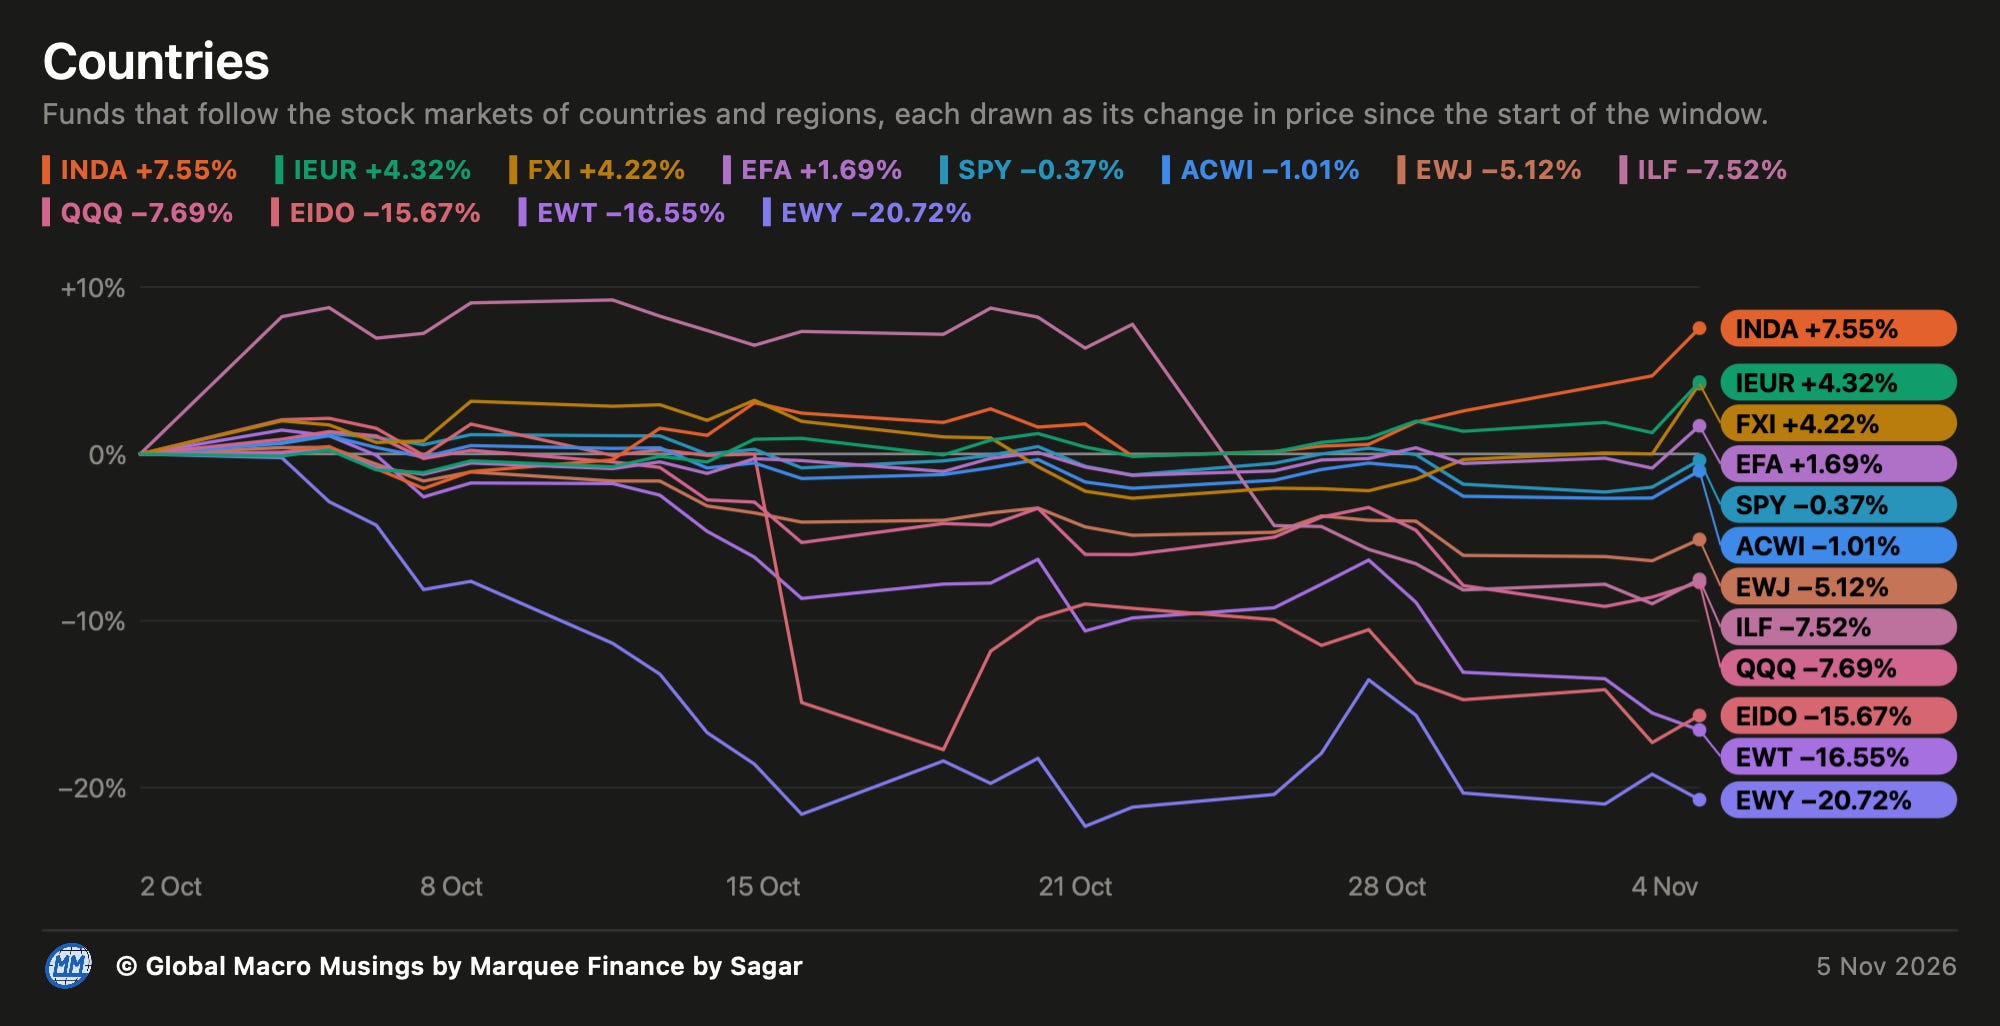
As the AI trade unravels, Rest of World (RoW) equities have outperformed the AI winners in the last month.
As a result, we have seen some deep cuts in Taiwan, Korea, QQQ and Japan. Furthermore, LATAM (ILF) saw a horrific turn of events as Lula, in a last-minute twist, won the Brazilian elections.
In RoW, India, Europe and China were the winners.
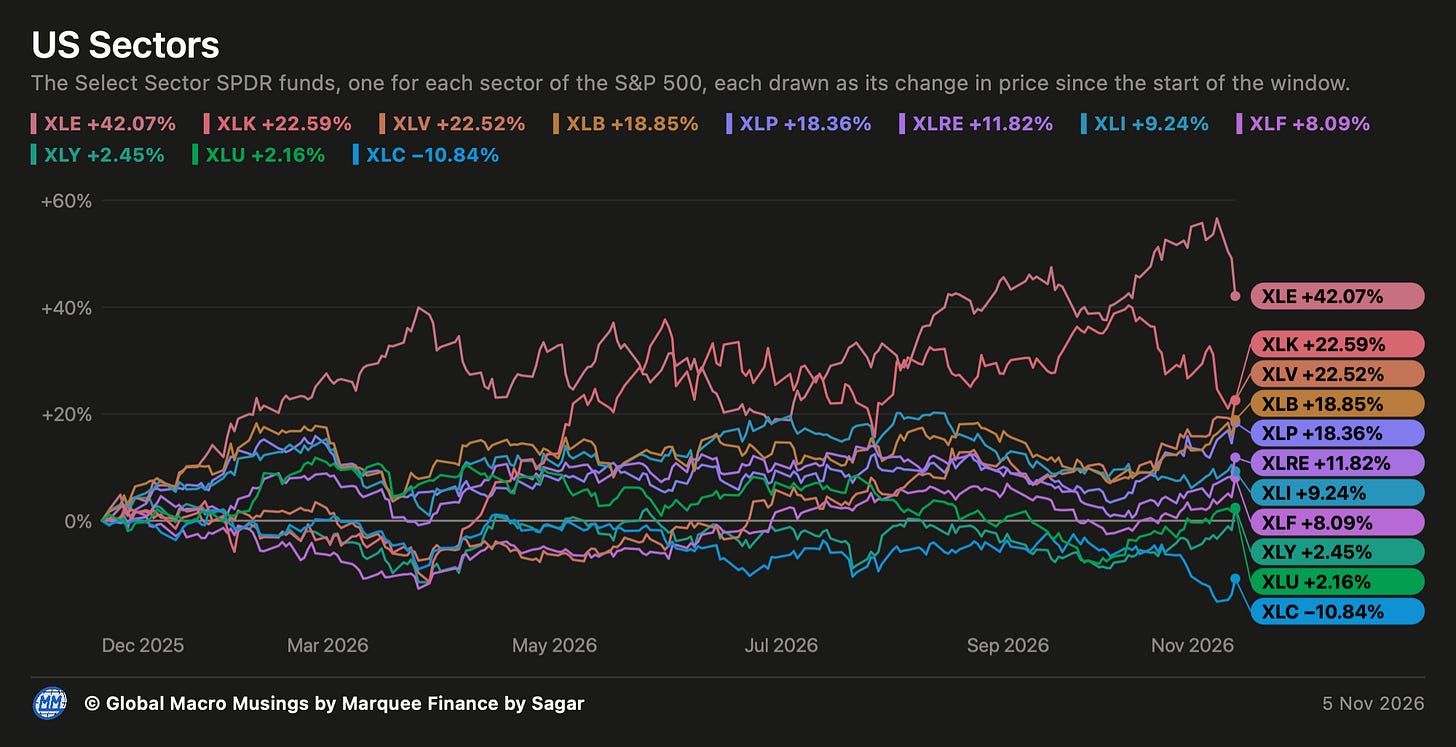
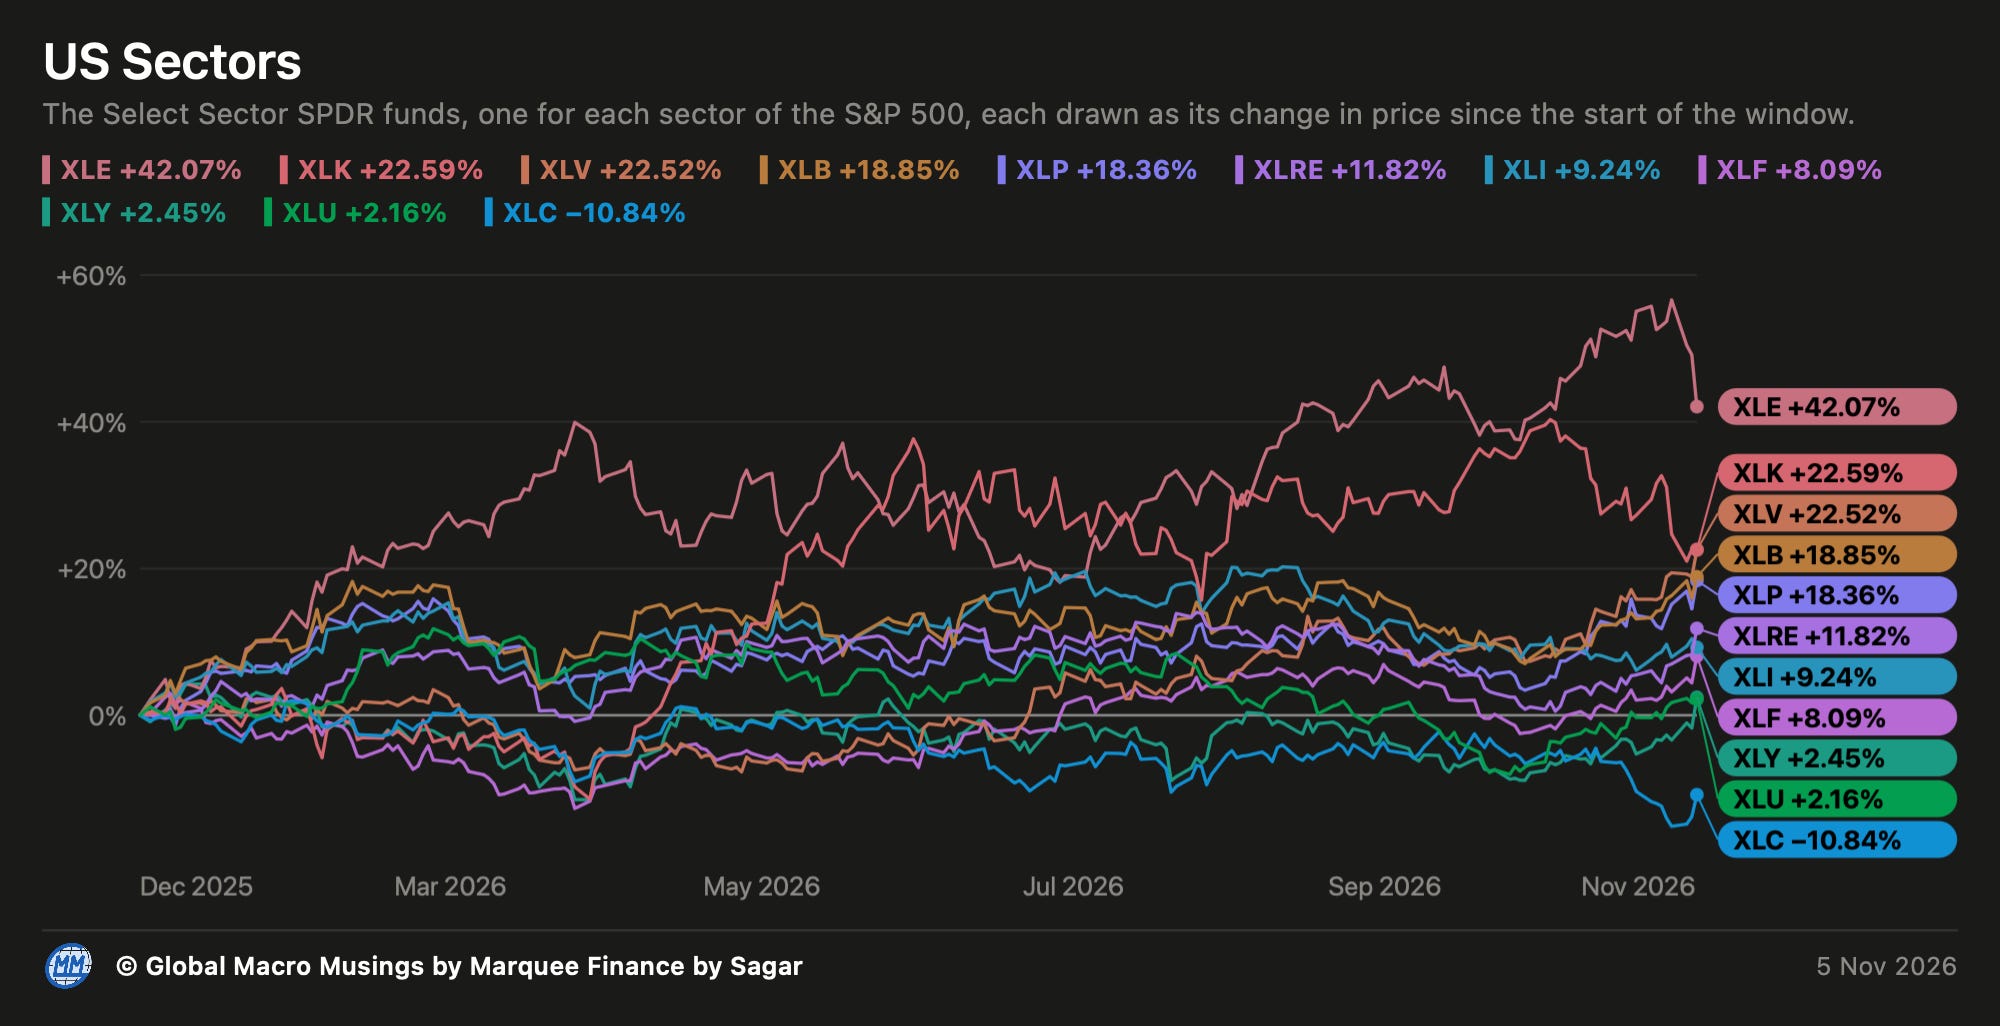
Out of the 11 sectorial ETFs in the chart, only two ETF’s: XLE and XLK have been the top performers YTD.
Note that even in XLK, a handful of names (mostly semis) drove the outperformance; as a result, the rally has been concentrated in only a few names.
Nonetheless, we have seen catch-up in the last month as the winners get sold. Healthcare is now ready to take the second spot.
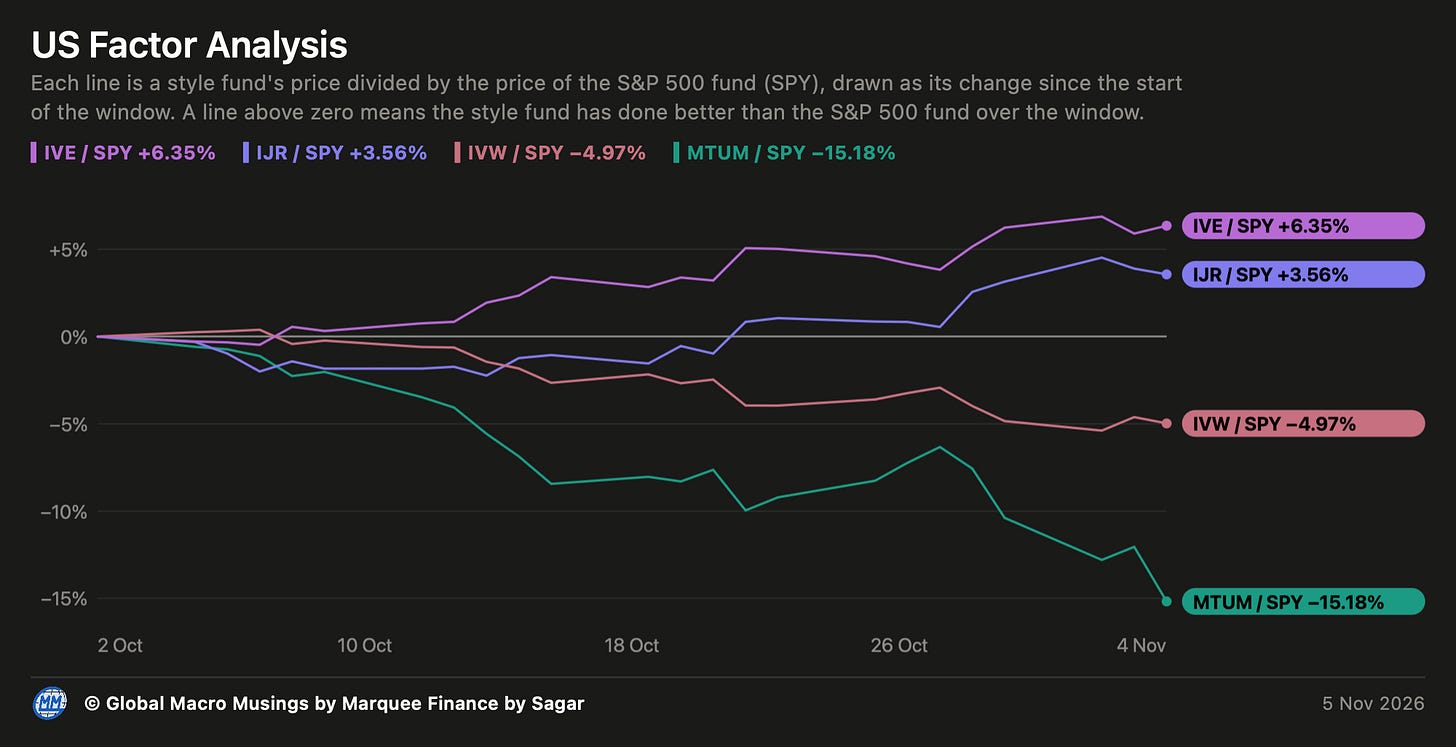
Hedge funds have seen immense pain in the last few weeks as there has been significant deleveraging.
Momentum relative to SPX plunged by 15% in the last month, while value and small-caps have been enormous outperformers.
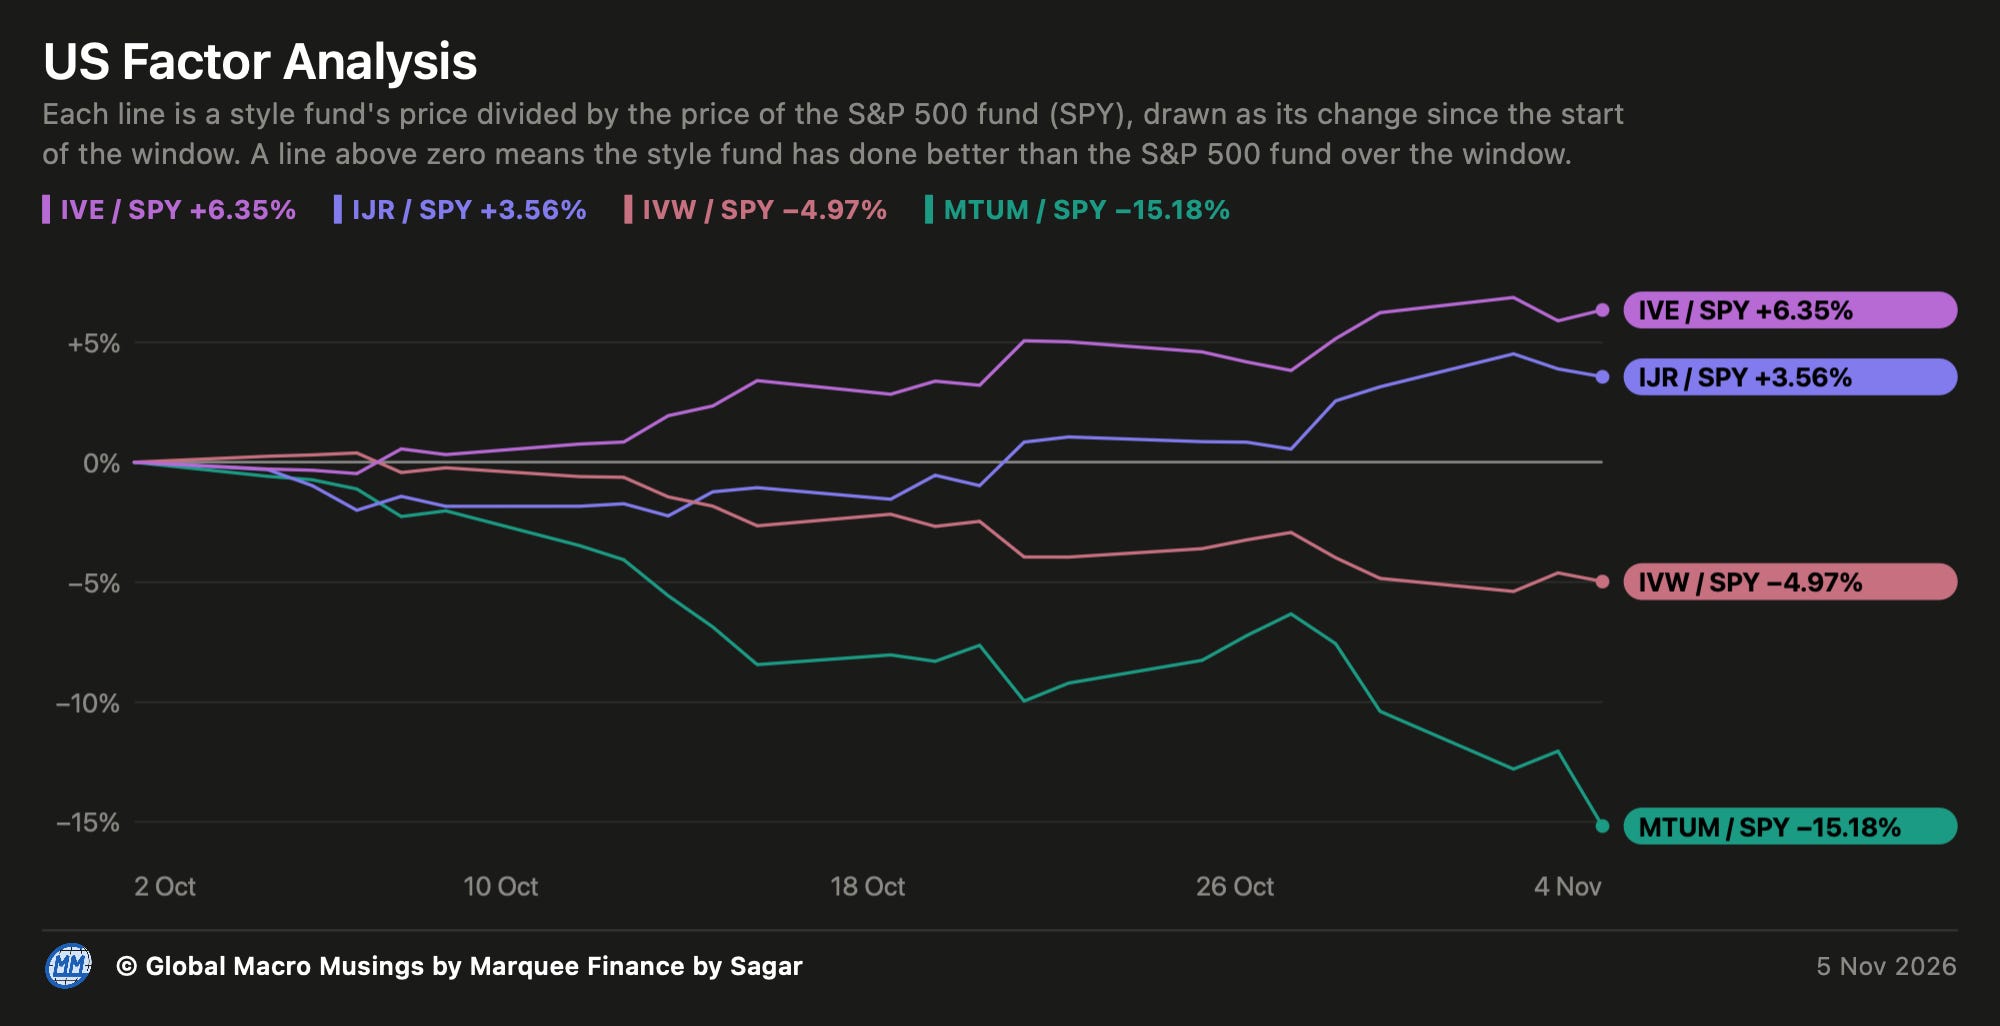
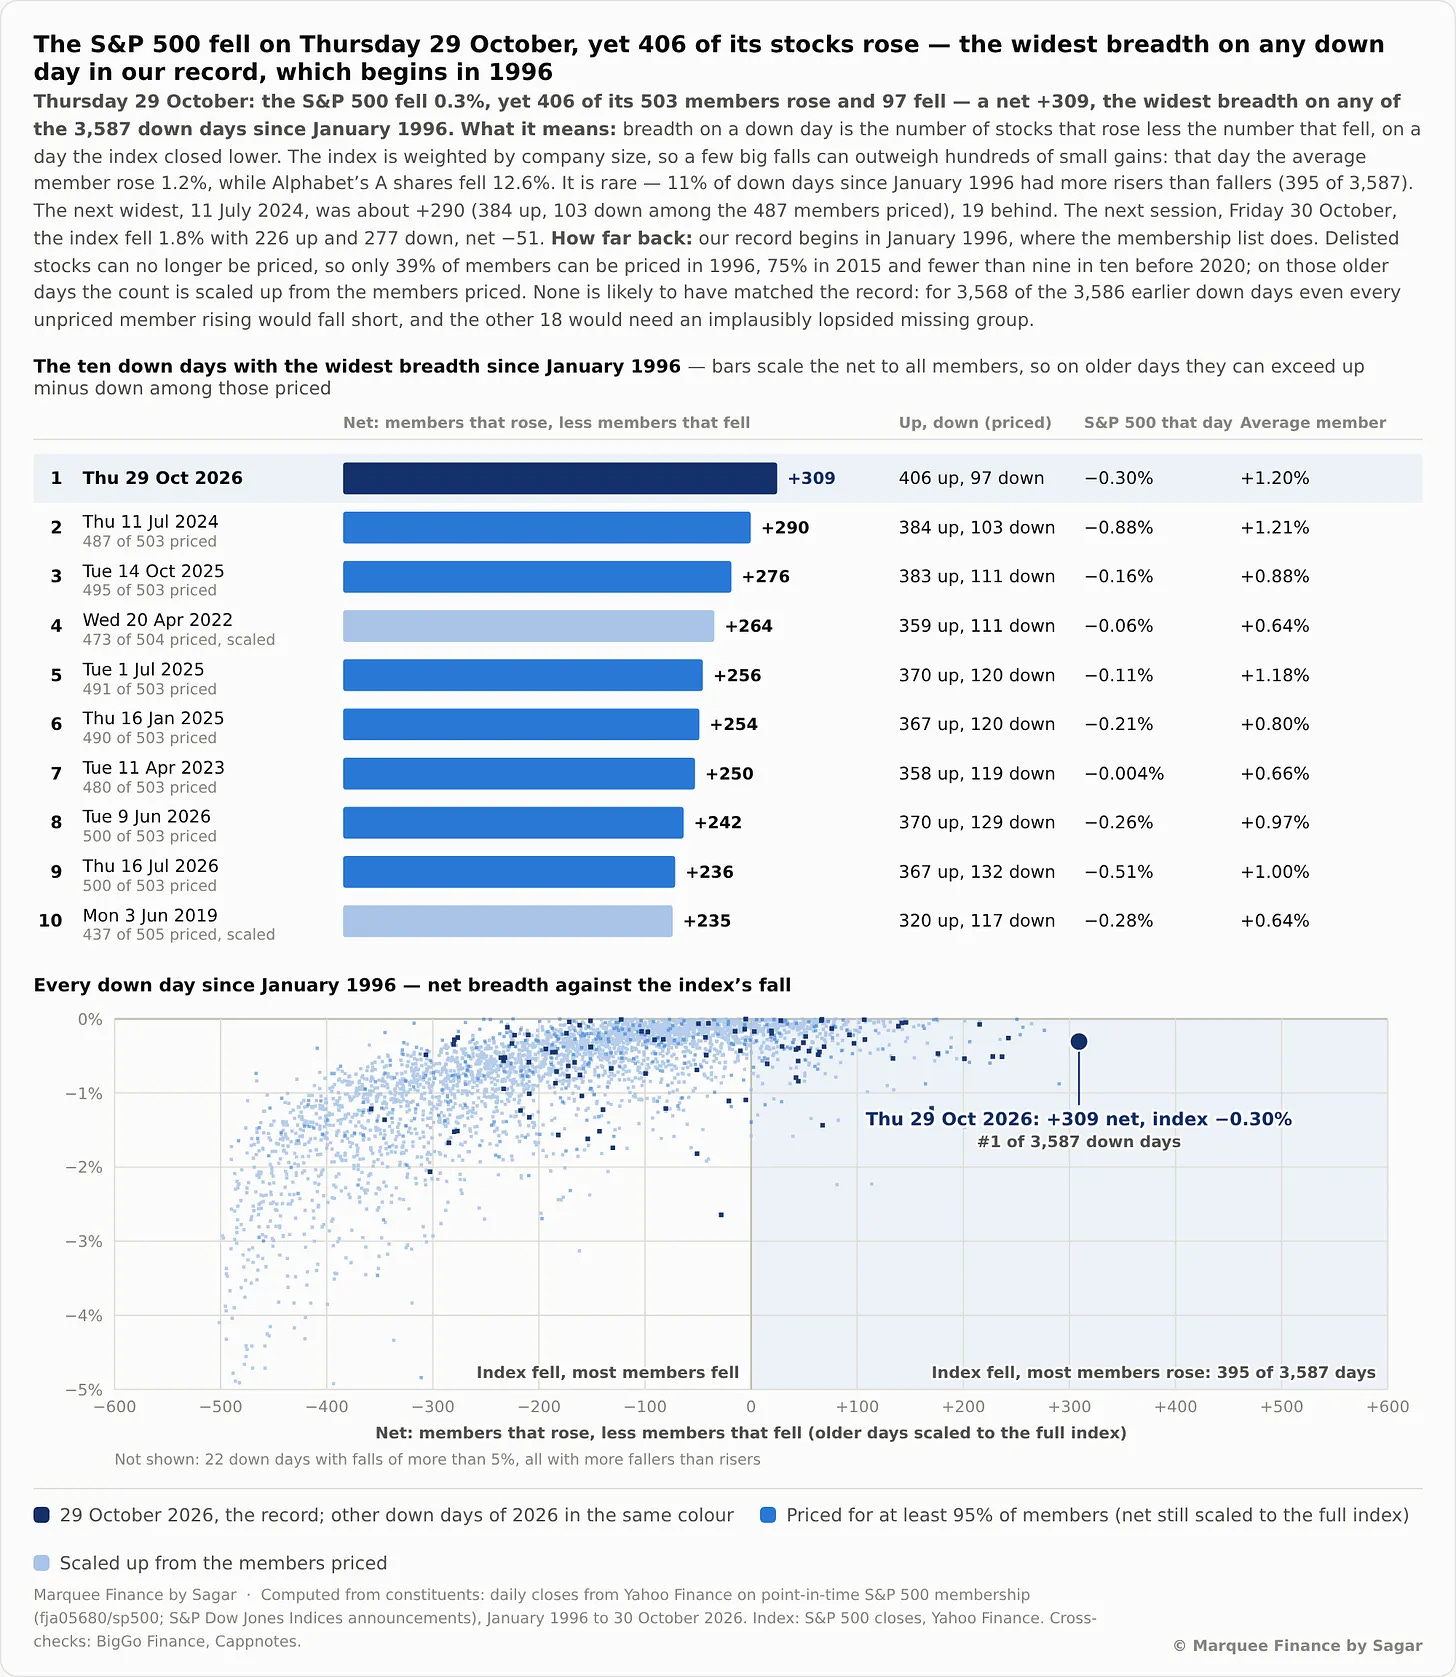
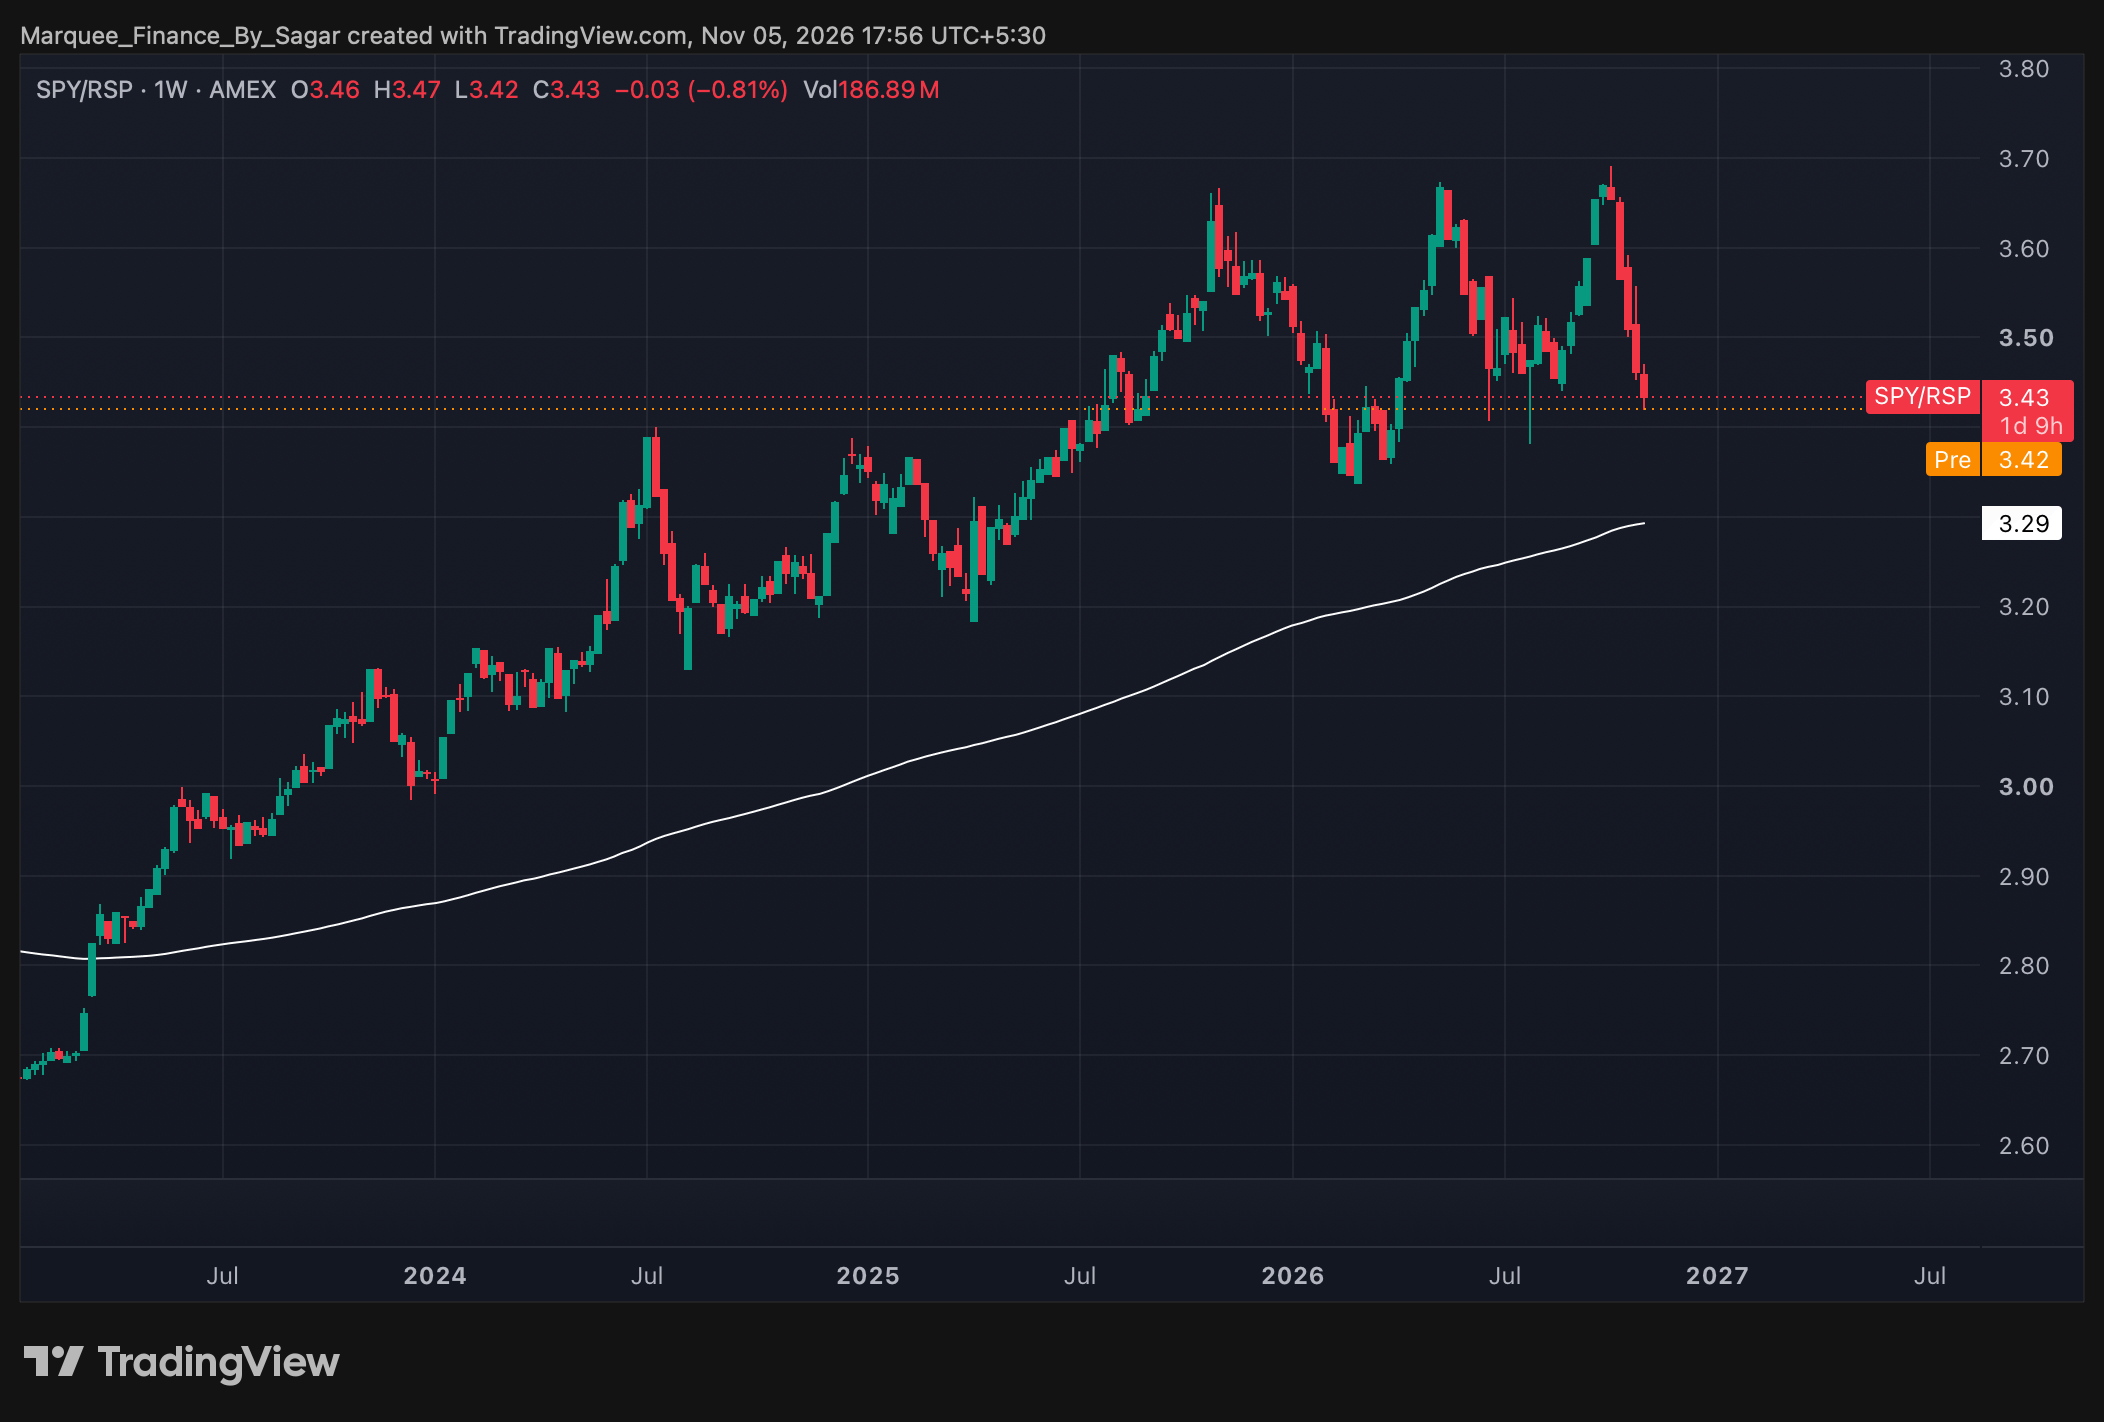
US equity markets saw a historic rotation in the last week of October, with the widest breadth on record on a down day since 1996.
406 stocks were up on 29th October with an average gain of 1.2%, while the S&P 500 fell by 30 bps.
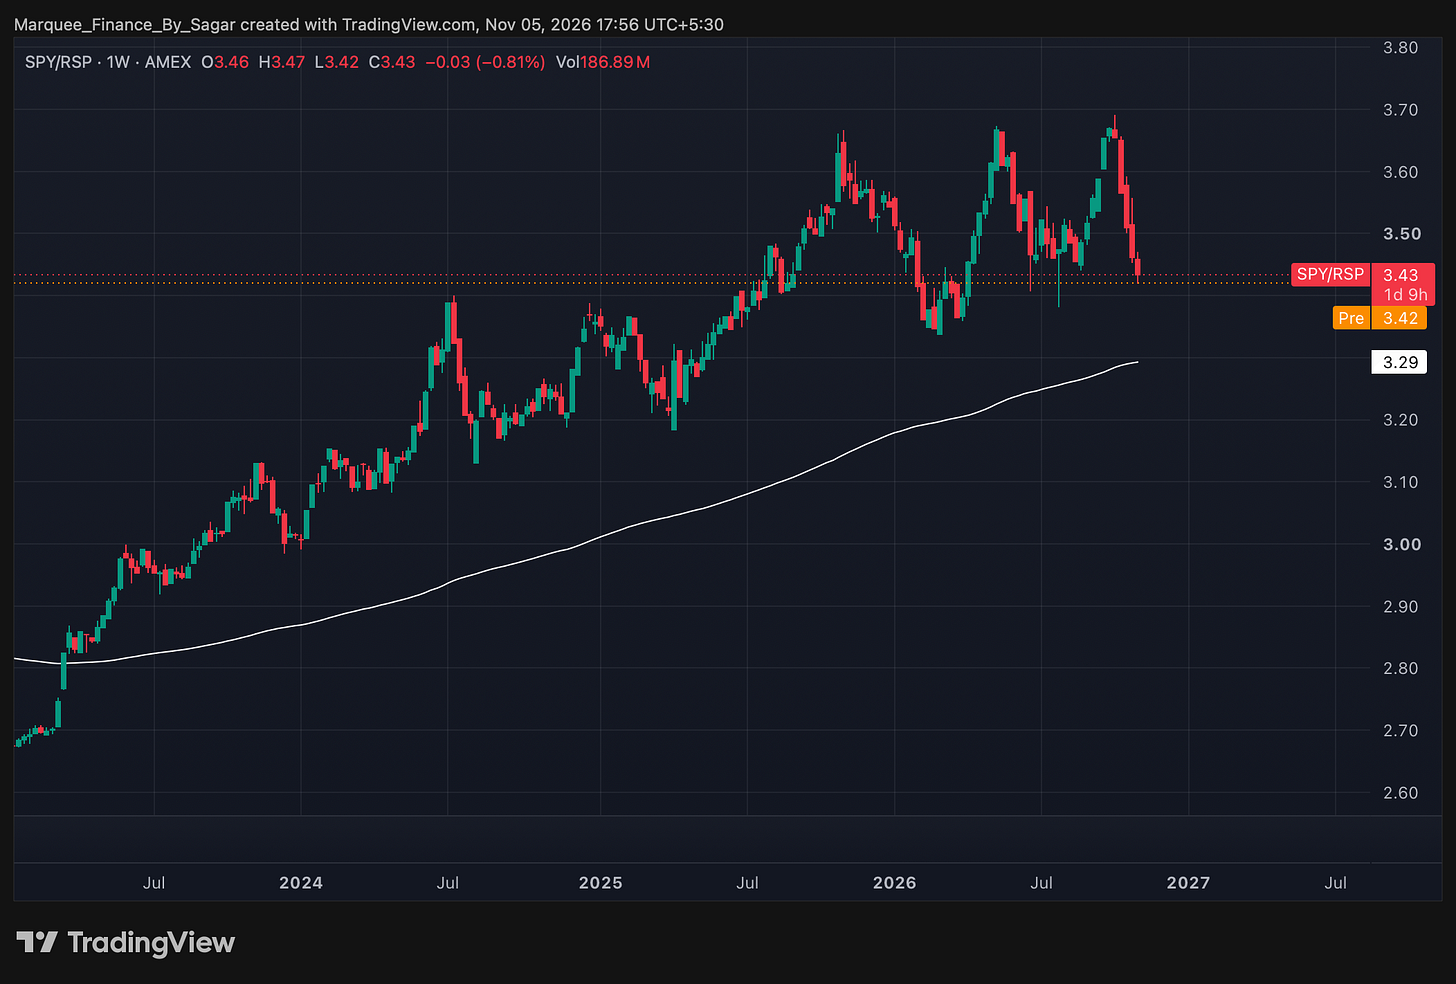
Positive breadth means the equal-weight index continues to outperform the market-weight index massively.
We believe that if the AI bubble has indeed popped, we will see further outperformance.
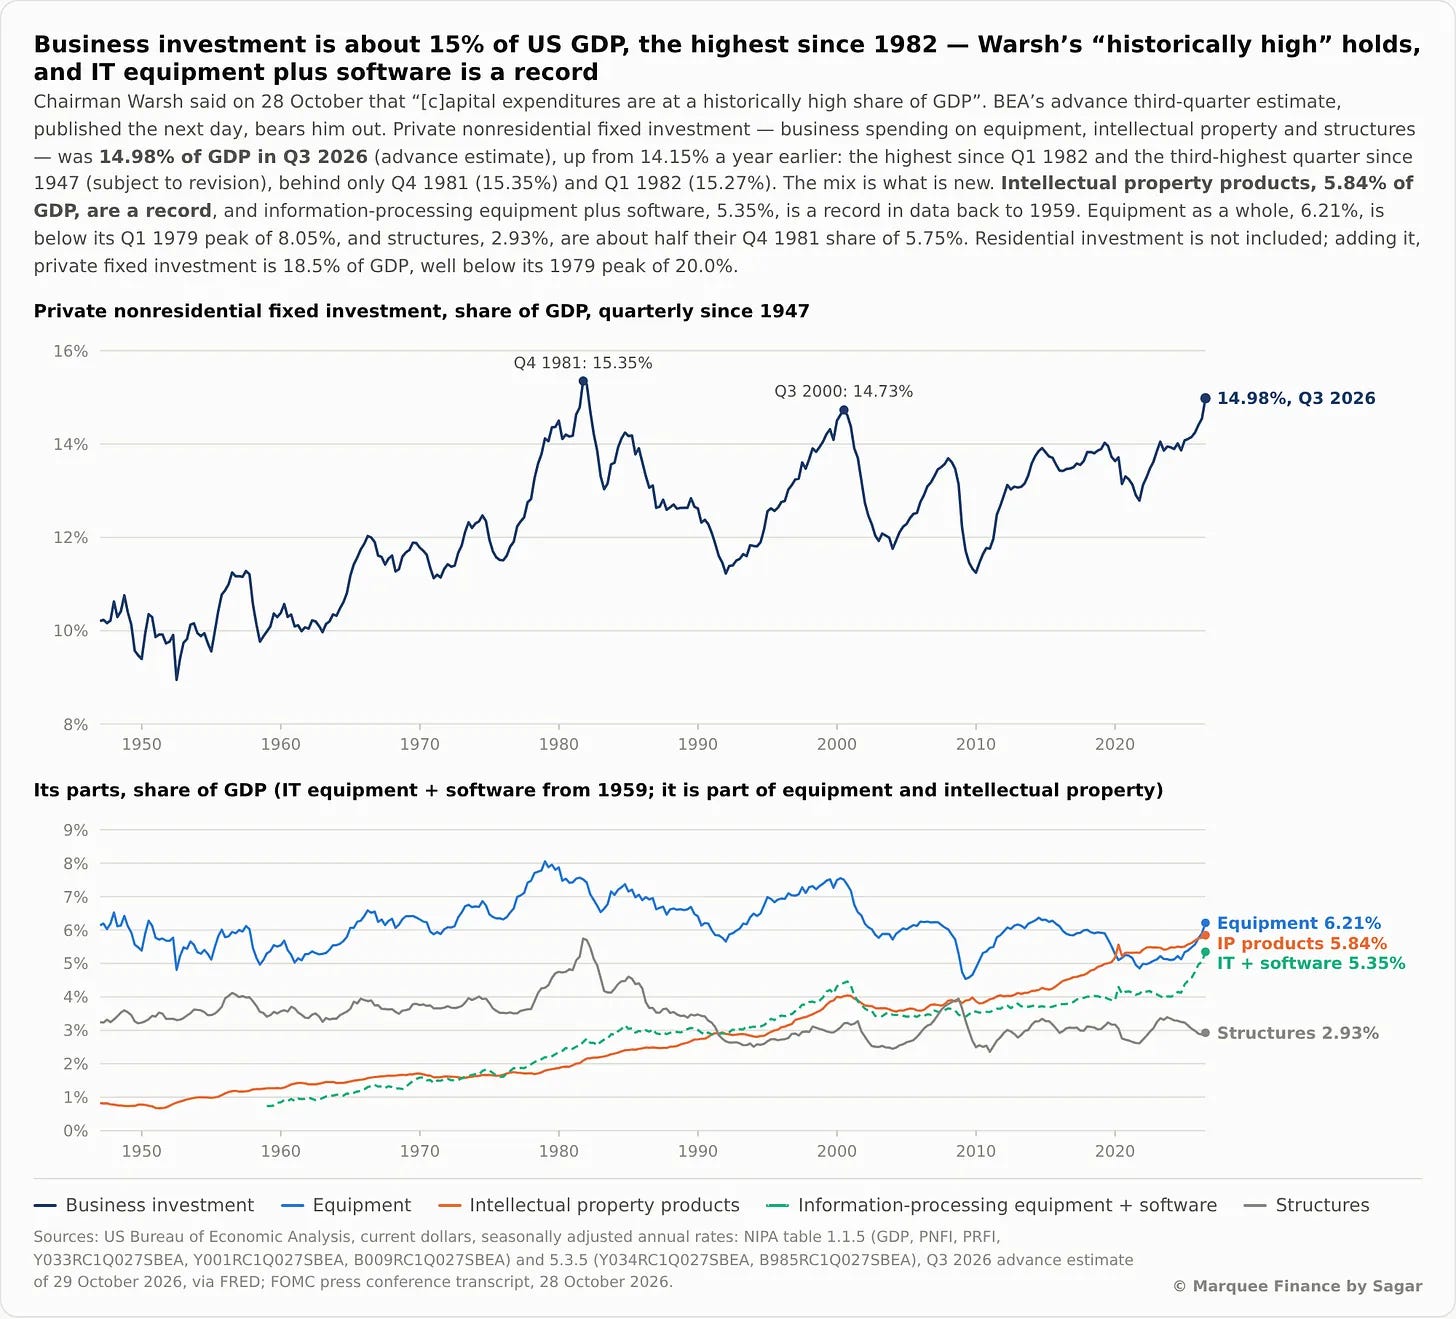
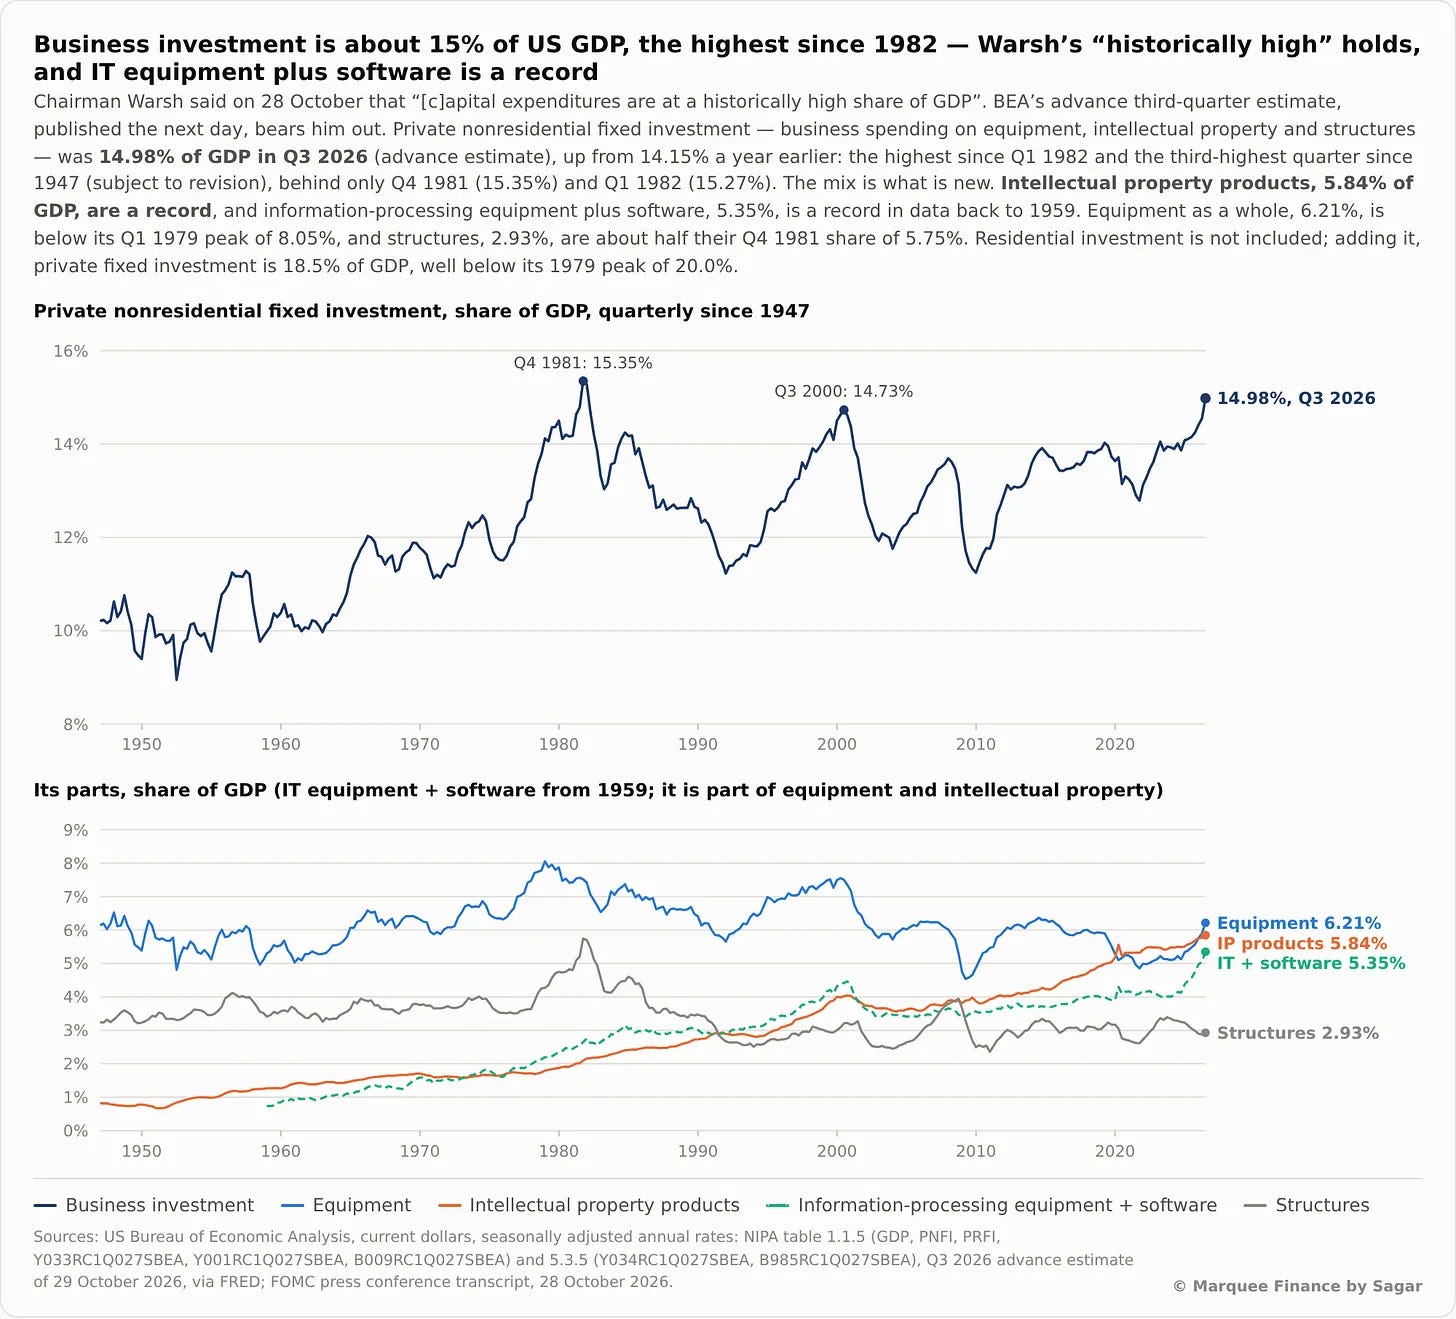
The AI rollout remains an enormous tailwind for higher GDP, with Equipment and IP contributing 1.63% to GDP as data centre construction spending reached mind-boggling levels.
Chairman Warsh also acknowledged this at the recently concluded FOMC. Nonetheless, with the blue Tsunami in the US mid-term elections, we might have seen the peak in AI capex.
GOP lost the US elections by a historic margin, and the Republicans lost their core rural voters.
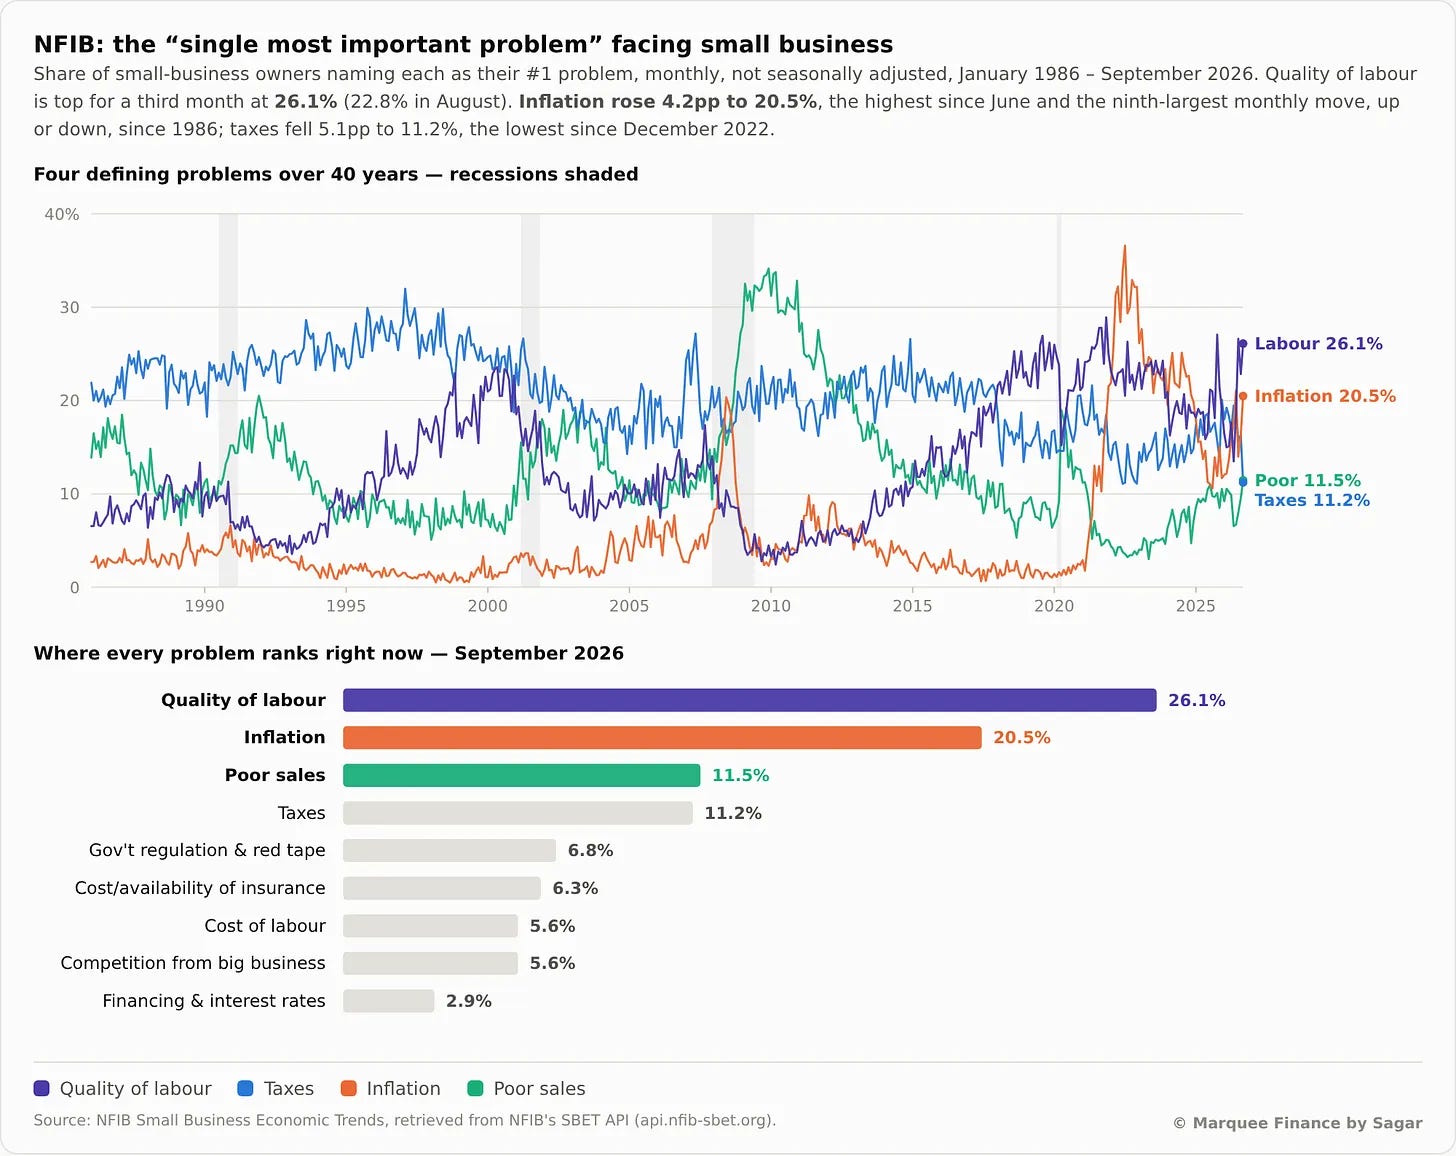
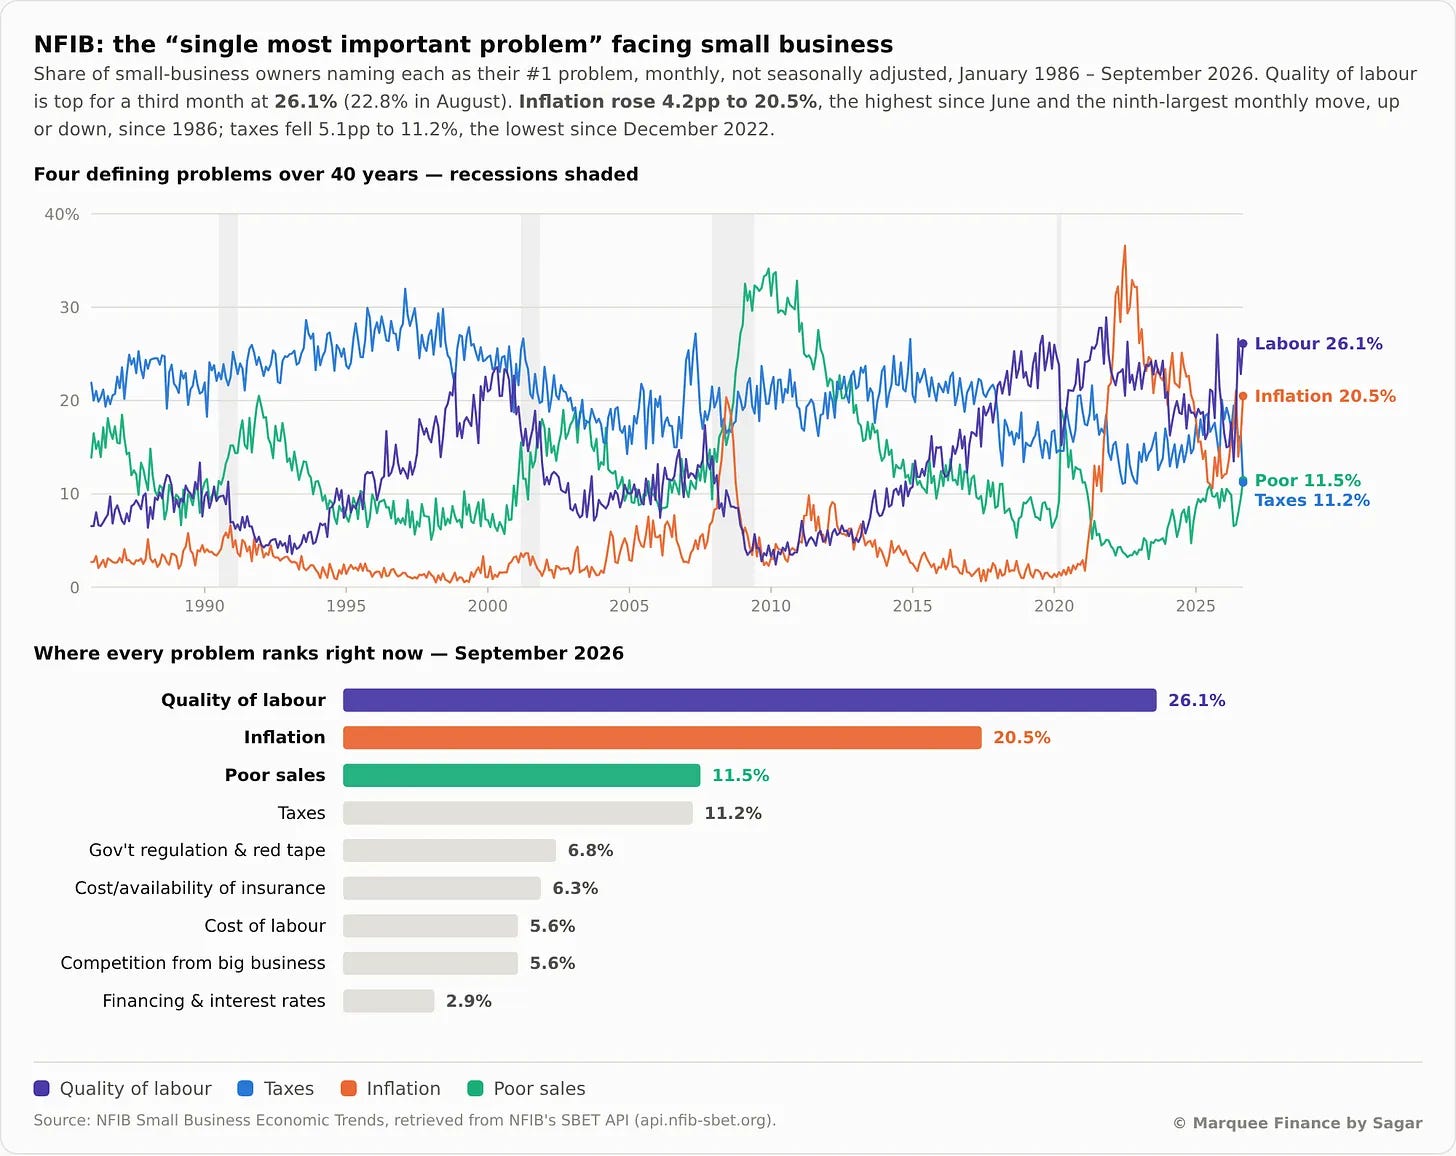
Small businesses that have leaned Republican for decades flipped. The data made the reason clear, as the NFIB Small Business Survey reveals.
Labour quality and inflation jumped to the single most important problem last month (immigration policy has been a disaster, creating a significant labour problem).
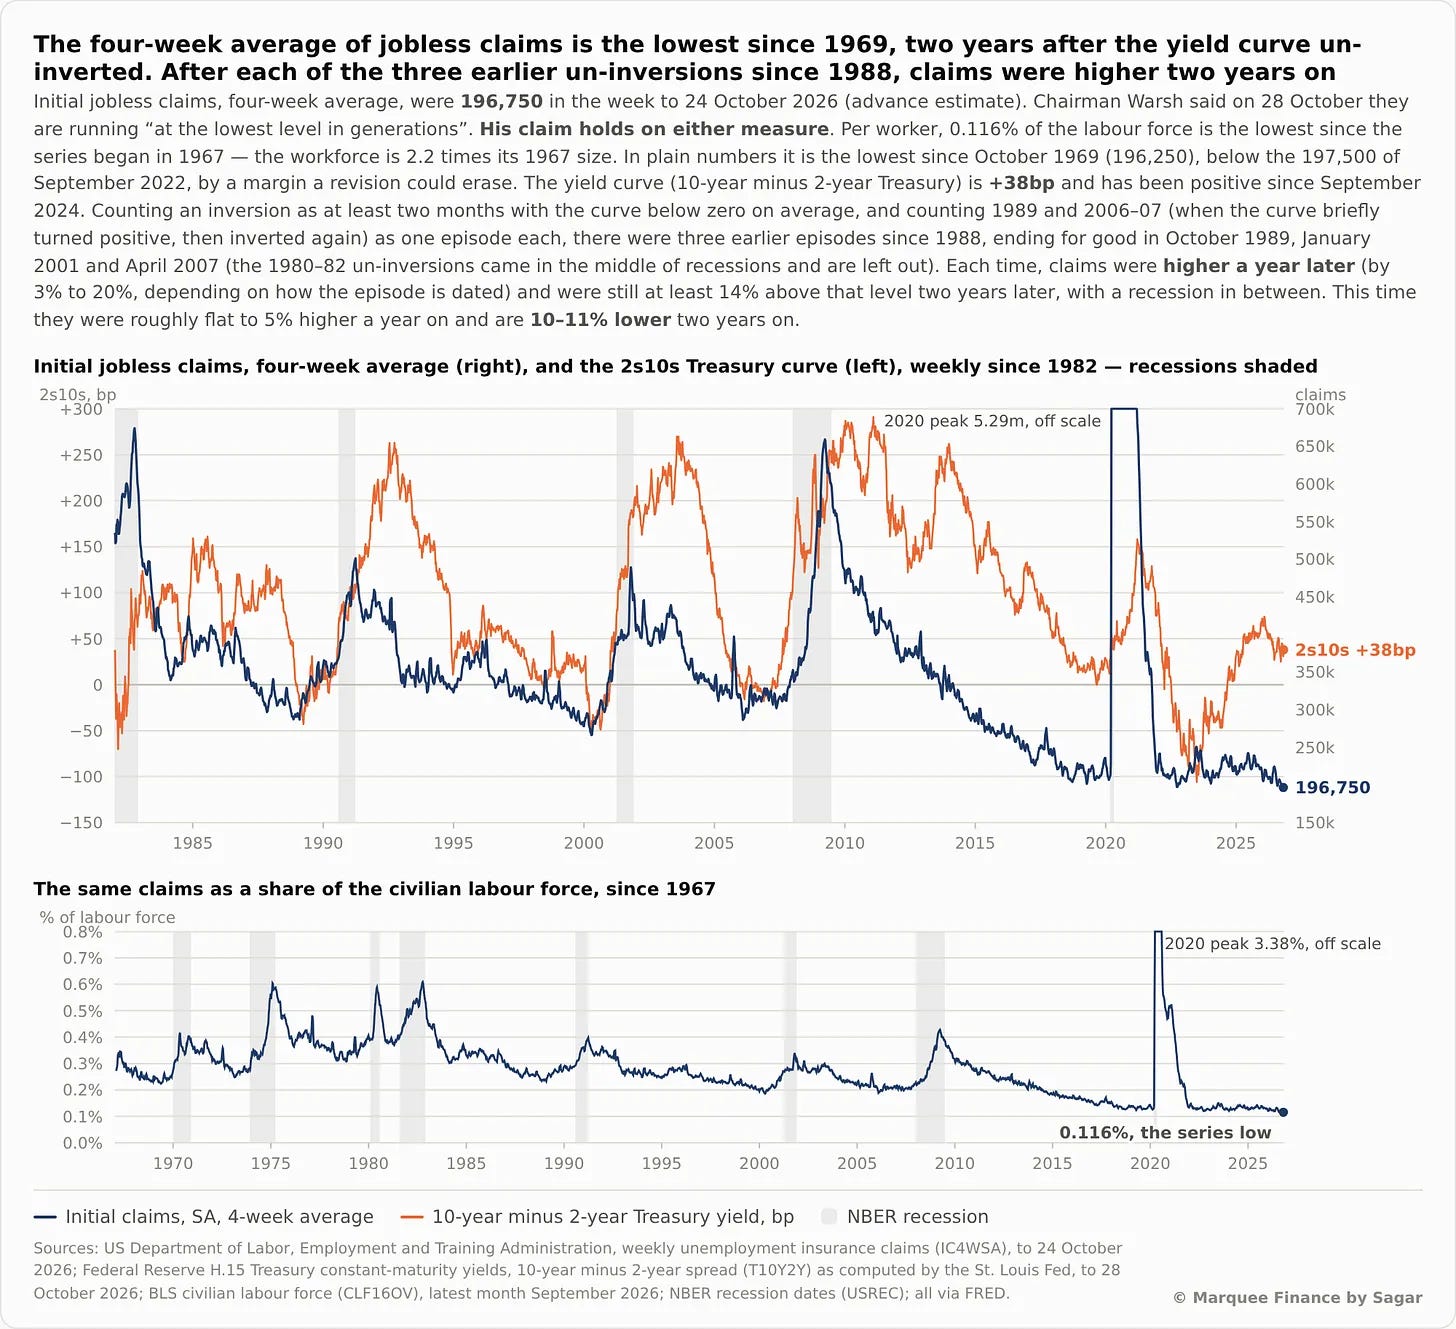
As job layoffs rise exponentially, and the US economy slows due to a slowdown in AI capex, we can expect jobless claims to rise.
Note that they are at their lowest levels since 1969.

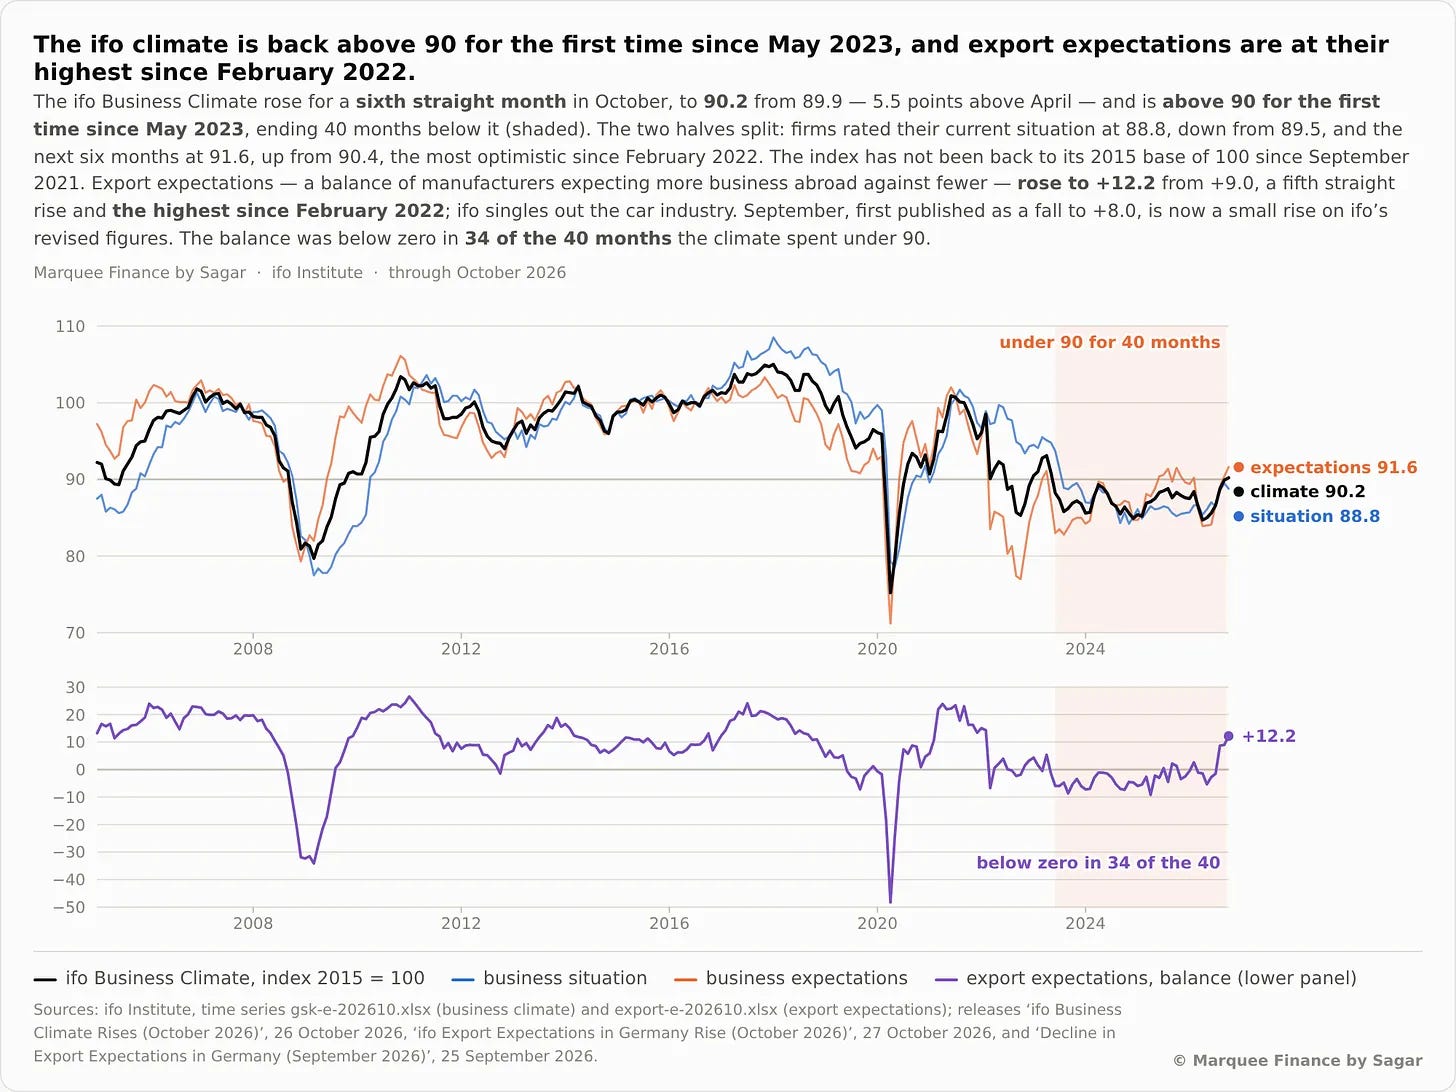
The soft data continues to turn for good in Germany.
The IFO Business Climate rose to 90.2 from 89.9. That’s a sixth straight rise and the first reading above 90 since May 2023.
Firms’ view of their current situation slipped to 88.8 from 89.5. Expectations rose to 91.6 from 90.4, the most optimistic since February 2022.
Export expectations: +12.2 from +9.0. That’s a fifth straight rise and the highest since February 2022.
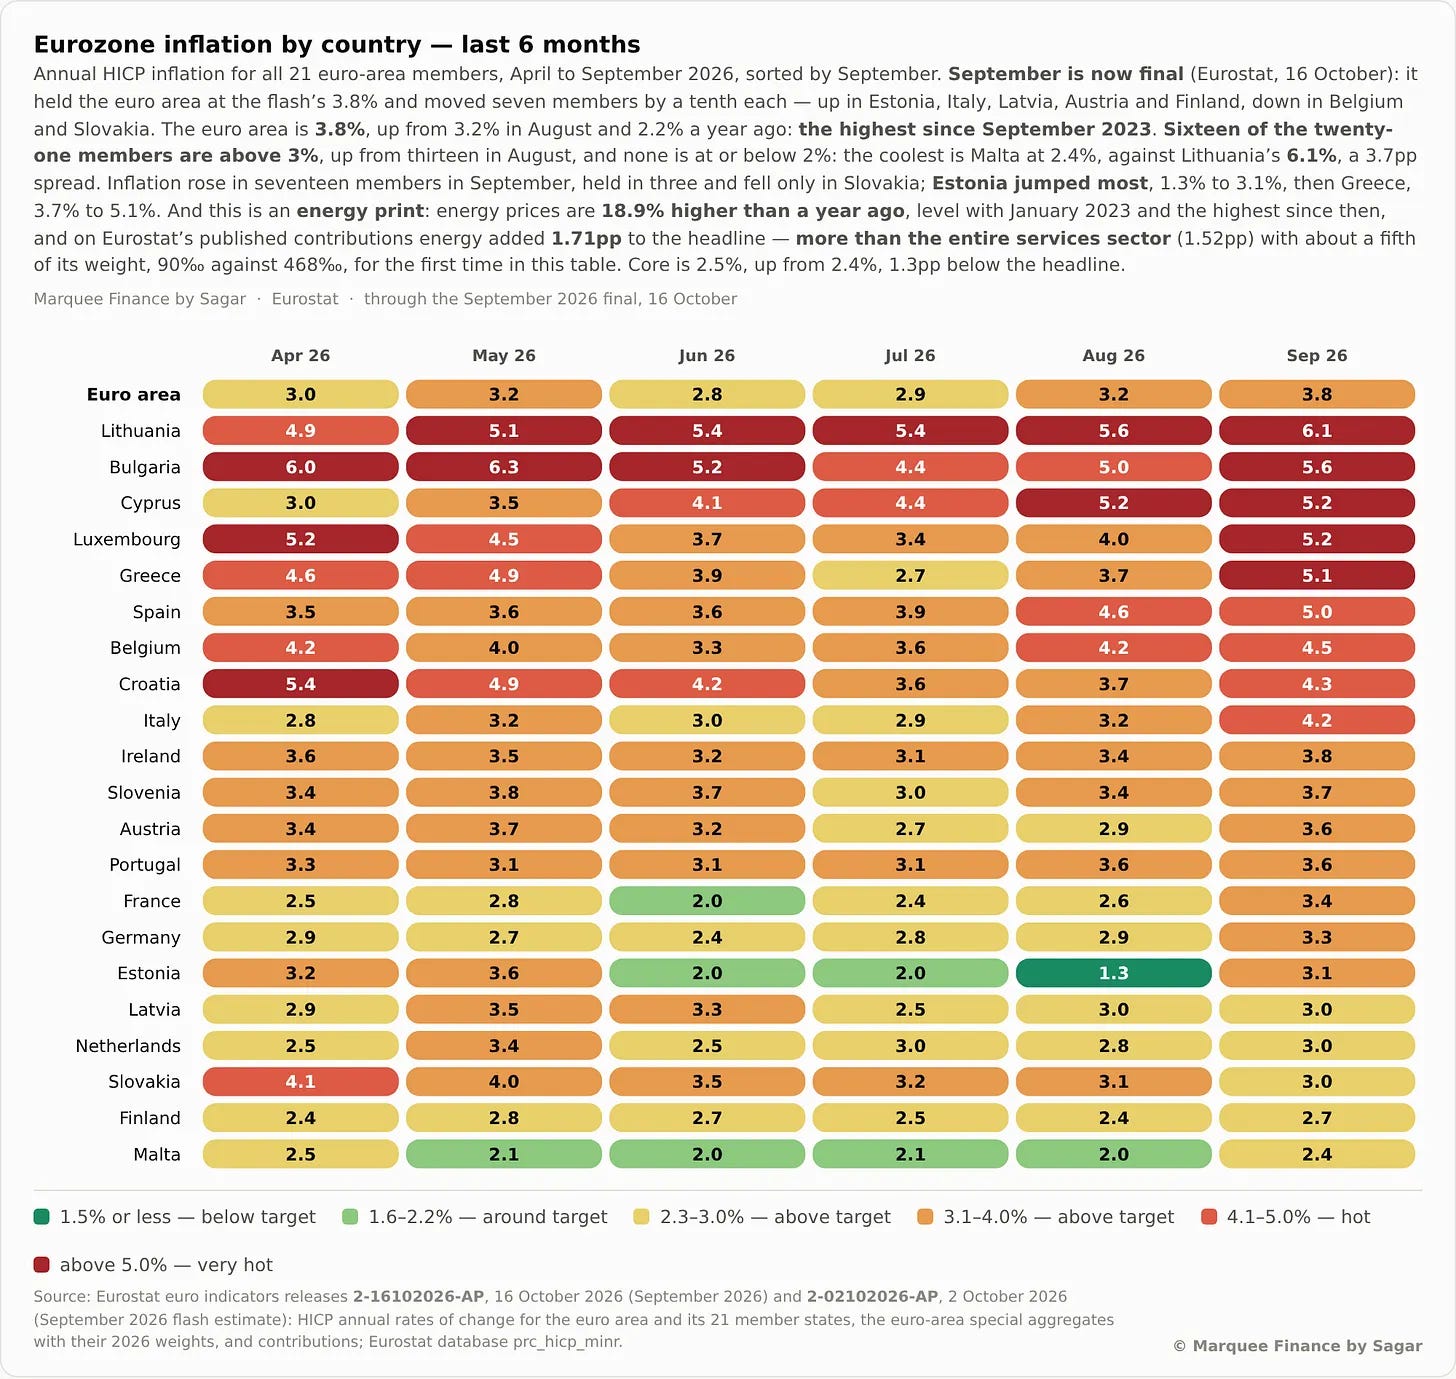
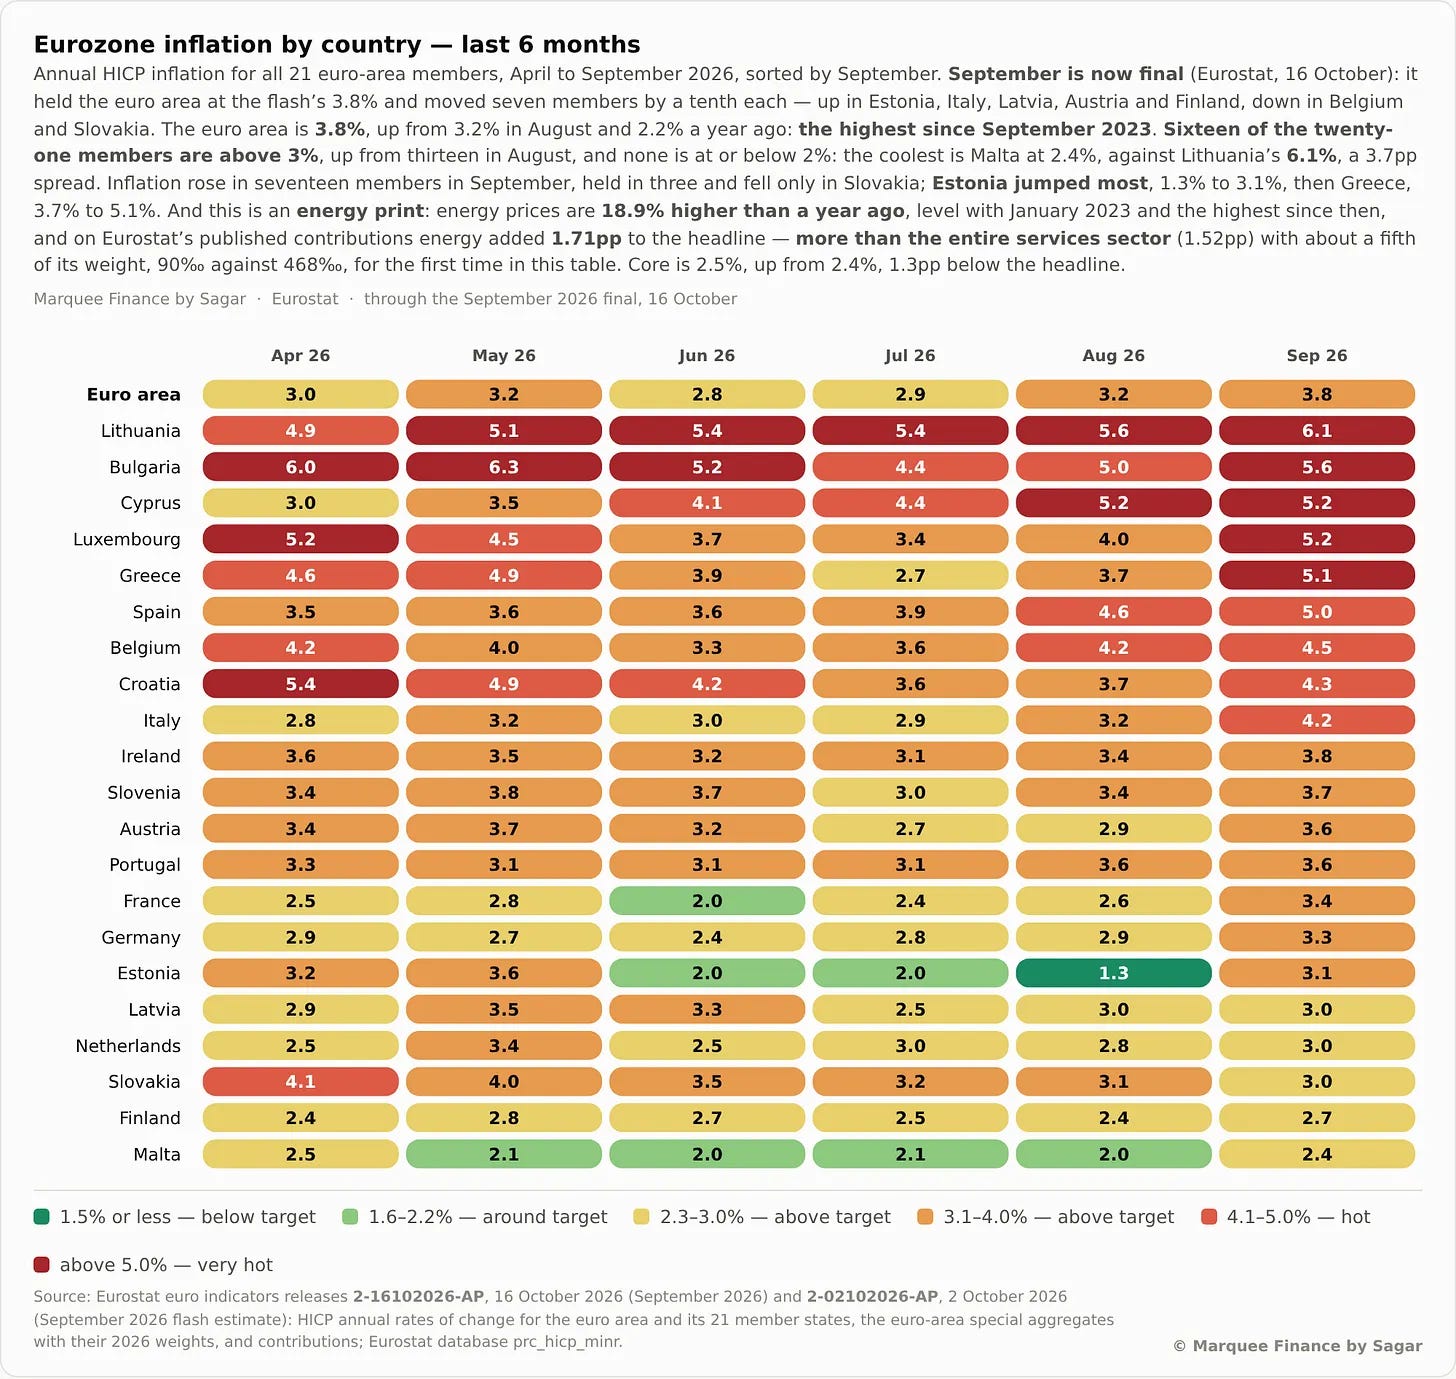
EZ HICP came in at 3.8% YoY, the highest since September 2023.
We expect inflation to rise until the end of Q1 when the base effect kicks in.
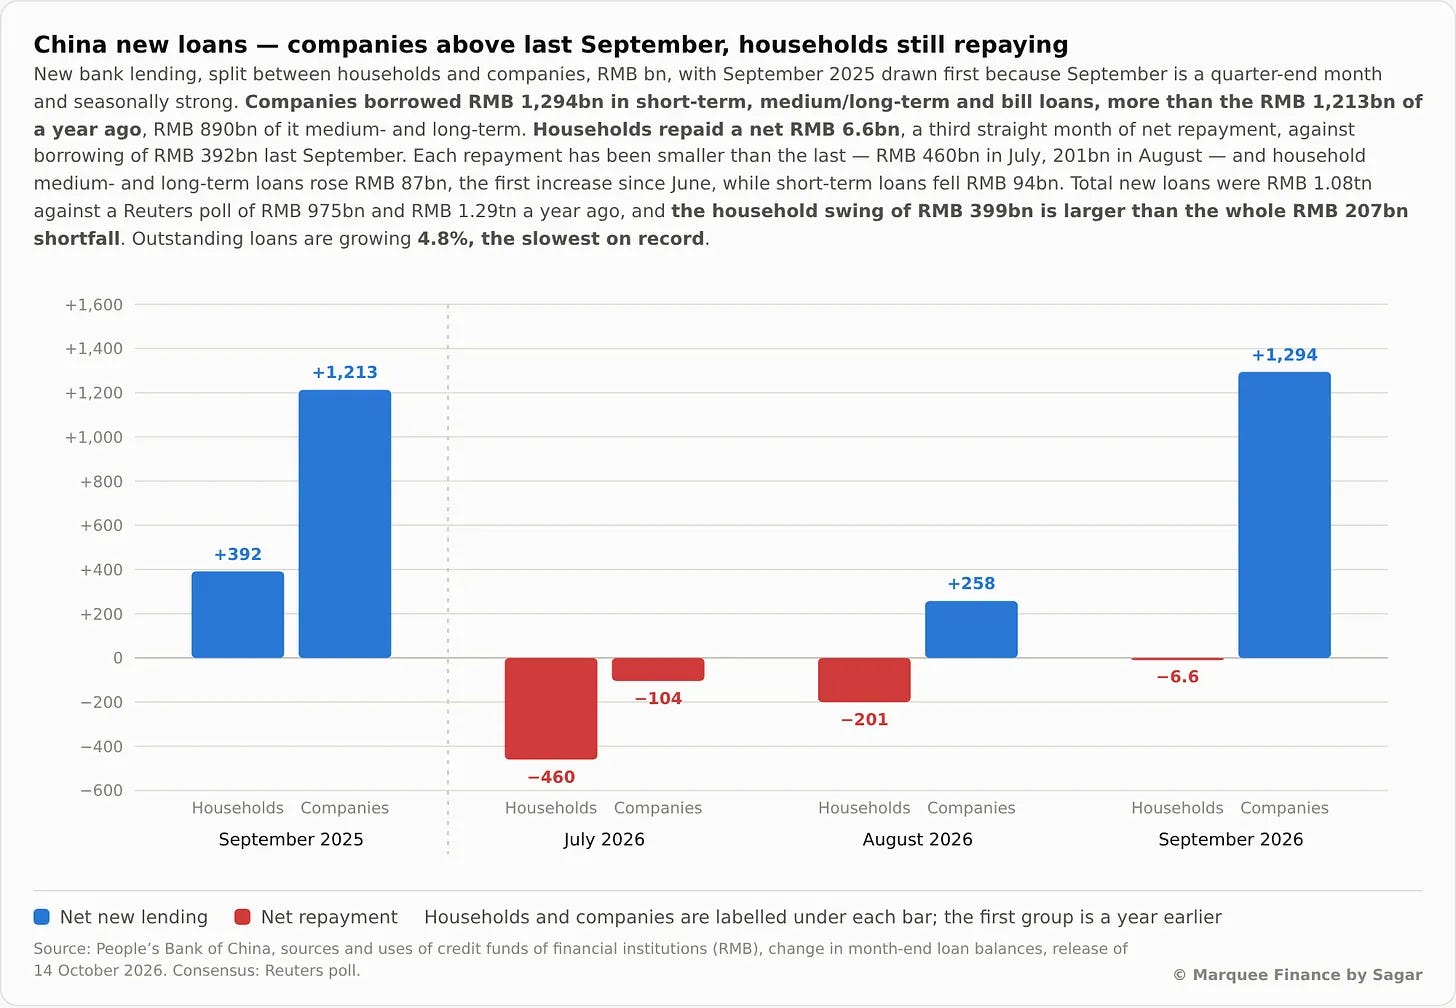
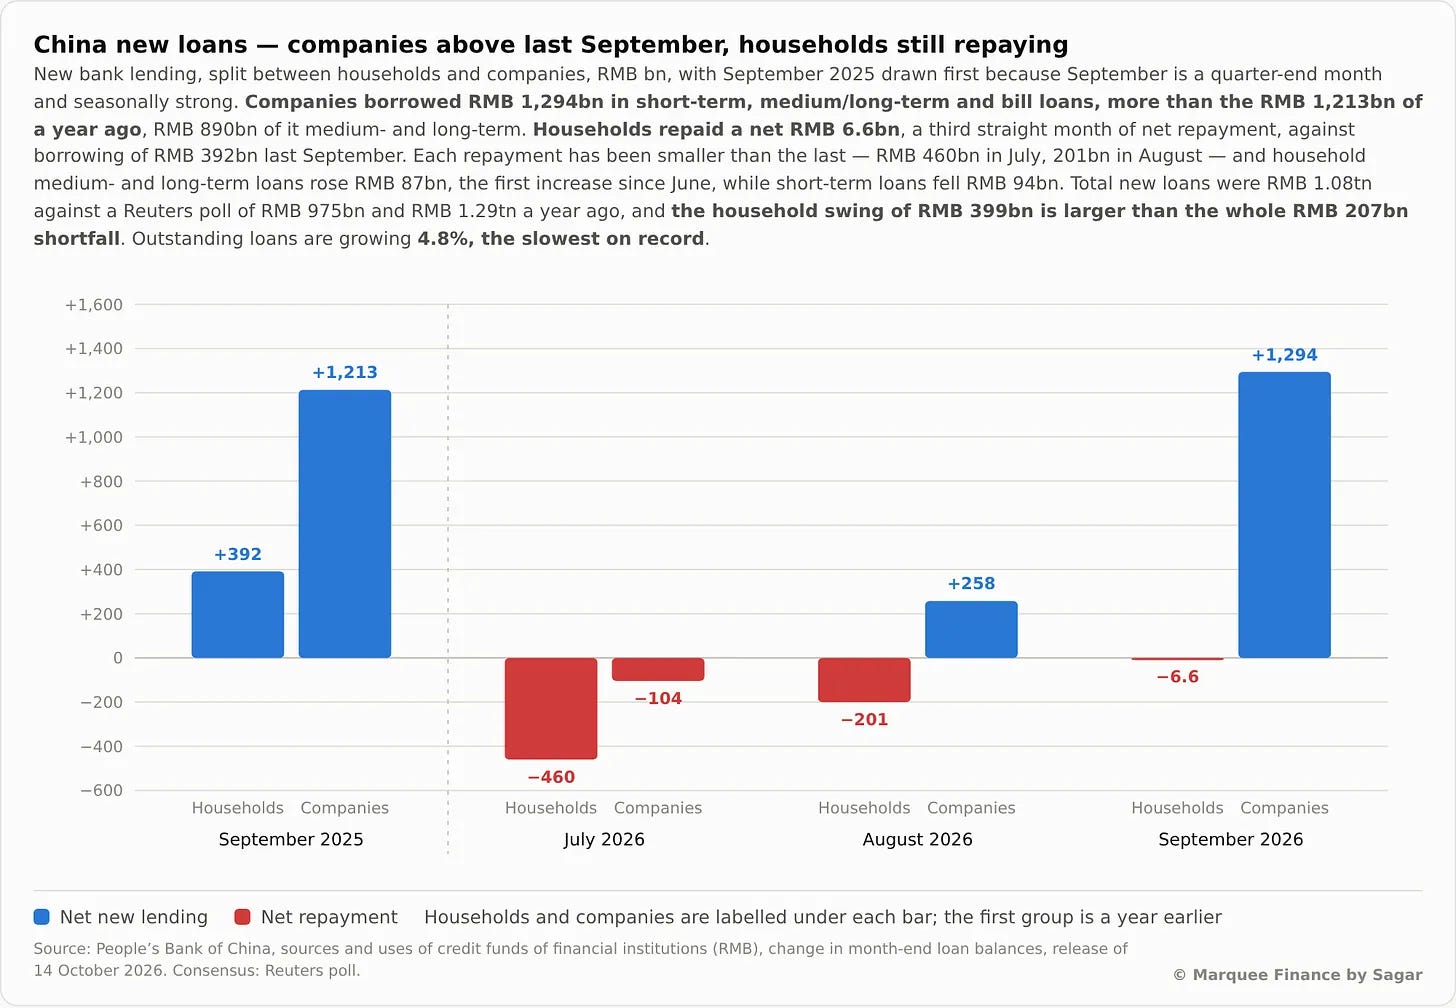
Our favourite Chinese macro data point, Total Social Financing (TSF), continues to disappoint.
September TSF jumped, driven by government bonds. Total came in at RMB 3.5 trillion, up just 0.5% YoY.
While the government is doing the heavy lifting, Households (HHs) and corporates continue to deleverage.
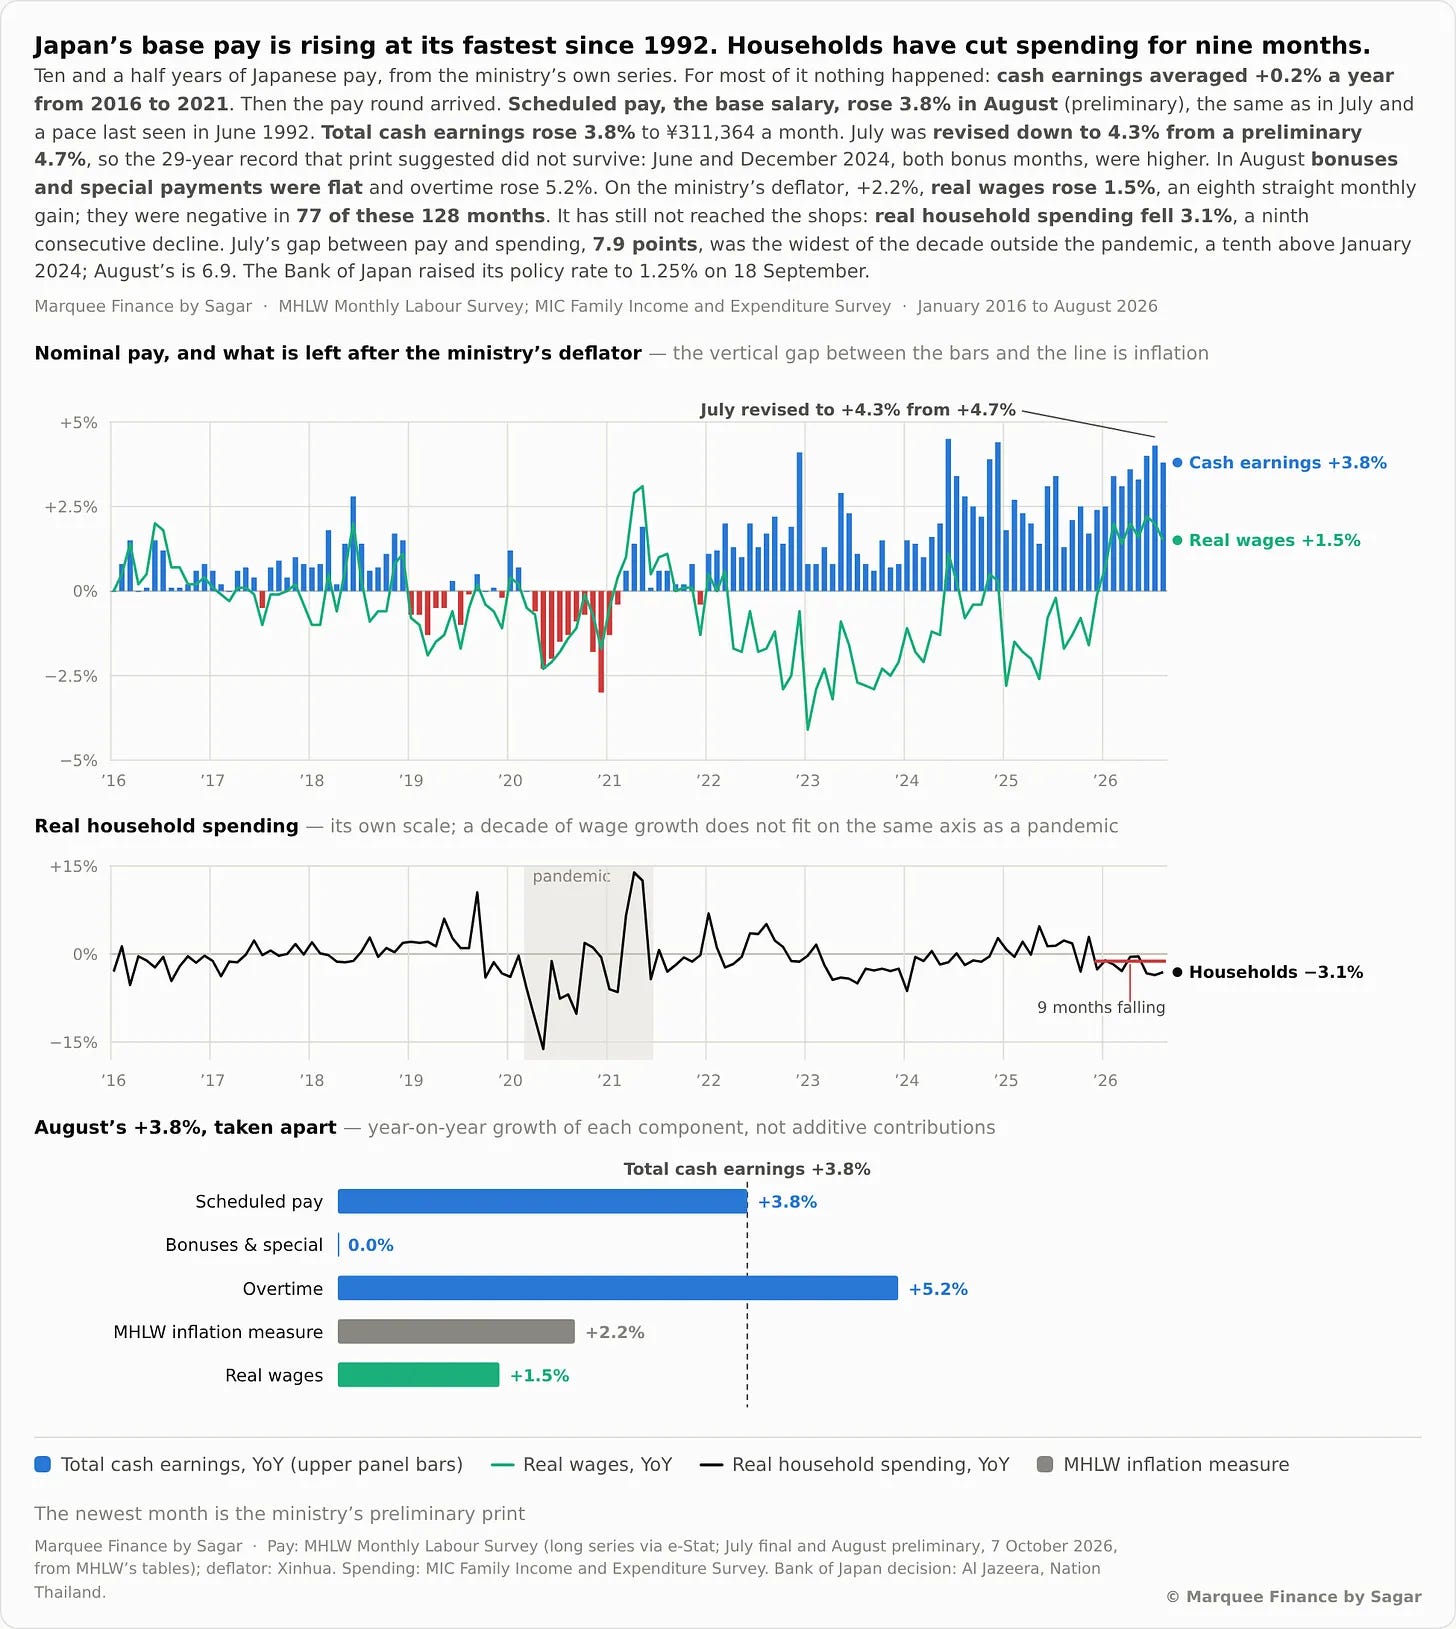
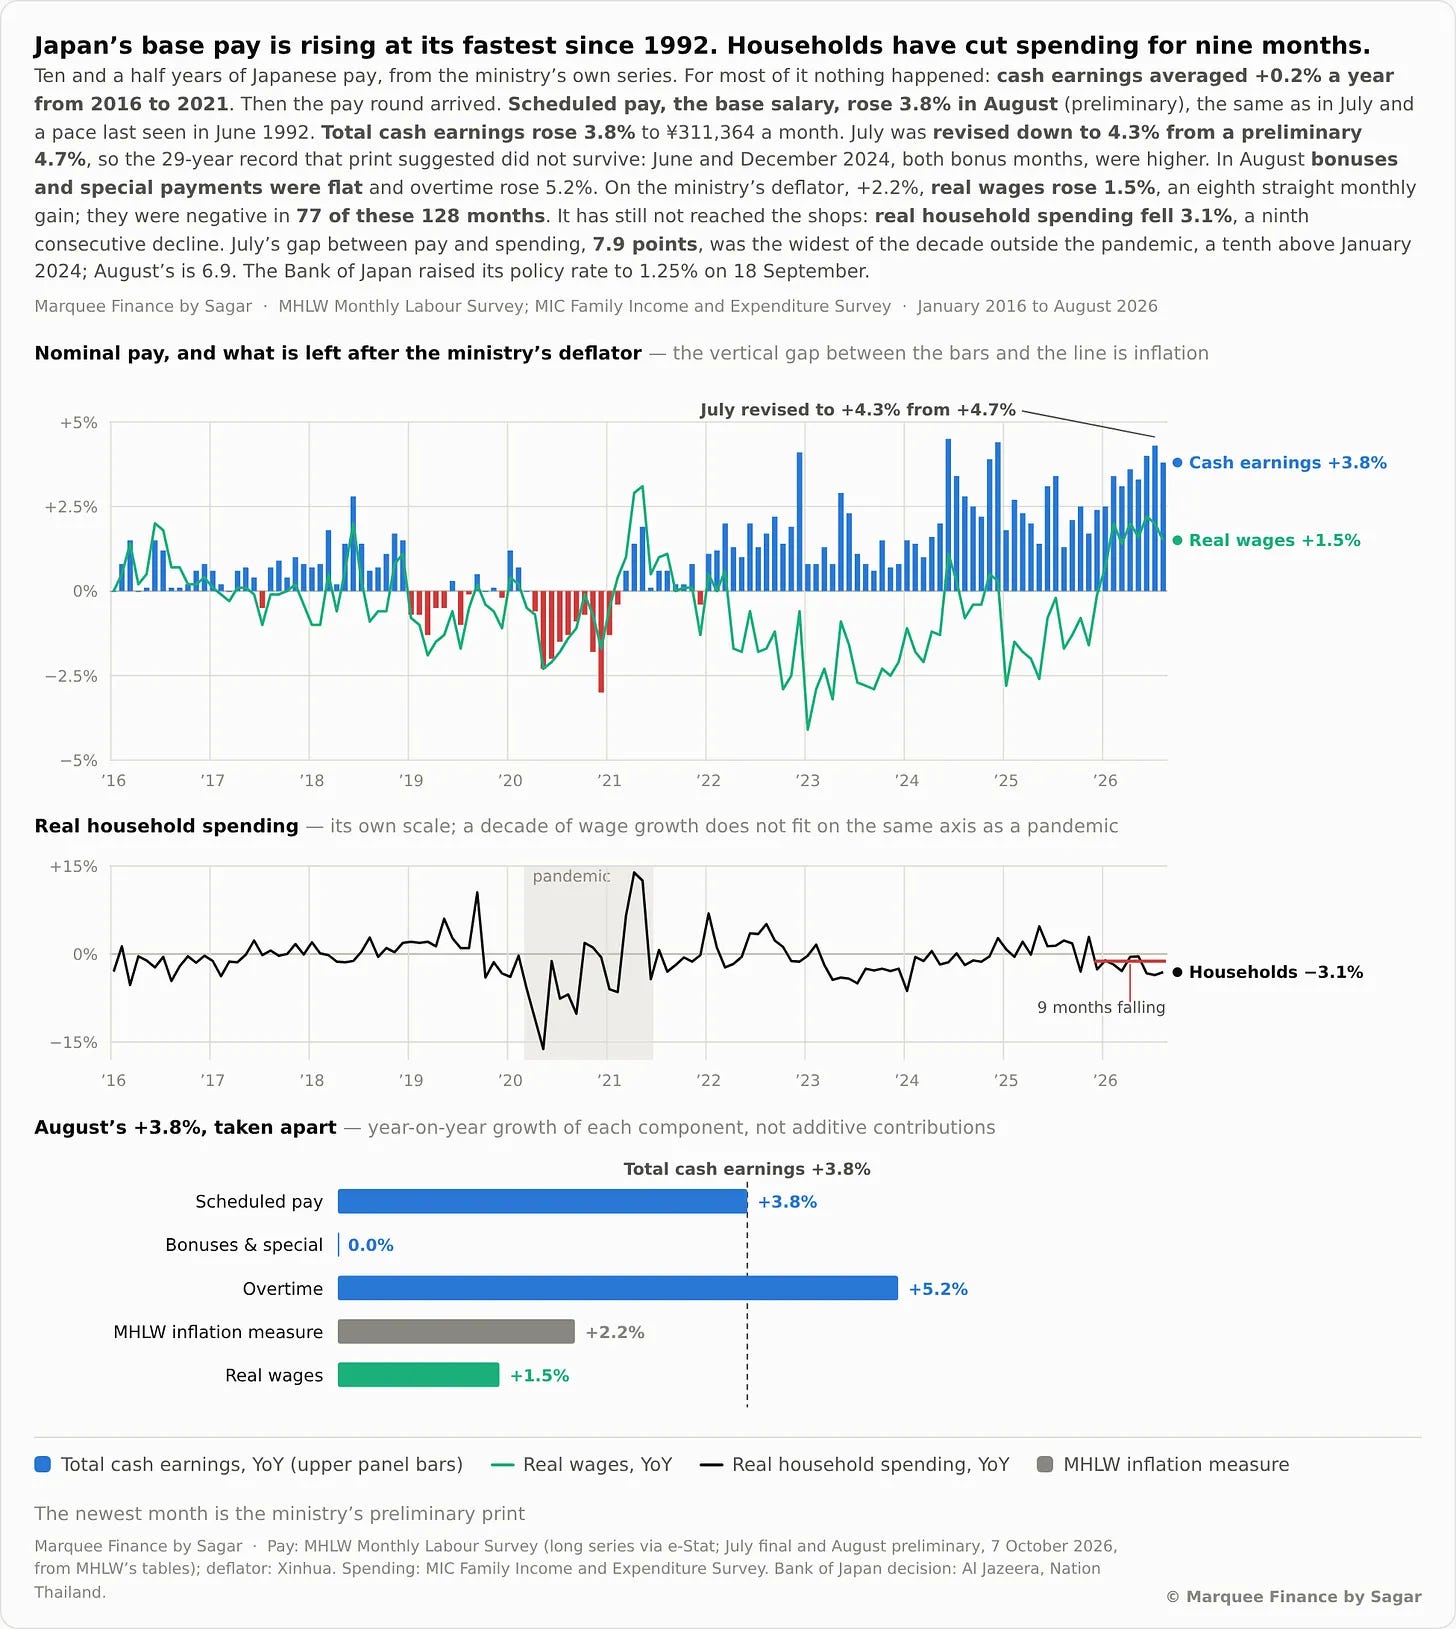
In the land of the rising sun, households continue to cut spending for the 9th month in a row.
We believe that higher rates, along with high inflation, are now affecting consumption.
Despite strong wage growth, cash earnings are up 3.8% YoY; real wages continue to fall as inflation rises.
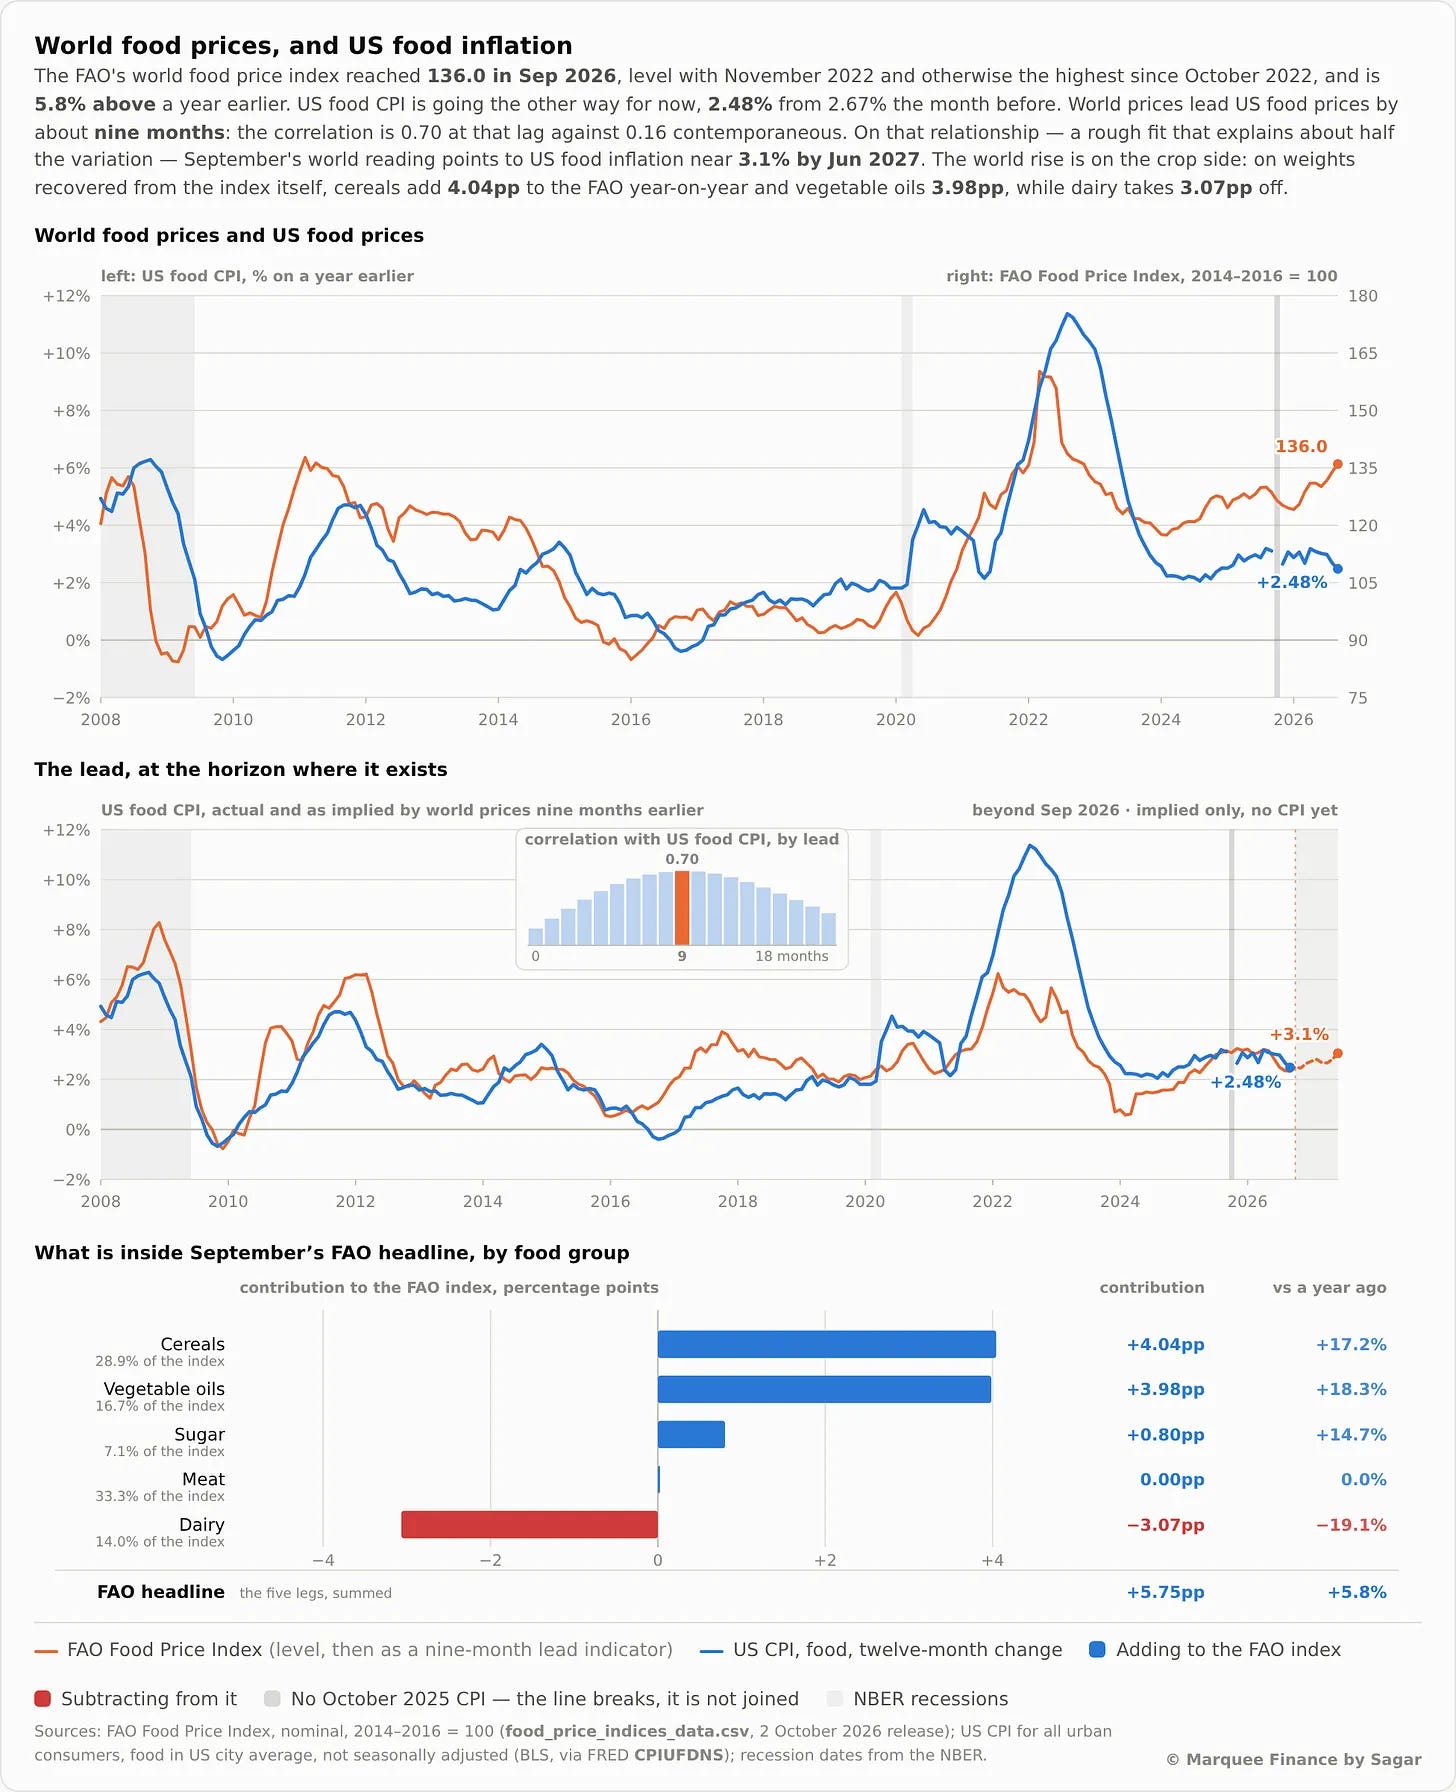
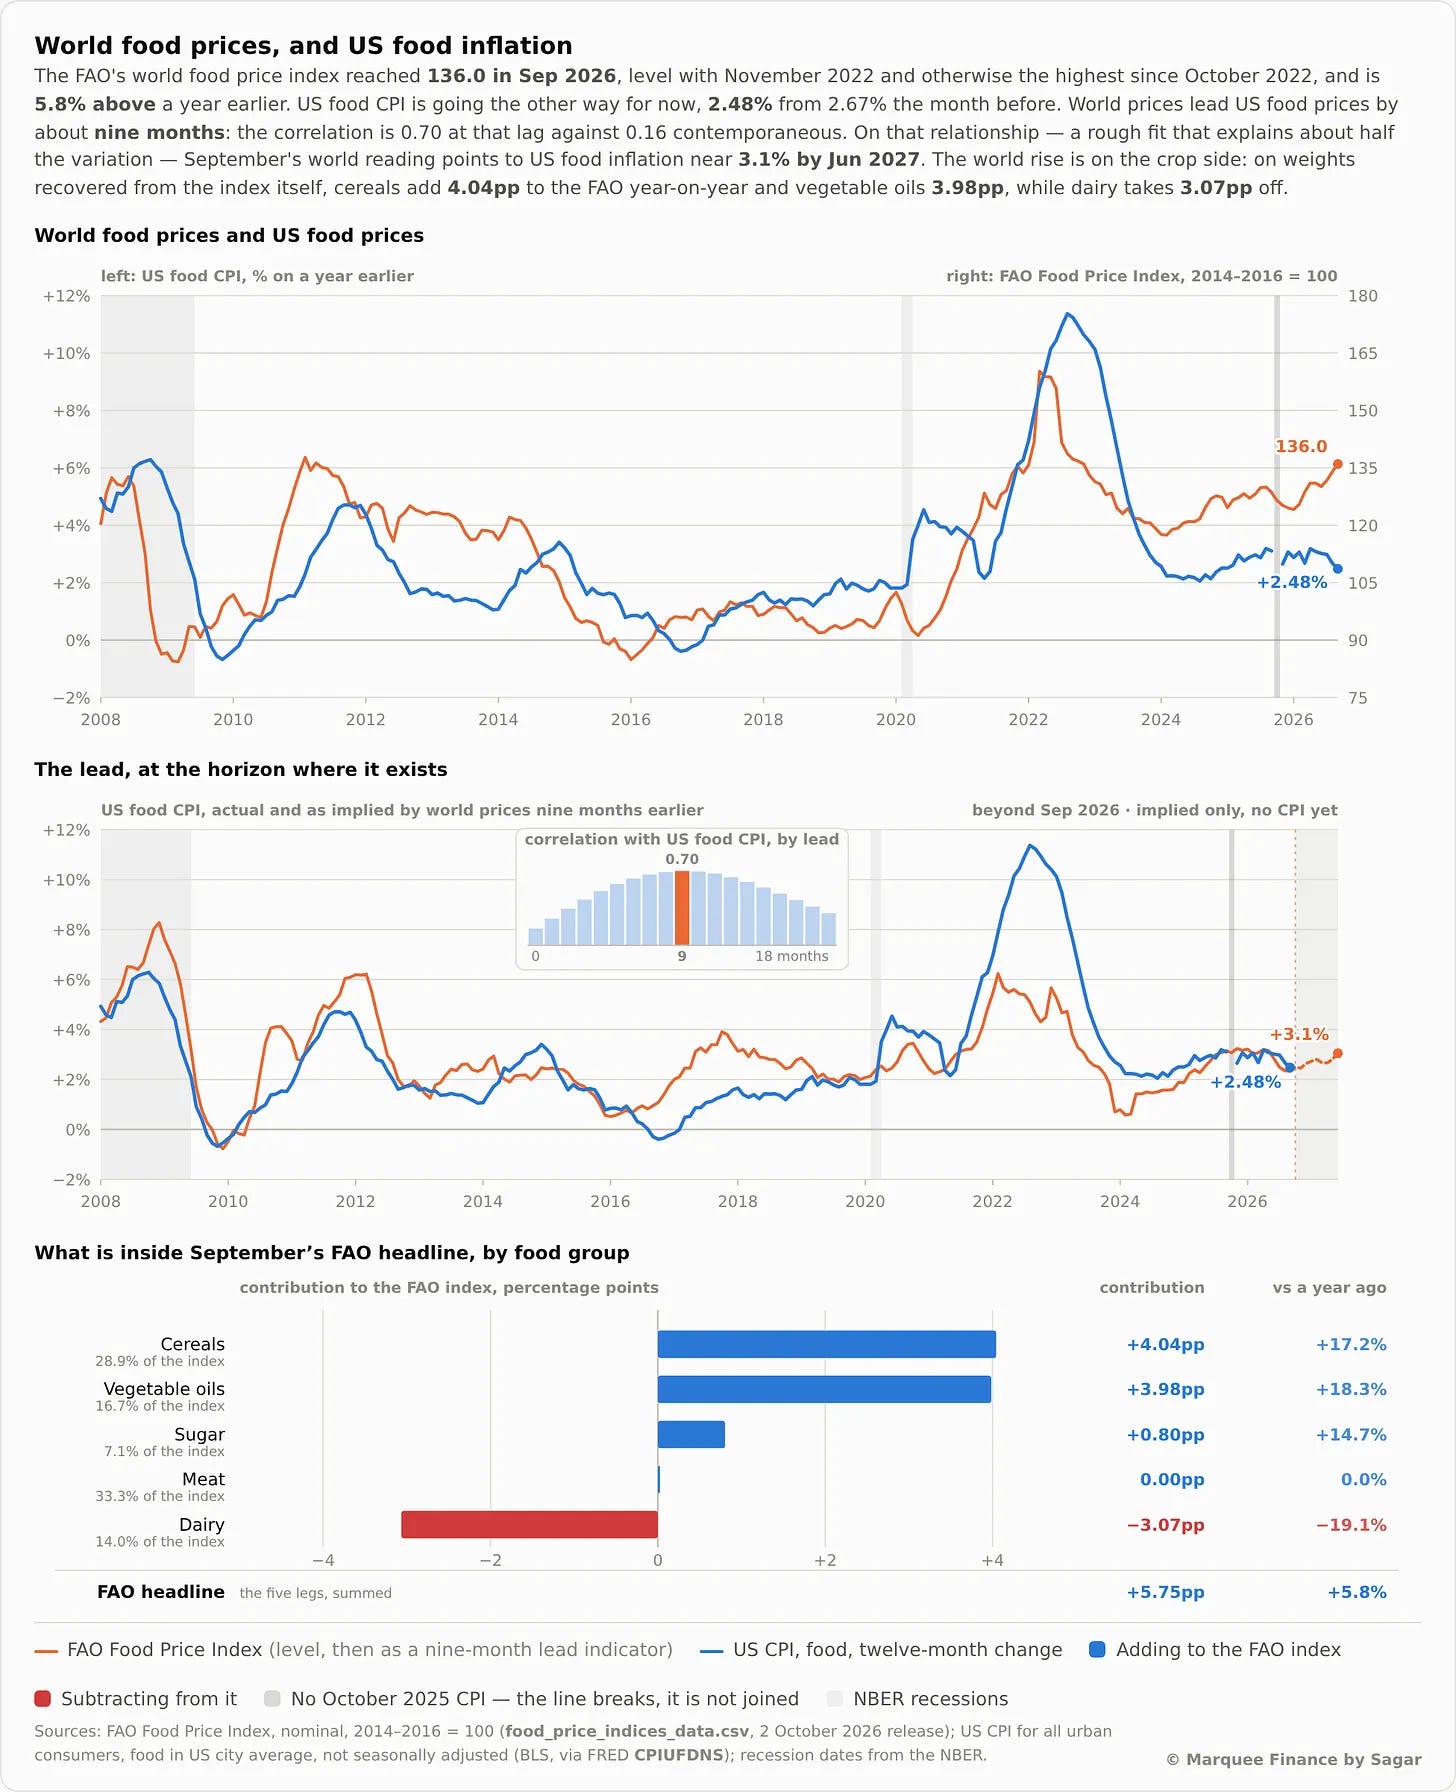
BONUS CHART: One of the biggest upside risks to the CPI remains food prices. We are seeing higher freight costs alongside a super El Niño.
The FAO World Food Price Index continues to rise, and we might see the effect in the US food CPI starting in Q2 next year.
Disclaimer
This publication and its author are not licensed investment professionals. The author & any other individuals associated with this newsletter are NOT registered as Securities broker-dealers or financial investment advisors with the U.S. Securities and Exchange Commission, Commodity Futures Trading Commission, or any other securities/regulatory authority. Nothing produced under Marquee Finance by Sagar should be construed as investment advice. Do your research and consult with your certified financial planner or other dedicated professional before making any investment decisions. Investments carry risk and may lose value; Marquee Finance By Sagar LLC, Marqueefinancebysagar.substack.com or Sagar Singh Setia is not responsible for loss of value; all investment decisions you make are yours alone.