

September is known as one of the worst months for equity markets; however, defying gravity, September yielded positive returns for most asset classes.
As the Fed surprised the markets with 50 bps markets and China embarked on an enormous stimulus, commodities ex-oil and Gold rejoiced with superior returns.
Let’s examine the cross-asset returns and decipher the macro via intriguing charts!
Let’s Go!
Surprisingly, Chinese equities are now the best-performing asset class YTD (ex-BTC), as the epic short squeeze led to a lightning rally in the last week of September.
Fiscal dominance, geopolitical tensions and the monetary easing cycle have been significant tailwinds for the shiny yellow metal, which is up a whopping 27% YTD and is the second-best performer.
The lower Dollar also led to a breakout in some of the EMs, and as a result, EEM is now outperforming EAFE and Europe.
Furthermore, bonds remain one of the biggest underperformers YTD, hurting the performance of the 60:40 PF.


When we look at the internals of the US markets, utilities and financials are the best-performing sectors YTD, a defensive tilt.
Ironically, as the world piled into Tech/ Mag 7 at the beginning of the year, the markets underwent a smart rotation after the 12th July fiasco when the carry trade reversal began.
Nonetheless, XLU is now becoming a crowded trade, and thus, readers who are long/overweight Utilities should be cautious.


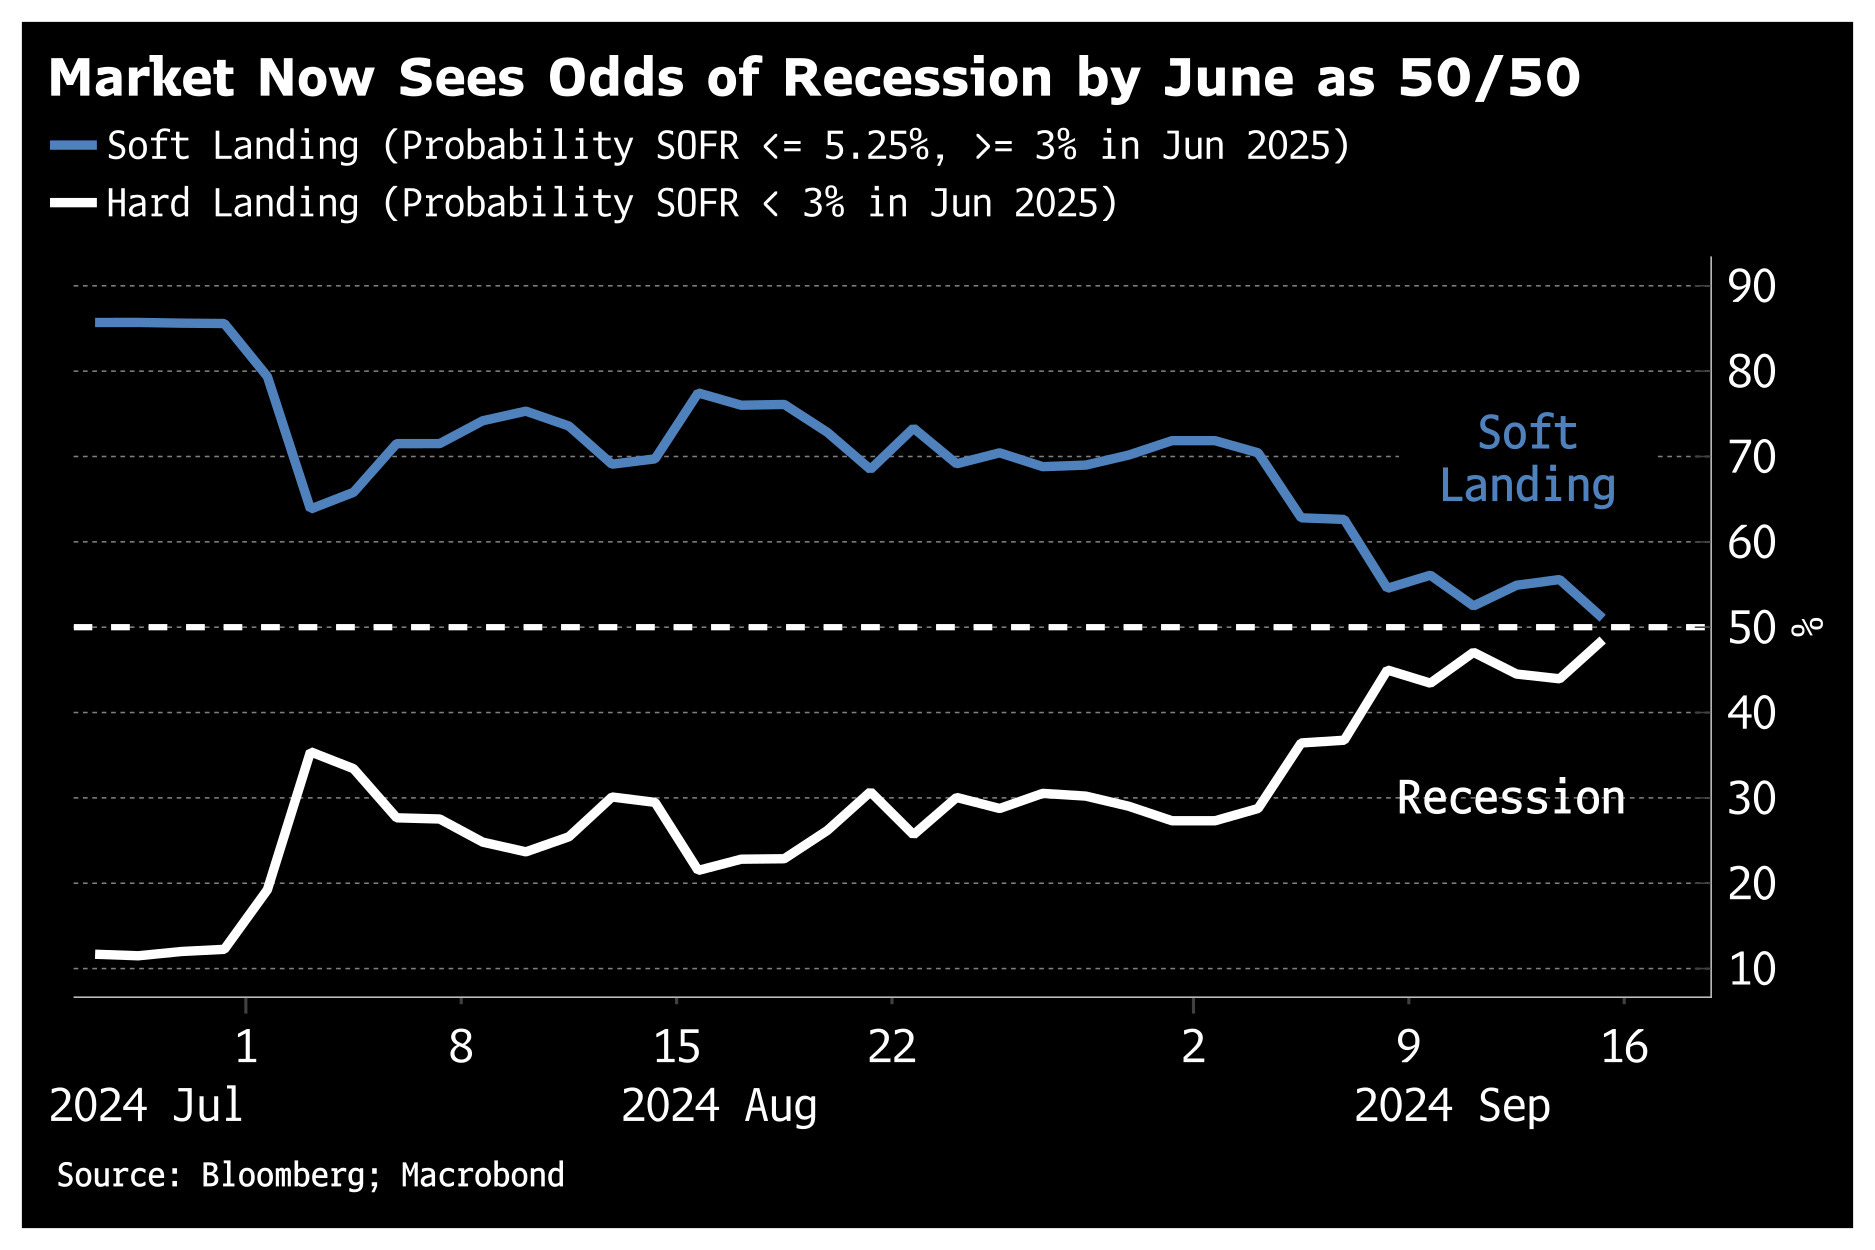
One of the reasons that market participants have gone overweight defensives was the increasing odds of a recession.
While a soft landing is still a consensus, one can’t rule out a hard landing. The stark downward revisions have been portraying a weakening economy beneath the surface.

Source: BBG, Macrobond
The US Yield curve has now steepened from one of the longest inversions ever.
If you believe in history, you can’t ignore the fact that a recession accompanies the steepening of the curve.
Nevertheless, this also signifies the normalization of the policy and the much-awaited return to the neutral rate.
The reason the world’s largest central bank cut rates was the likely weakening in the labour market (dual mandate: stable prices and maximum employment) as the Fed’s focus shifted from inflation to the labour market.
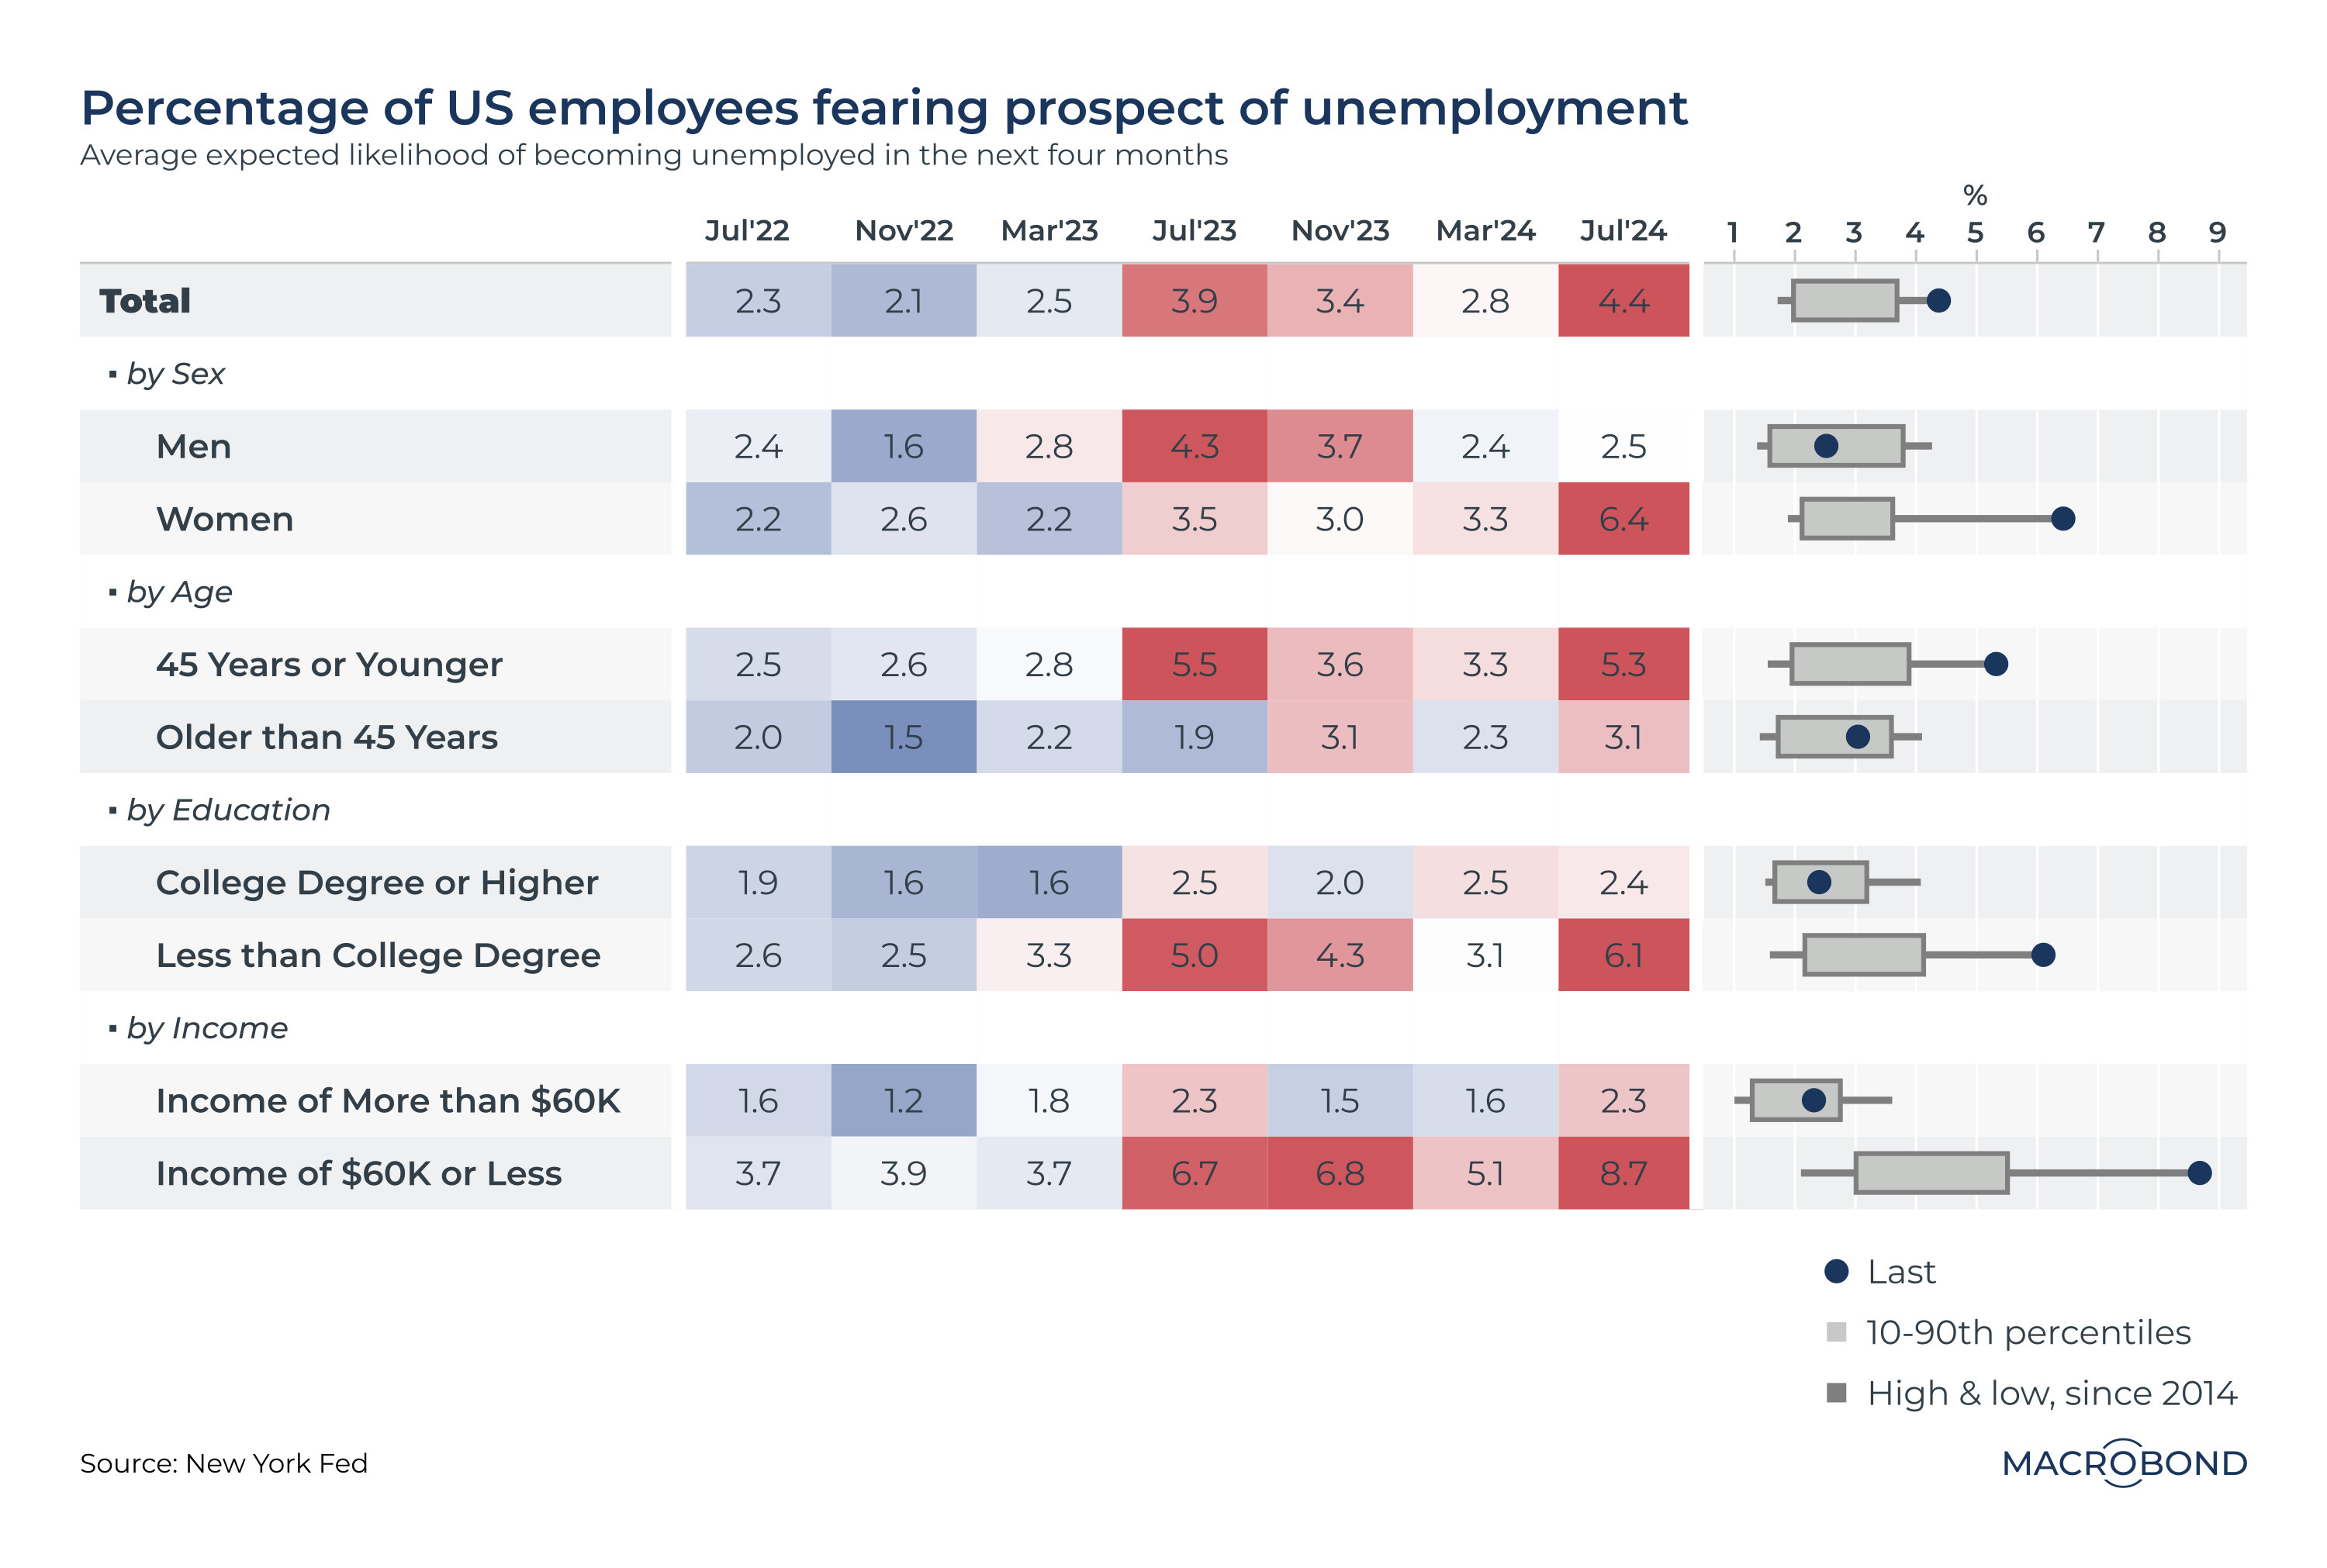
Furthermore, as quit rates plunge and hiring freezes, the % of US employees fearing the prospect of unemployment has risen dramatically.

Despite the weakness in the labour market, the BoE maintained a status quo. We presume this move was a potential policy mistake.
The biggest surprise was the sharp rise in the claimant count(consider this the UK’s claim data), which saw the highest increase since the 2008 GFC.
The Claimant Ratio (comparable to the US claims data) climbed further to 1.79 million, and the Vacancies/ Claimant ratio fell to 0.485, now the lowest since 2015 (ex-COVID era)


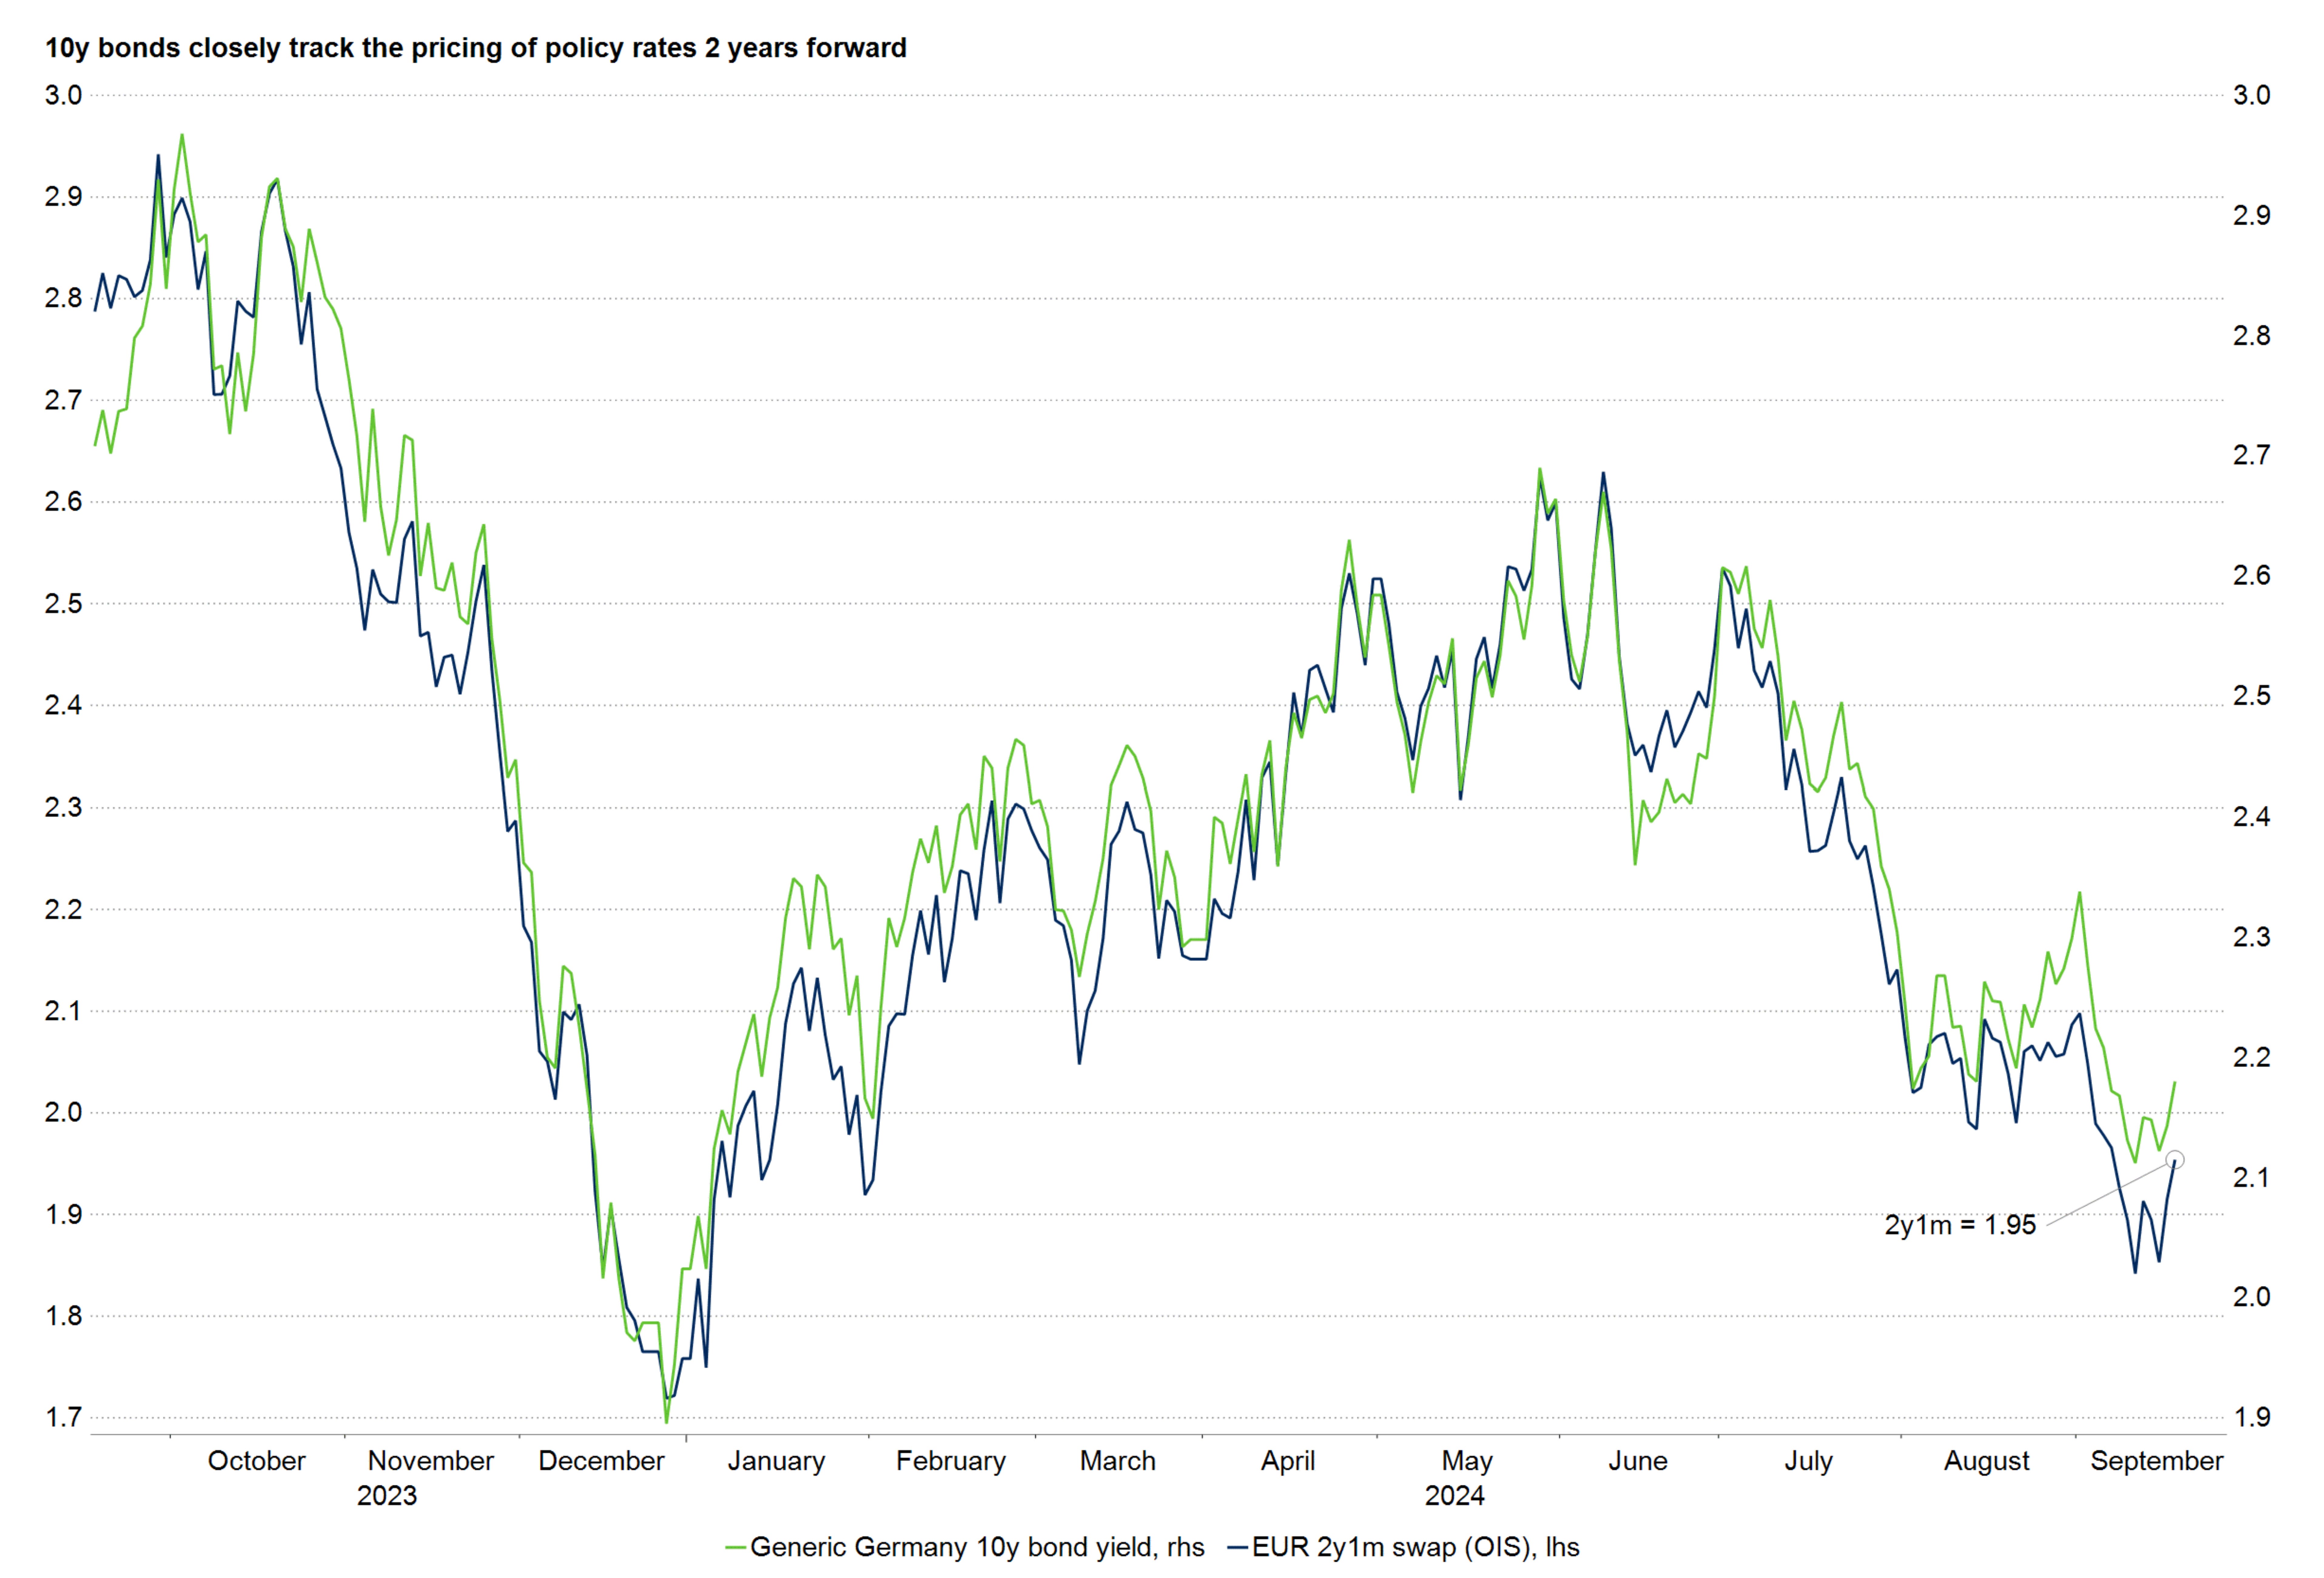
The recent inflation readings in Germany and Italy (below market expectations) and dovish talks by ECB officials confirm an October rate cut by the ECB.
Evidently, Europe’s cyclical economy failed to recover after the Russia-Ukraine war, as demand for China has remained fragile. Thus, we can expect a dovish ECB from here on.

One reason China implemented a string of stimulus measures was the deflationary loop the second-largest economy had entered due to the balance sheet recession after the property market debacle.
The persistent negative M1-M2 growth gap since H2 2018 suggests a prolonged corporate reluctance to invest. This monetary dynamic puts downward pressure on inflation, as depicted by its positive relationship ahead of the PPI.

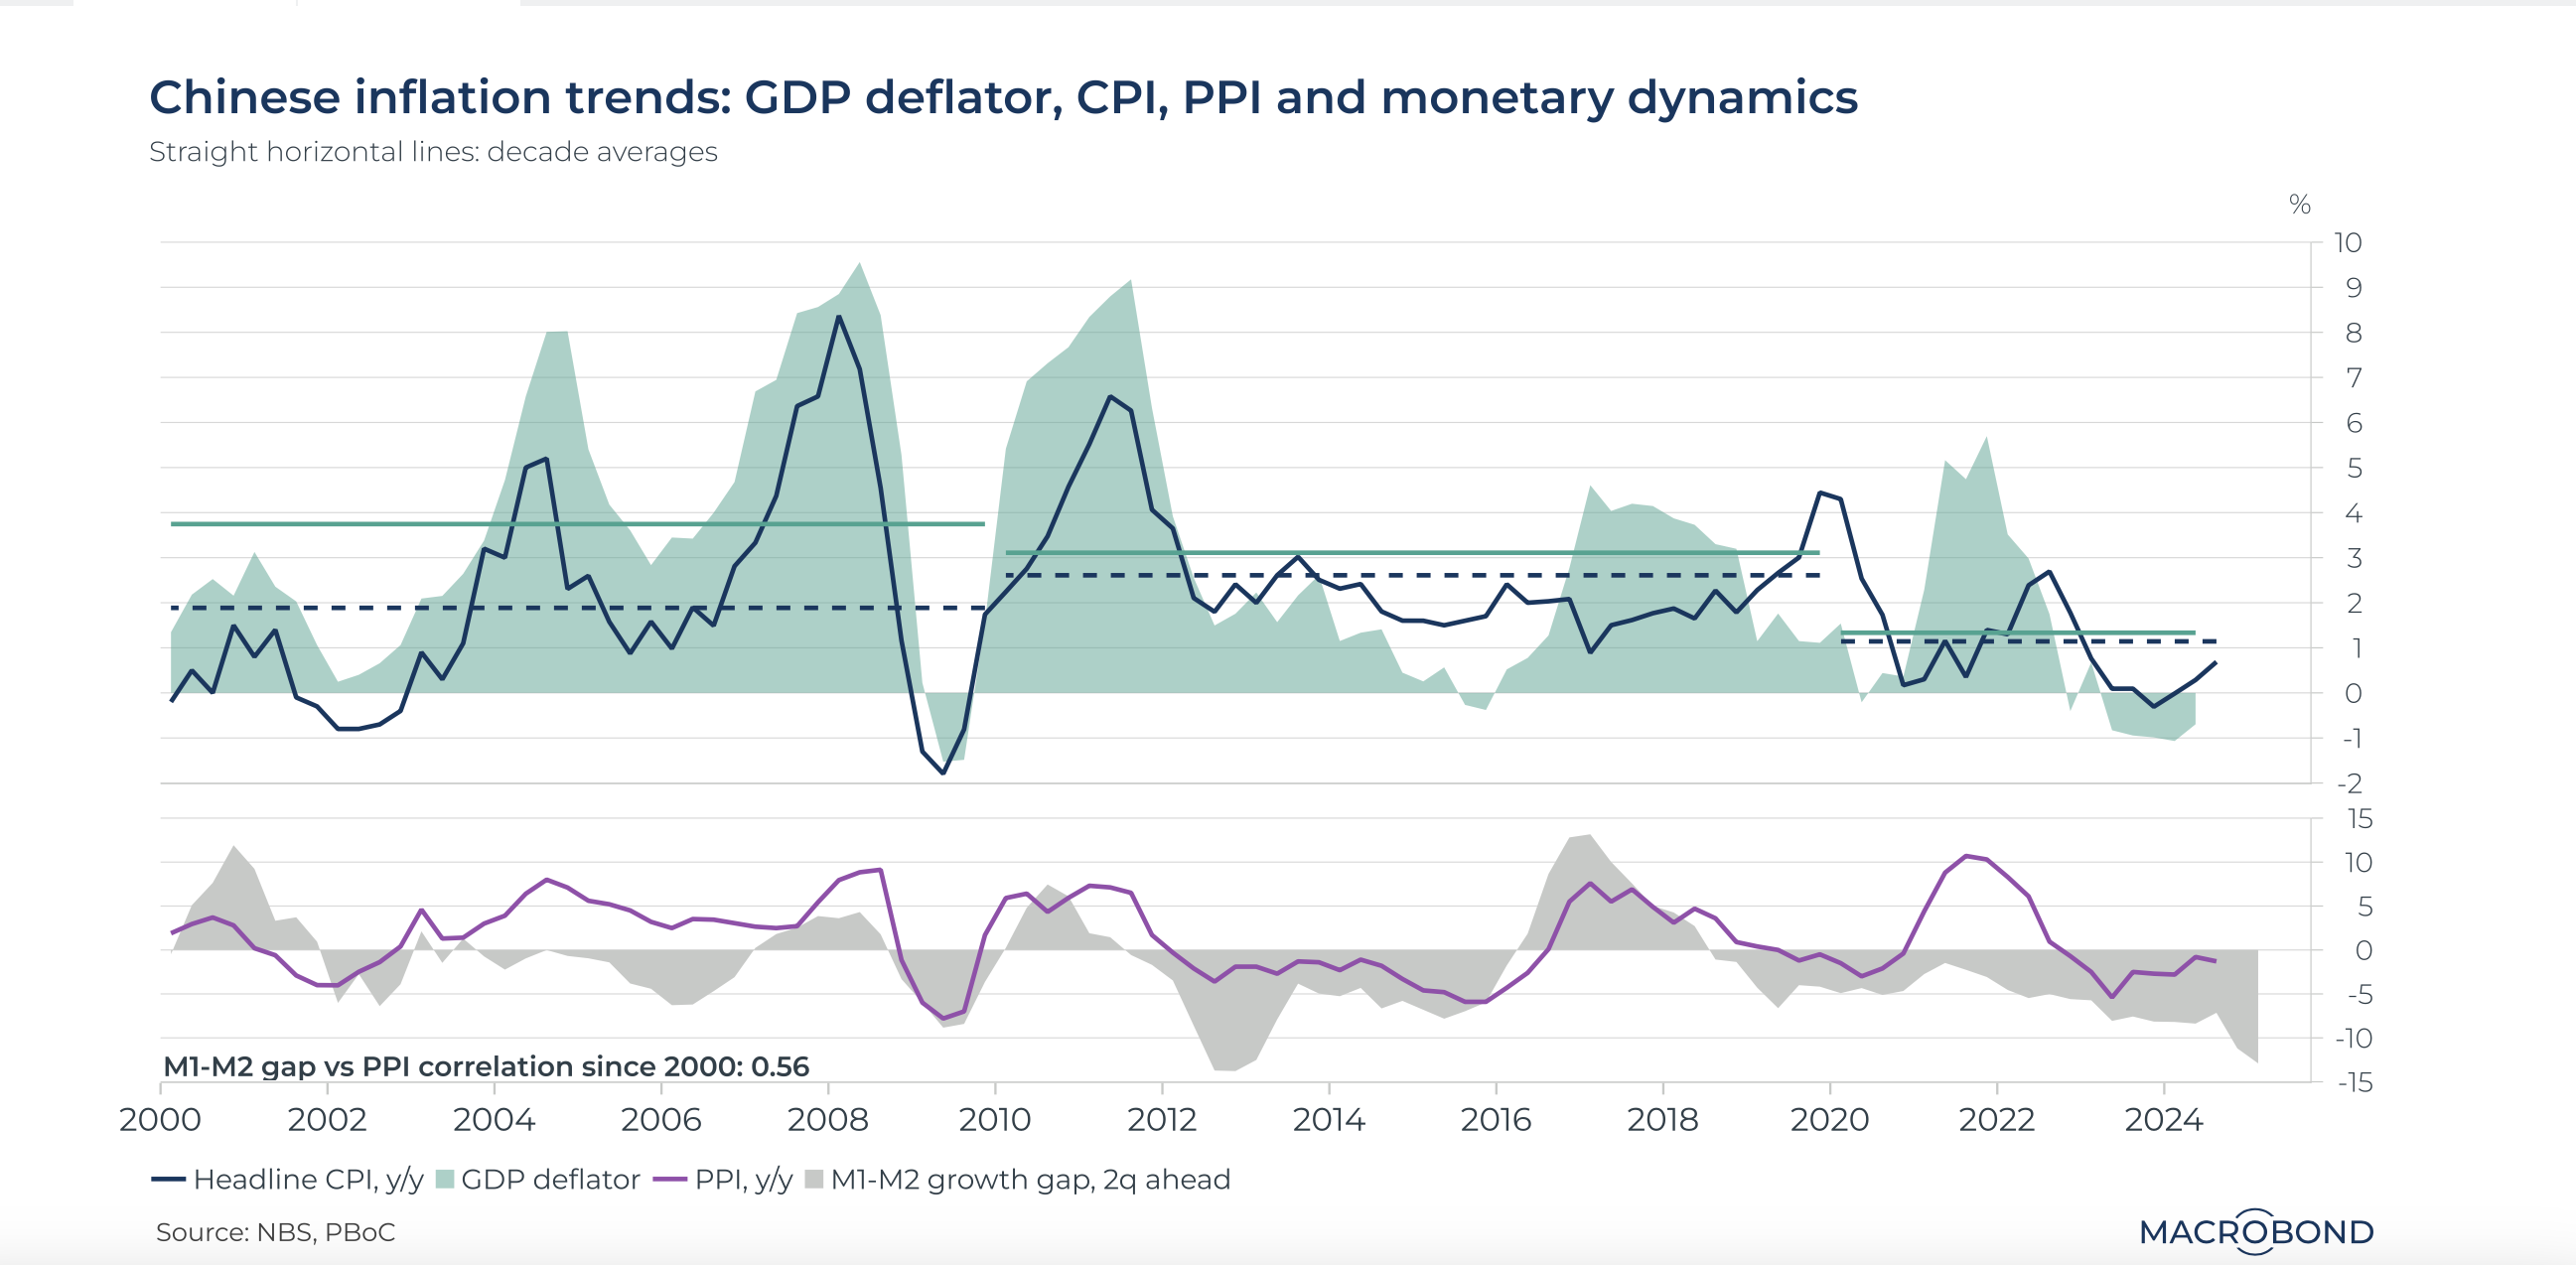
The deflationary spiral China is facing has led to a consistent fall in long-term bond yields as the market adjusts to a “new reality.”
As a result, Chinese bonds have given the best returns in the bond universe, with the 10Y CGB now trading at 2%. On the contrary, the land of the rising sun has seen JGBs trend higher!

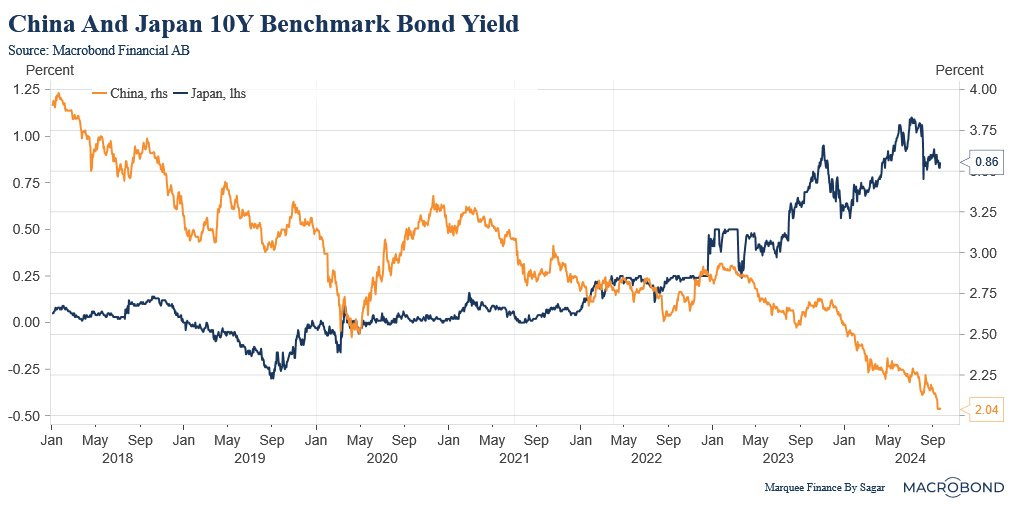
Buying government bonds began as an extreme measure to the GFC by the US Fed. As a result, the Fed held the largest share of government debt outstanding, but that flipped in July 2014 when the BOJ under Abenomics went on a mad buying spree of the JGBs.
The result of the NIRP and QQE has been astounding. Since peaking in 2011, the JPY has depreciated over 50% vs. the USD. In gold terms, the value of the JPY is down 68% over the same period.


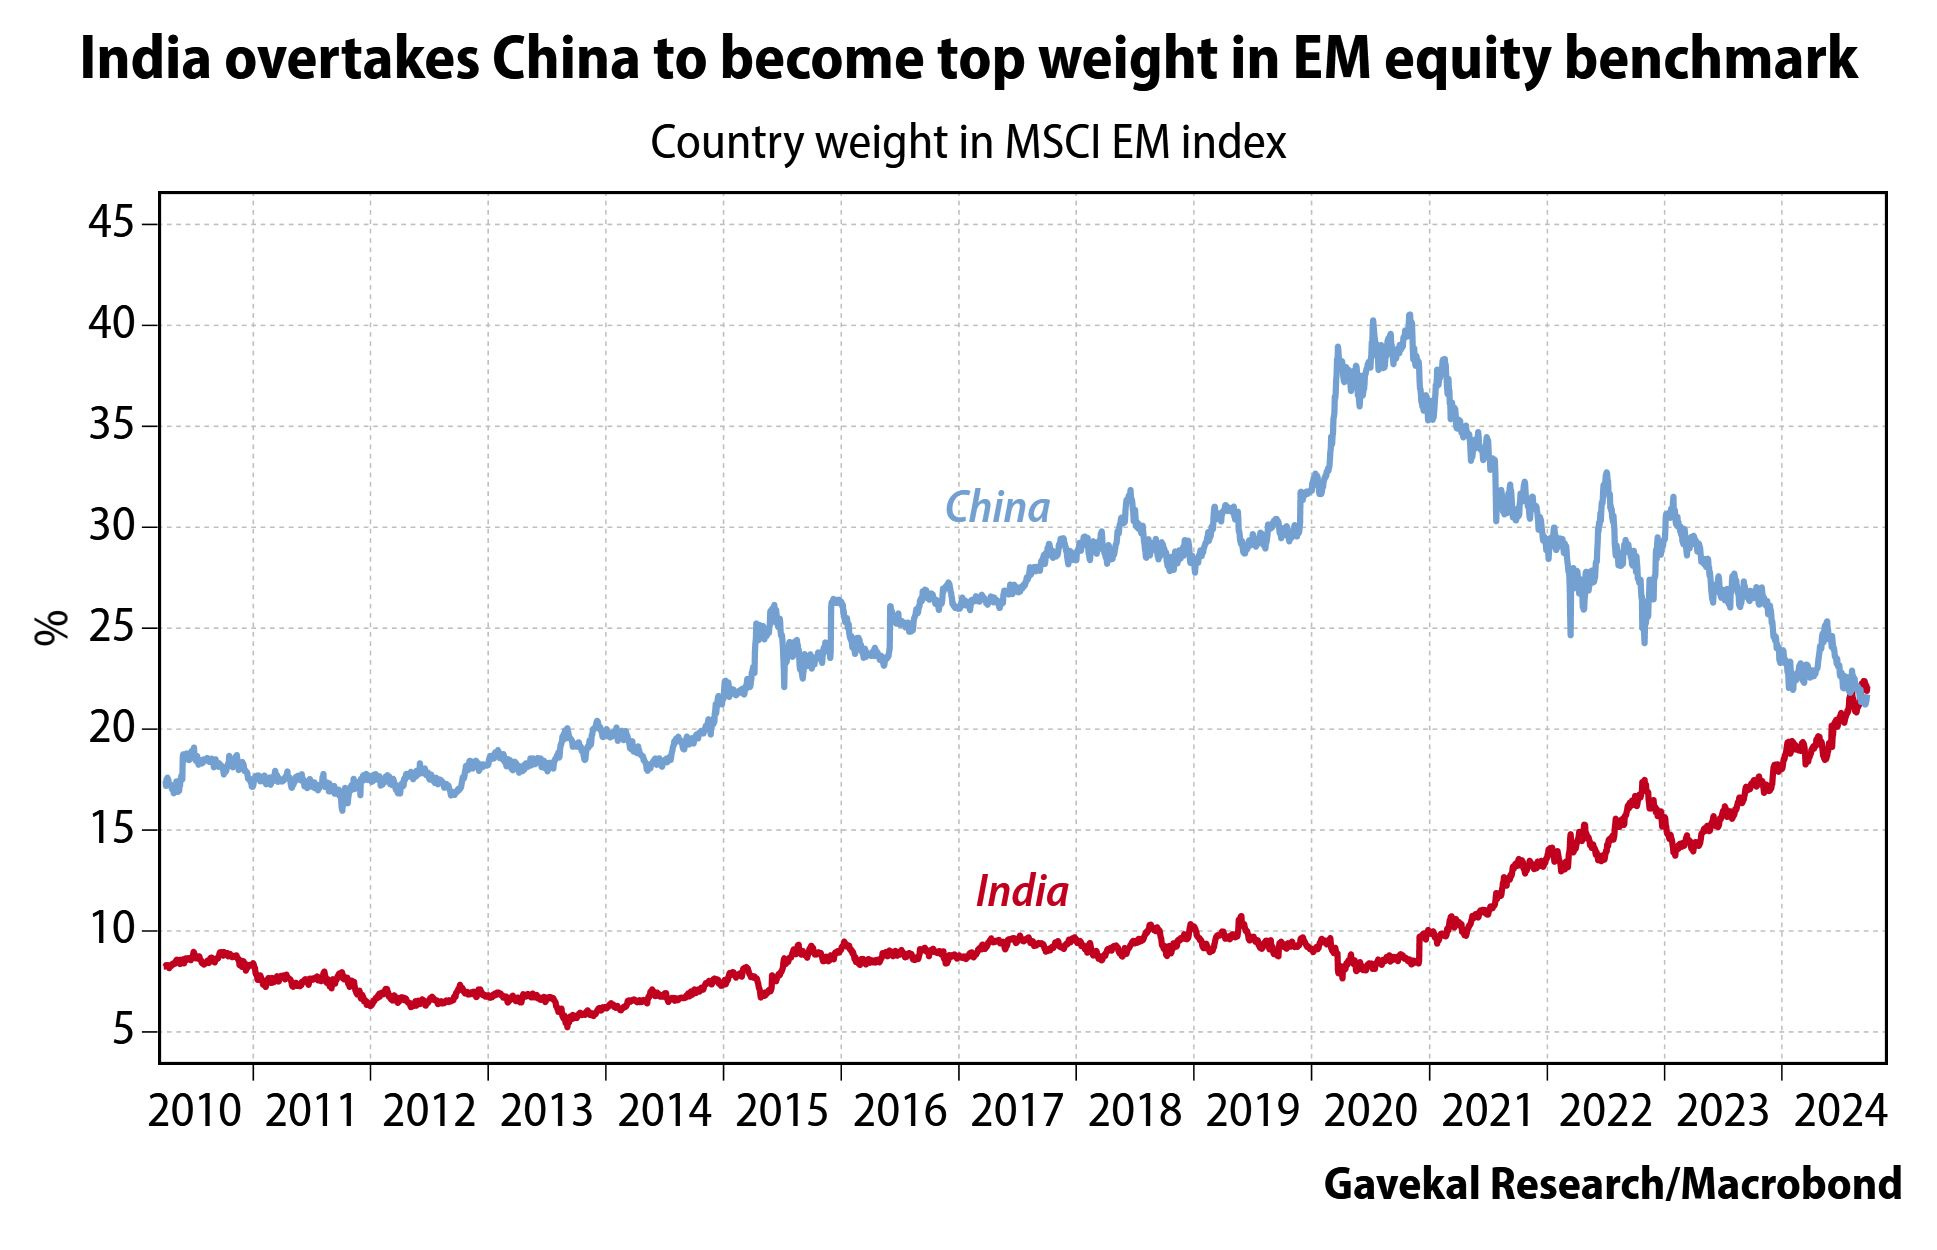
In what could be termed as unbelievable, the weight of Indian equity markets earlier this month surpassed China in the MSCI EM Index.
However, this might change after the monstrous 25% rally in the Chinese markets.

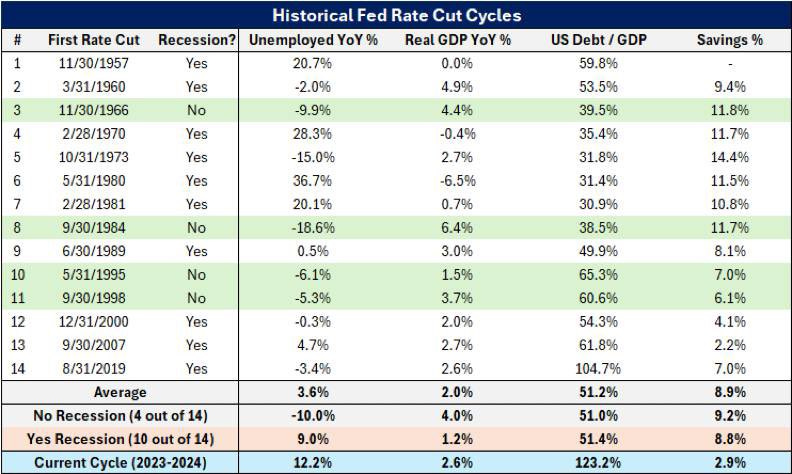
BONUS CHART: Make your own conclusions!!

Disclaimer
This publication and its author is not a licensed investment professional. The author & any other individuals associated with this newsletter are NOT registered as Securities broker-dealers or financial investment advisors with the U.S. Securities and Exchange Commission, Commodity Futures Trading Commission, or any other securities/regulatory authority. Nothing produced under Marquee Finance by Sagar should be construed as investment advice. Do your research and contact your certified financial planner or other dedicated professional before making investment decisions. Investments carry risk and may lose value; Marquee Finance By Sagar LLC, Marqueefinancebysagar.substack.com or Sagar Singh Setia is not responsible for loss of value; all investment decisions you make are yours alone.