

2026 has been one of the toughest years for investors and traders, as global financial markets have tested patience, long-term correlations have broken down, and governments have intervened in financial markets to protect hegemony.
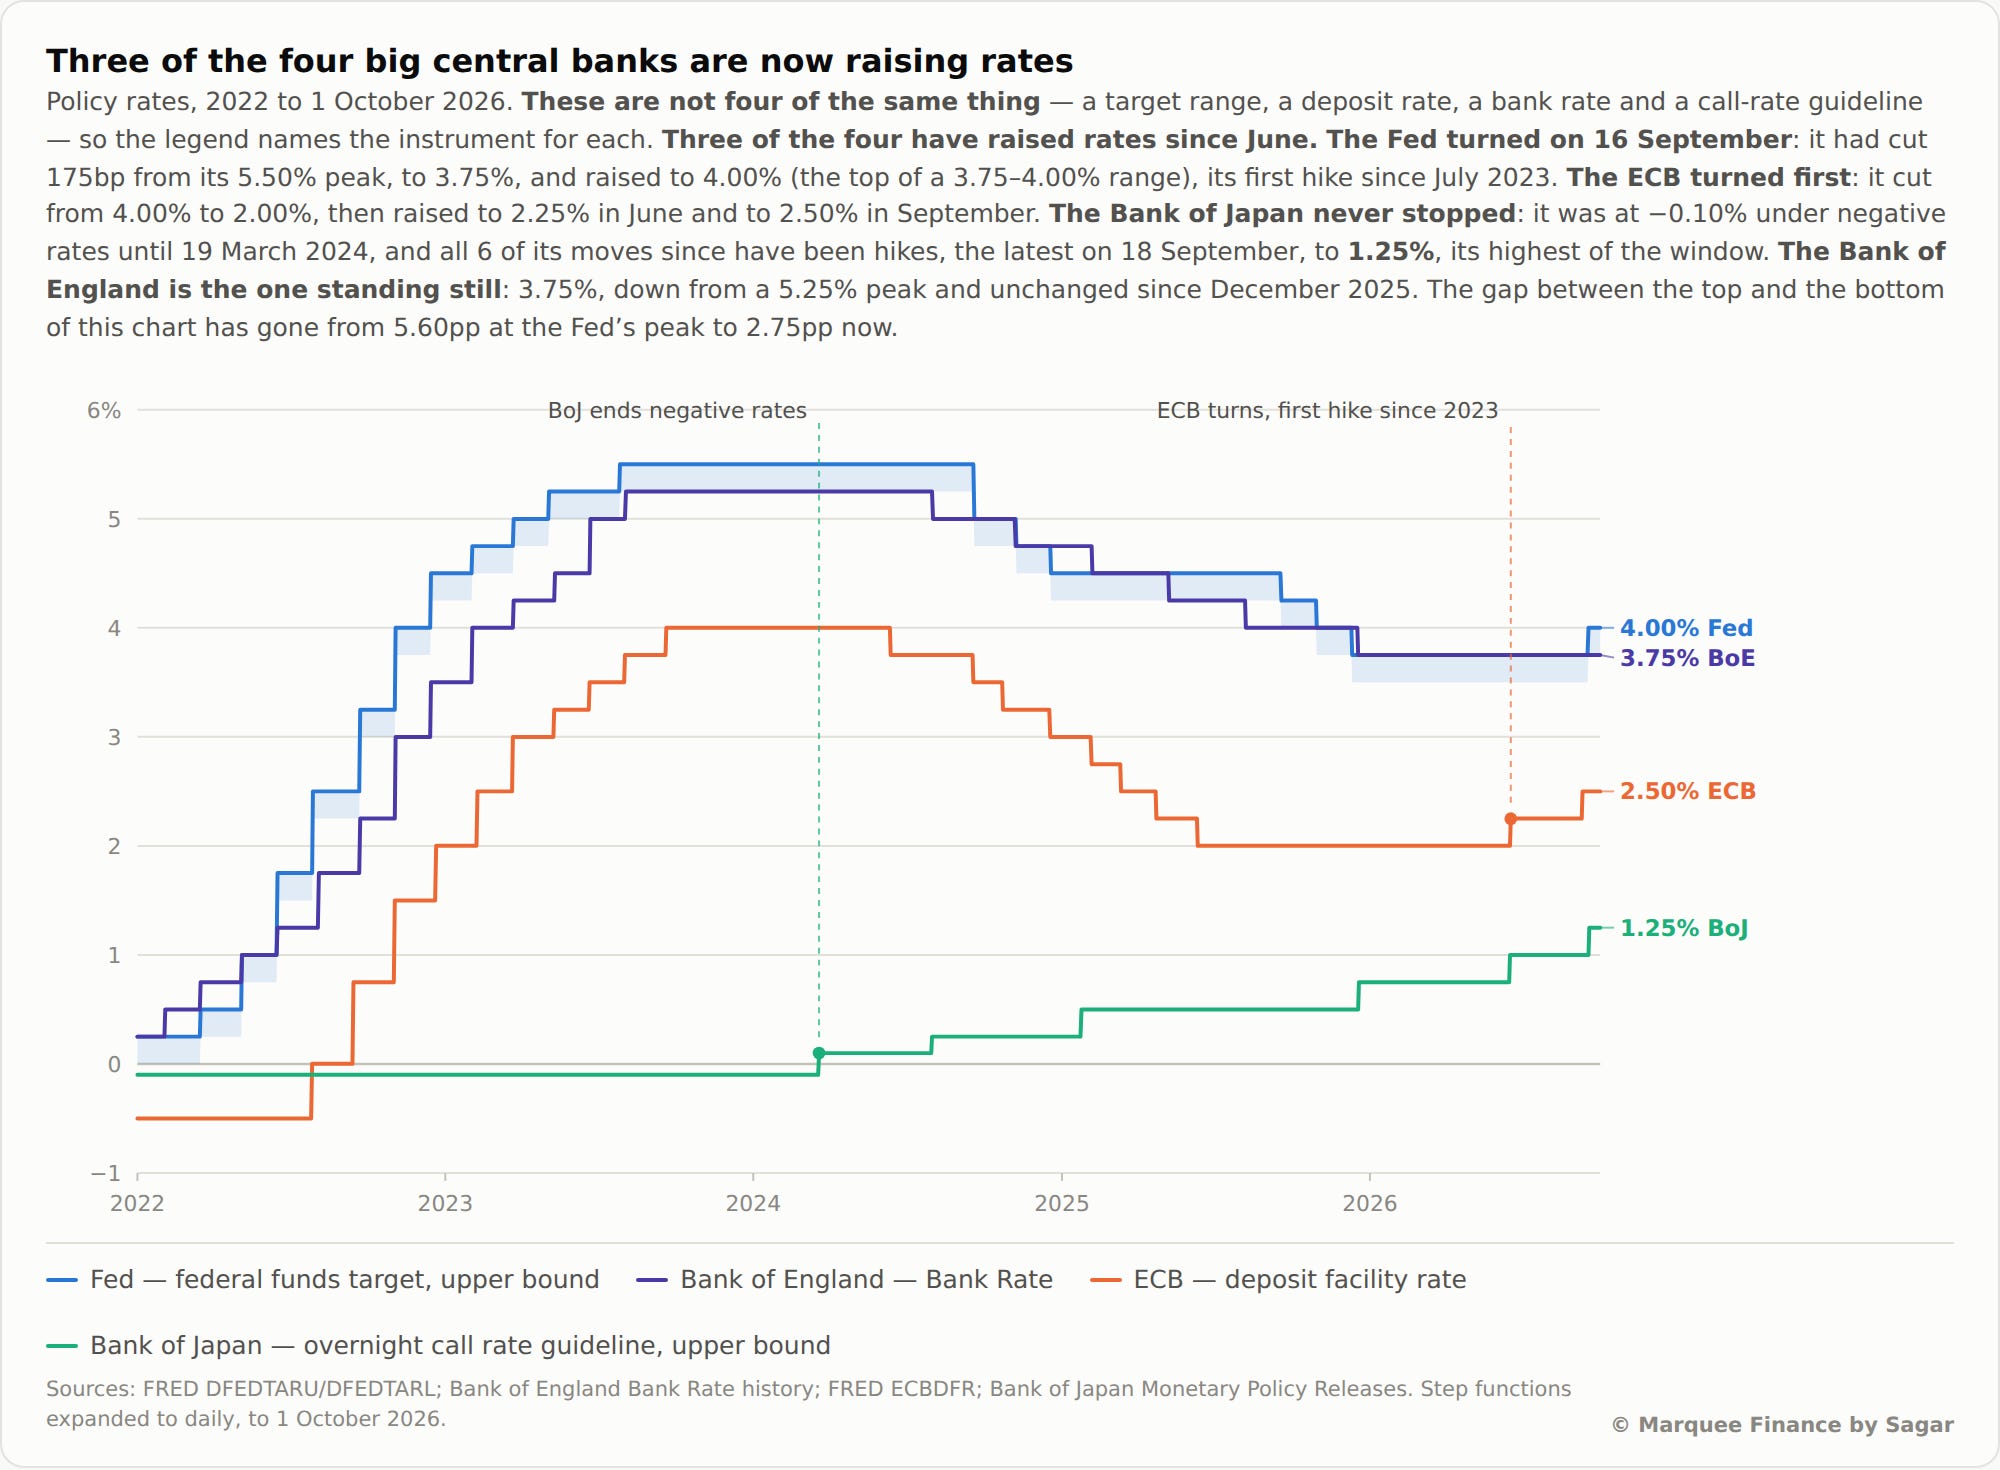
September saw a new global monetary tightening cycle as the Fed, ECB and the BoJ raised rates by 25 bps.
Let’s examine 14 charts to analyse global macro and financial market internals!
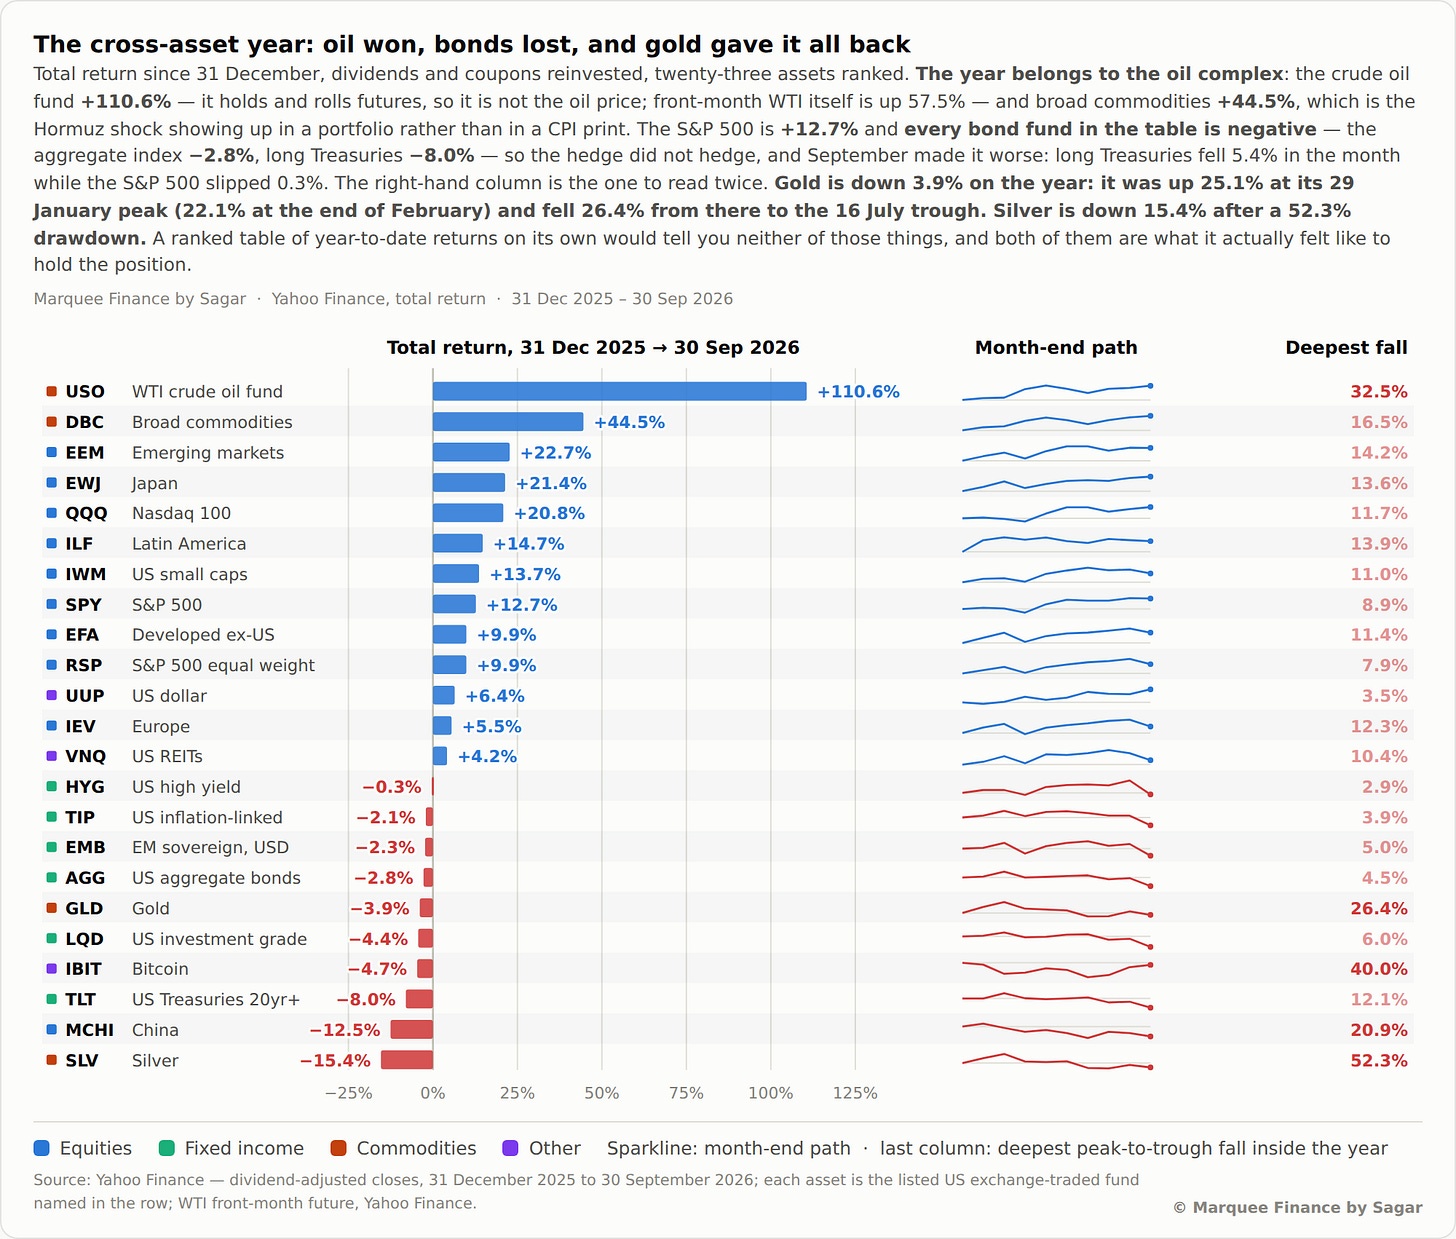
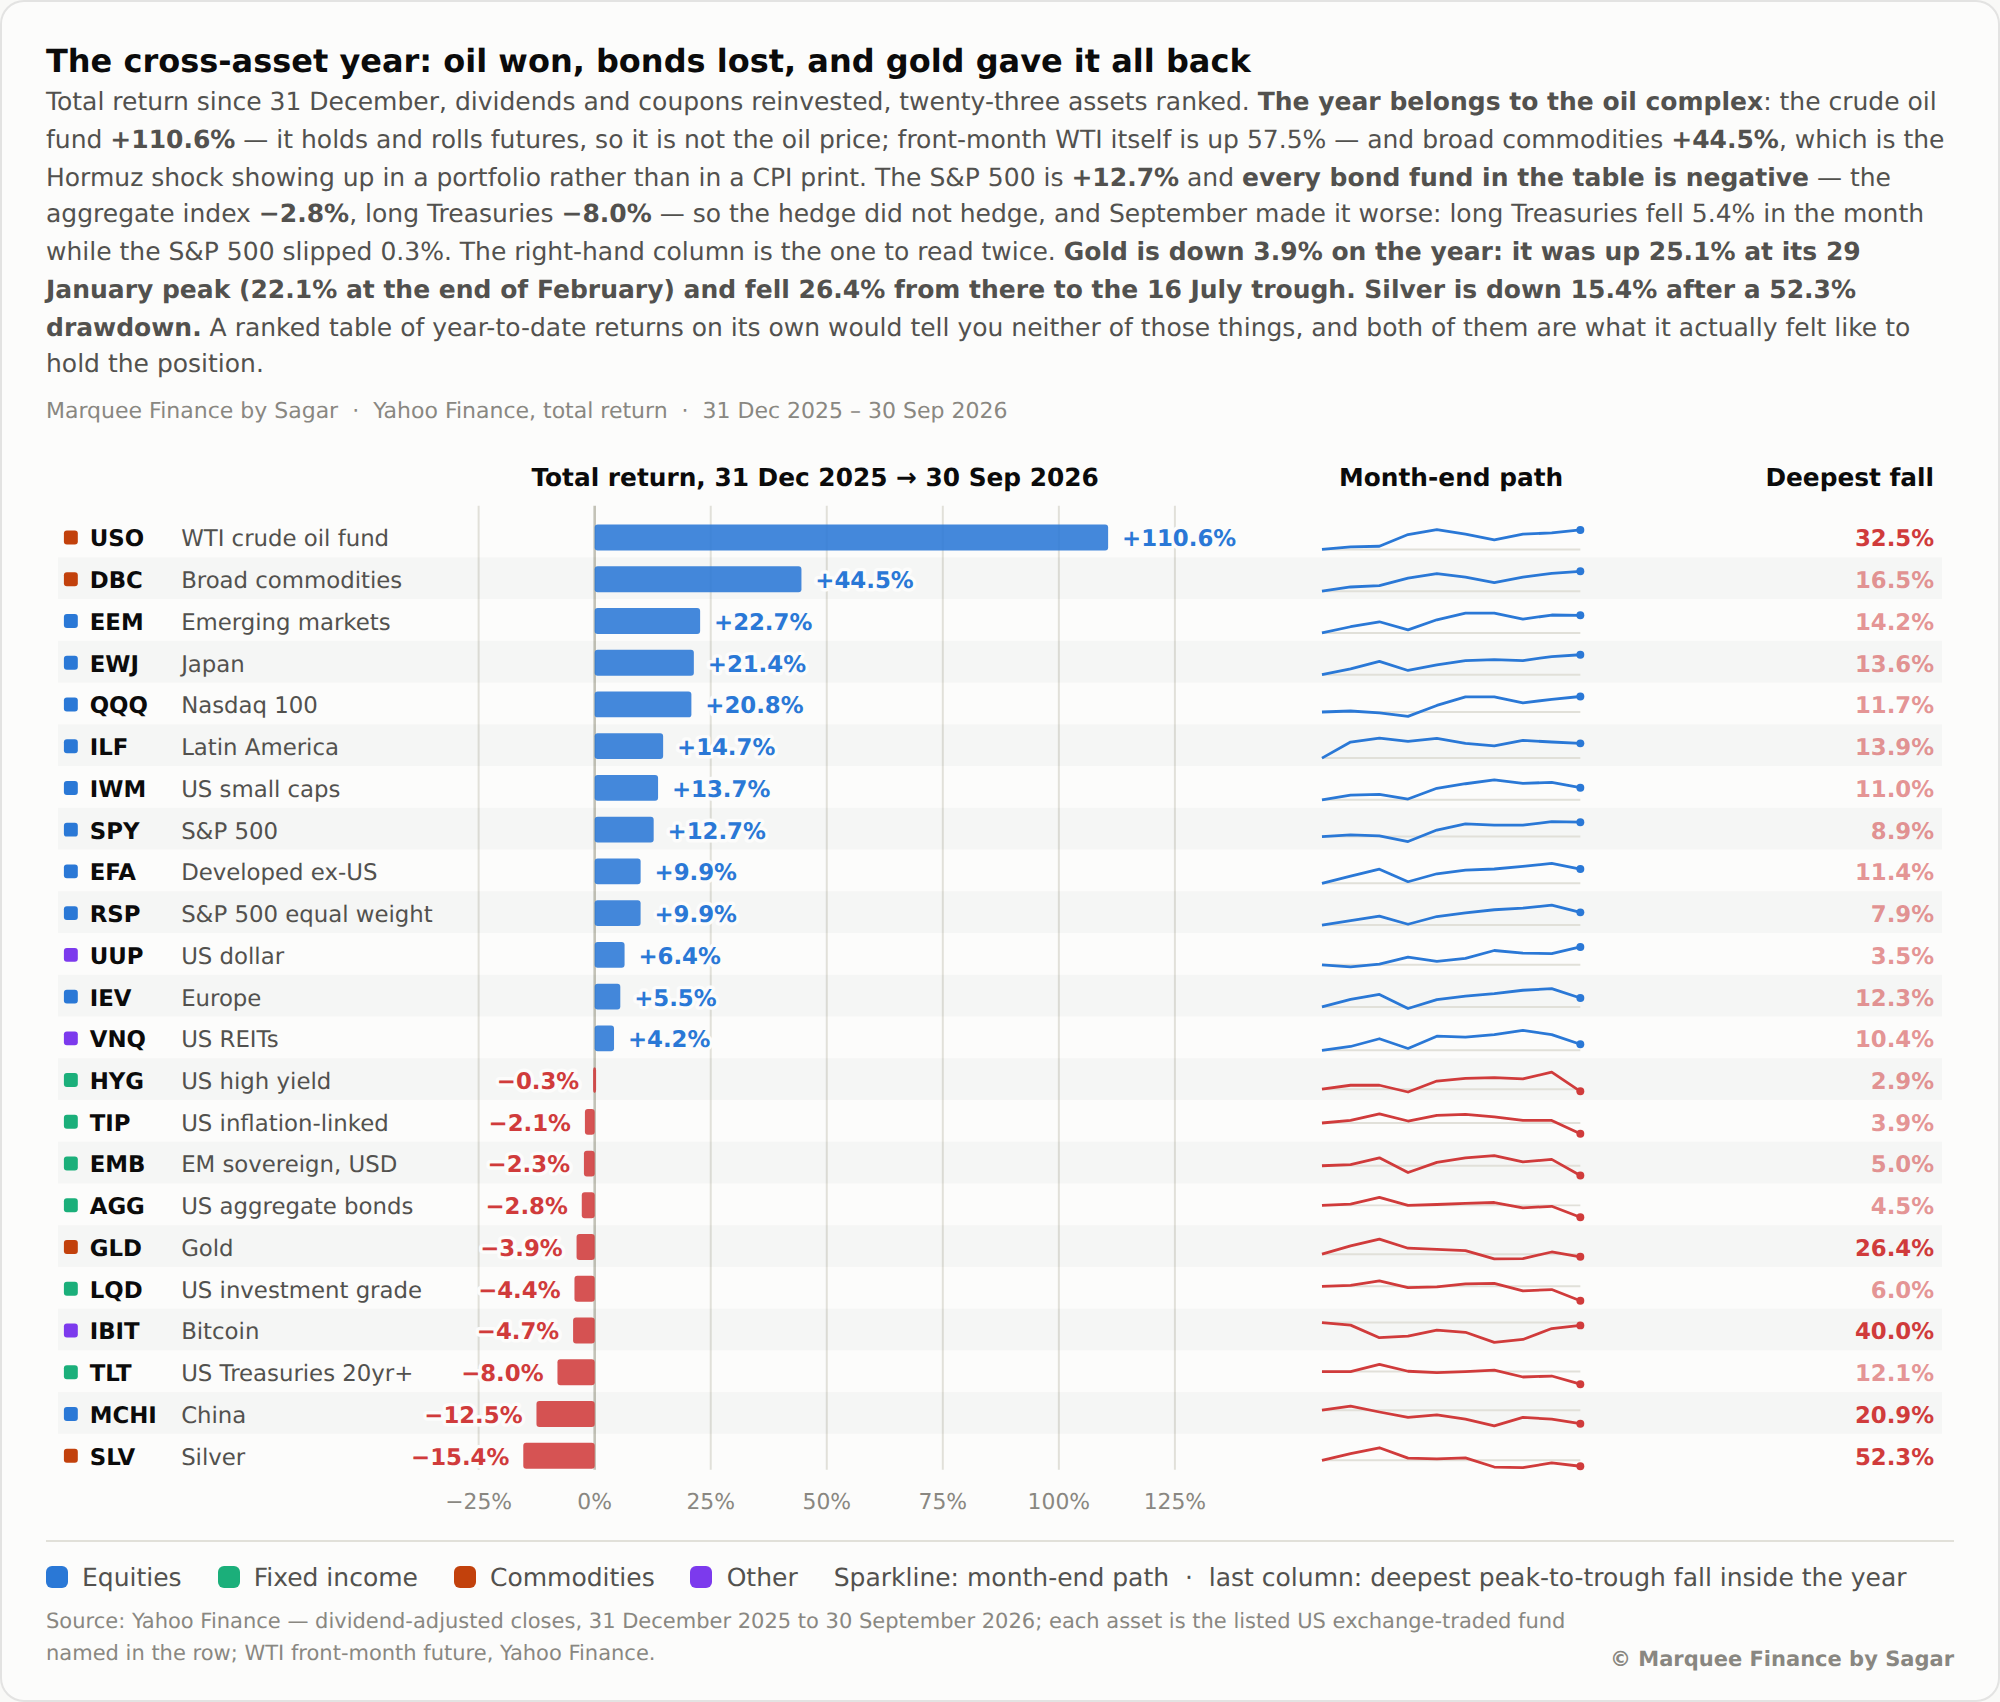
2026 is shaping up to be a year for select commodities.
Oil has been the top performer (USO), while DBC is up more than 45% YTD.
Led by two Korean stocks, the flagship EEM ETF is up 23%, while the AI trade in Japan led a 21% rise for EWJ.
Overall, the AI rally in 2026 has been concentrated in the semis (wealth transfer from hyperscalers to the semis), which have been the top performers.
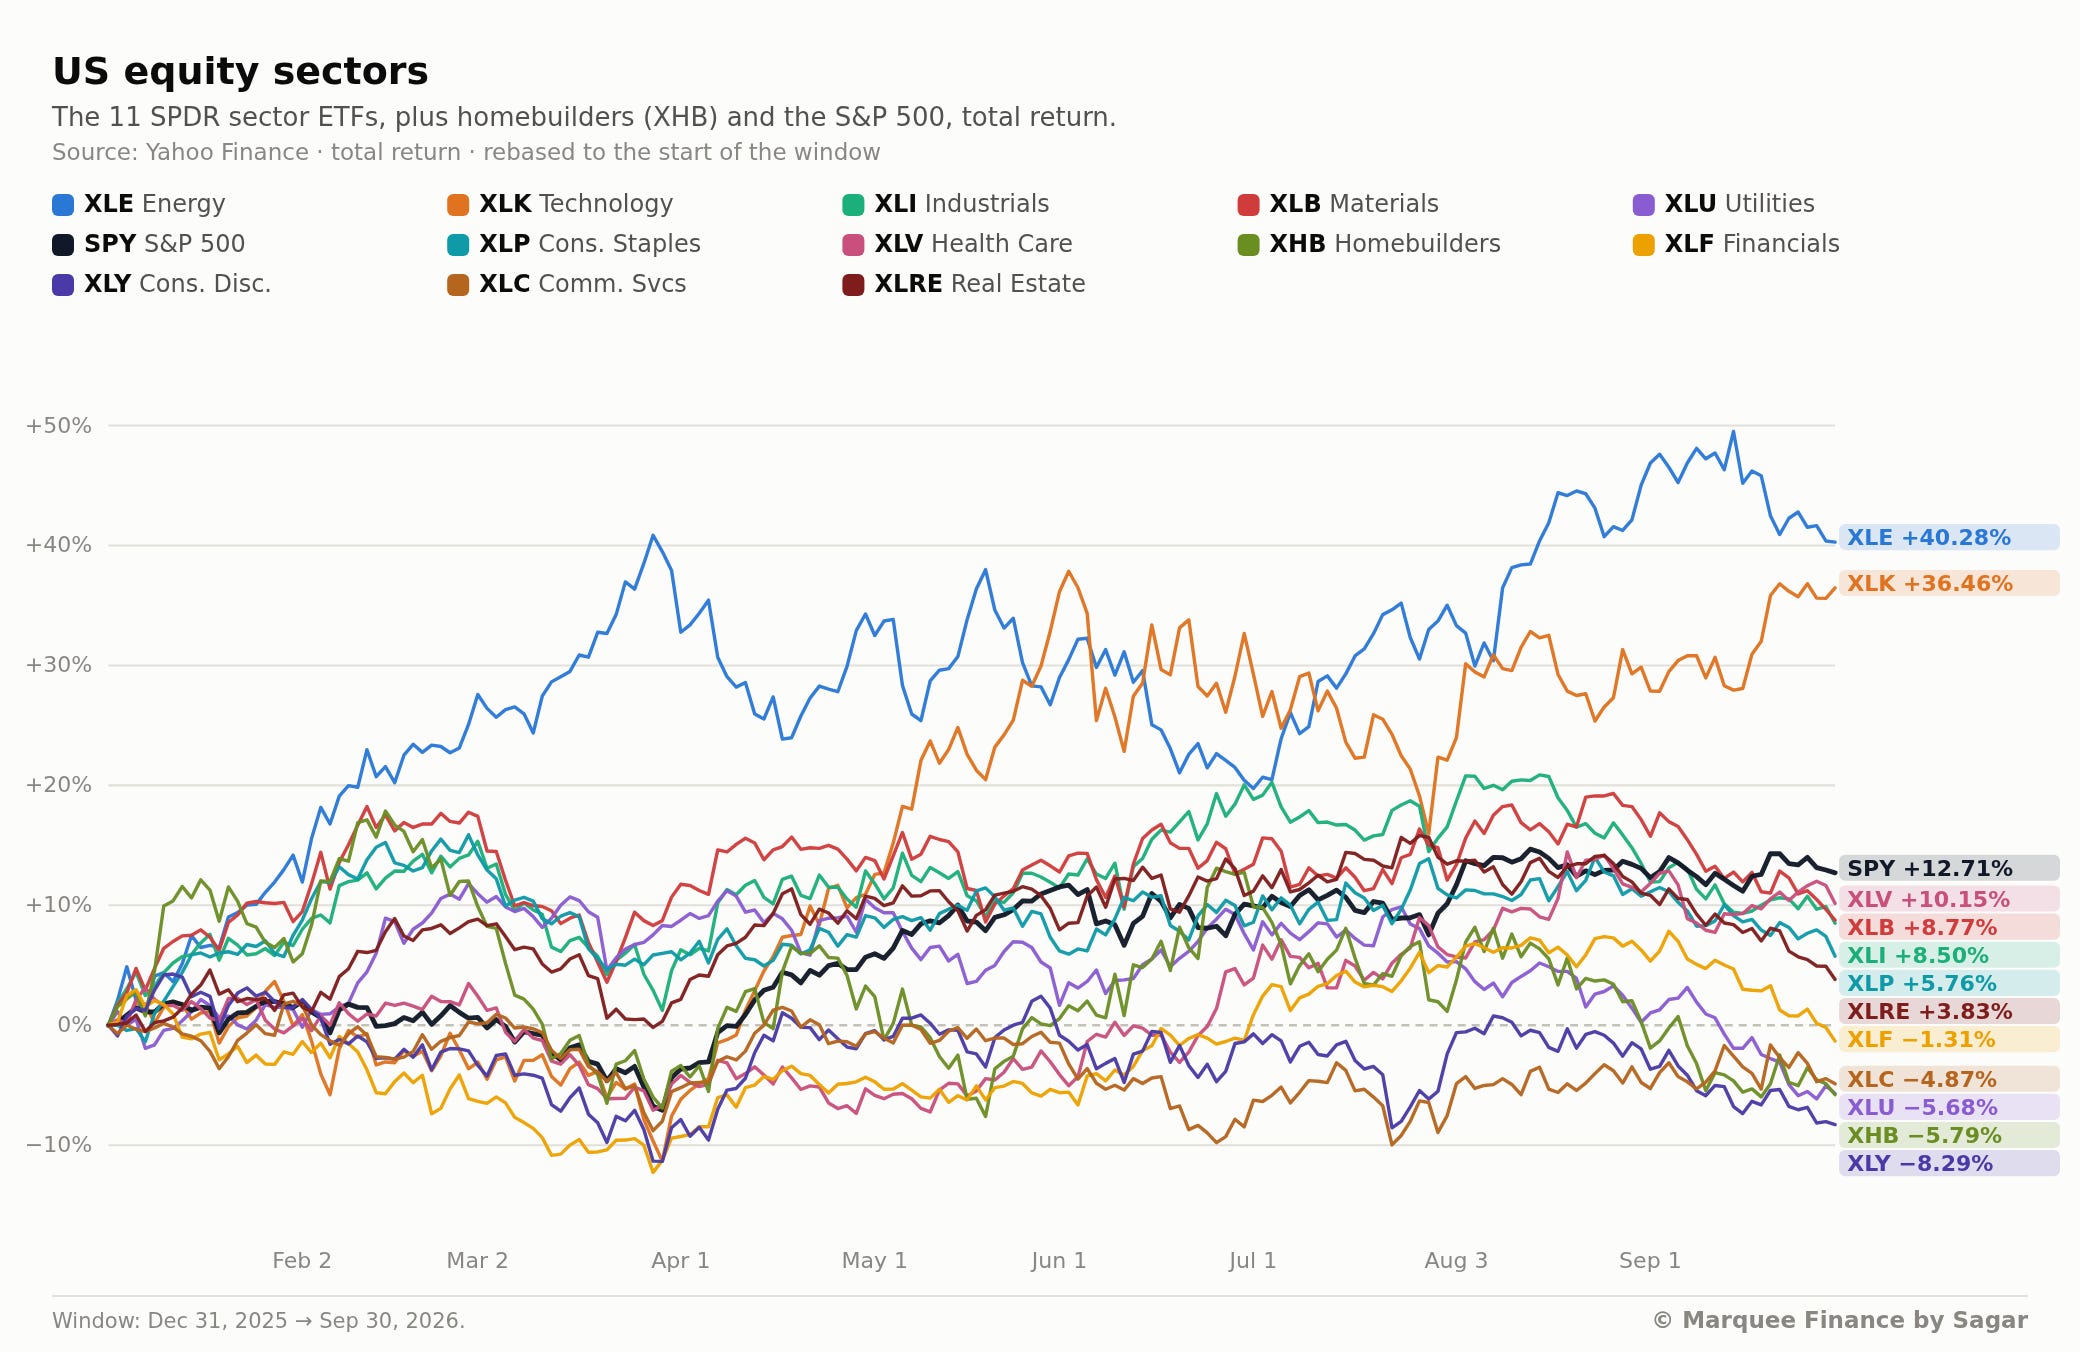
Despite significantly higher rates, small caps have outperformed SPX.
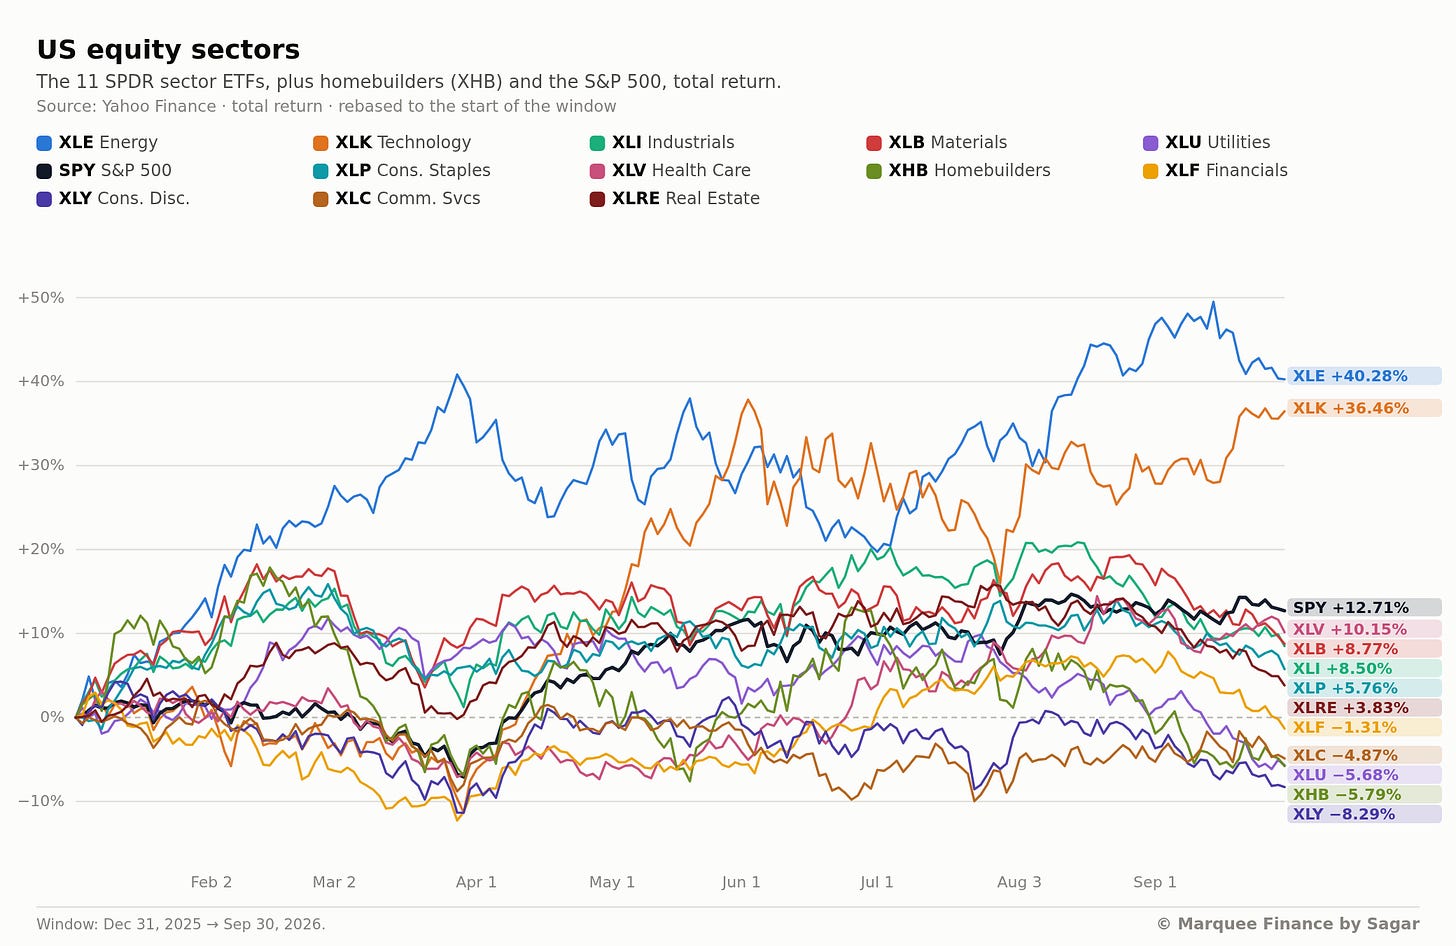
Out of the 12 sectorial ETFs in the chart, only two ETF’s: XLE and XLK were able to outperform SPY YTD.
Note that even in XLK, a handful of names (mostly semis) drove the outperformance; as a result, the rally has been concentrated in only a few names.
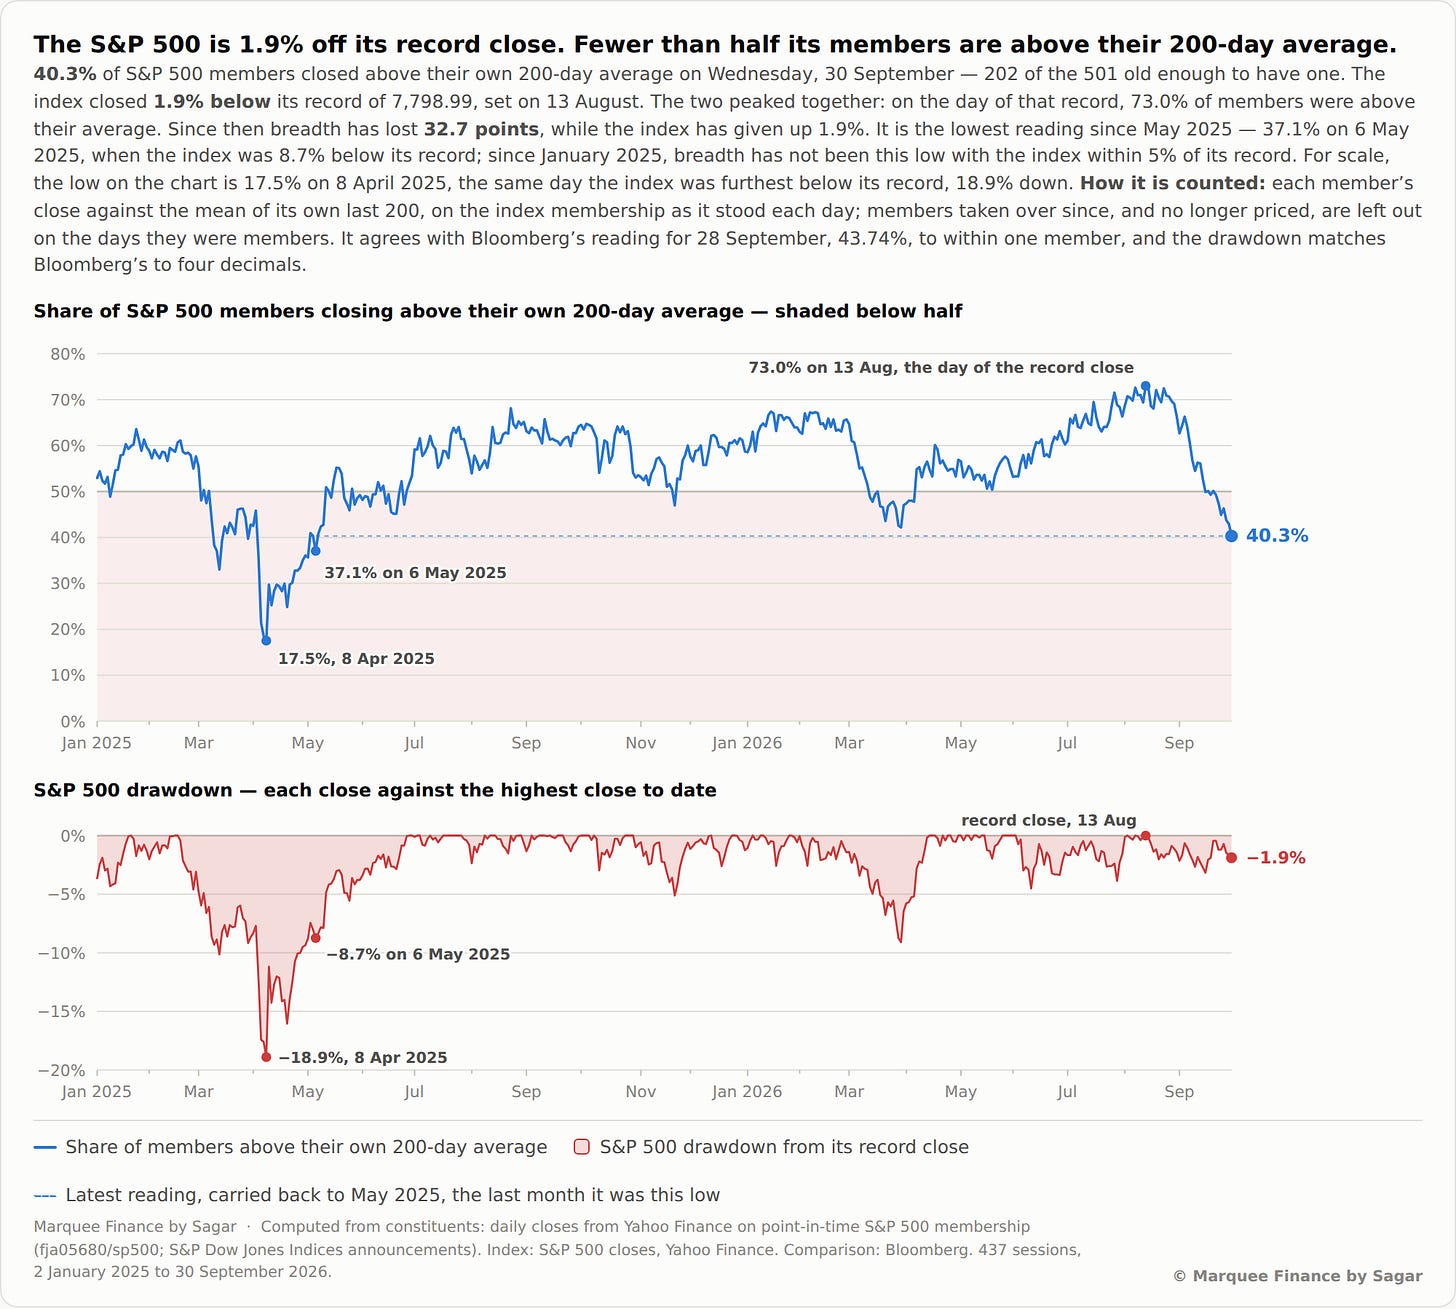
When we analyse the market internals, a shocking picture emerges.
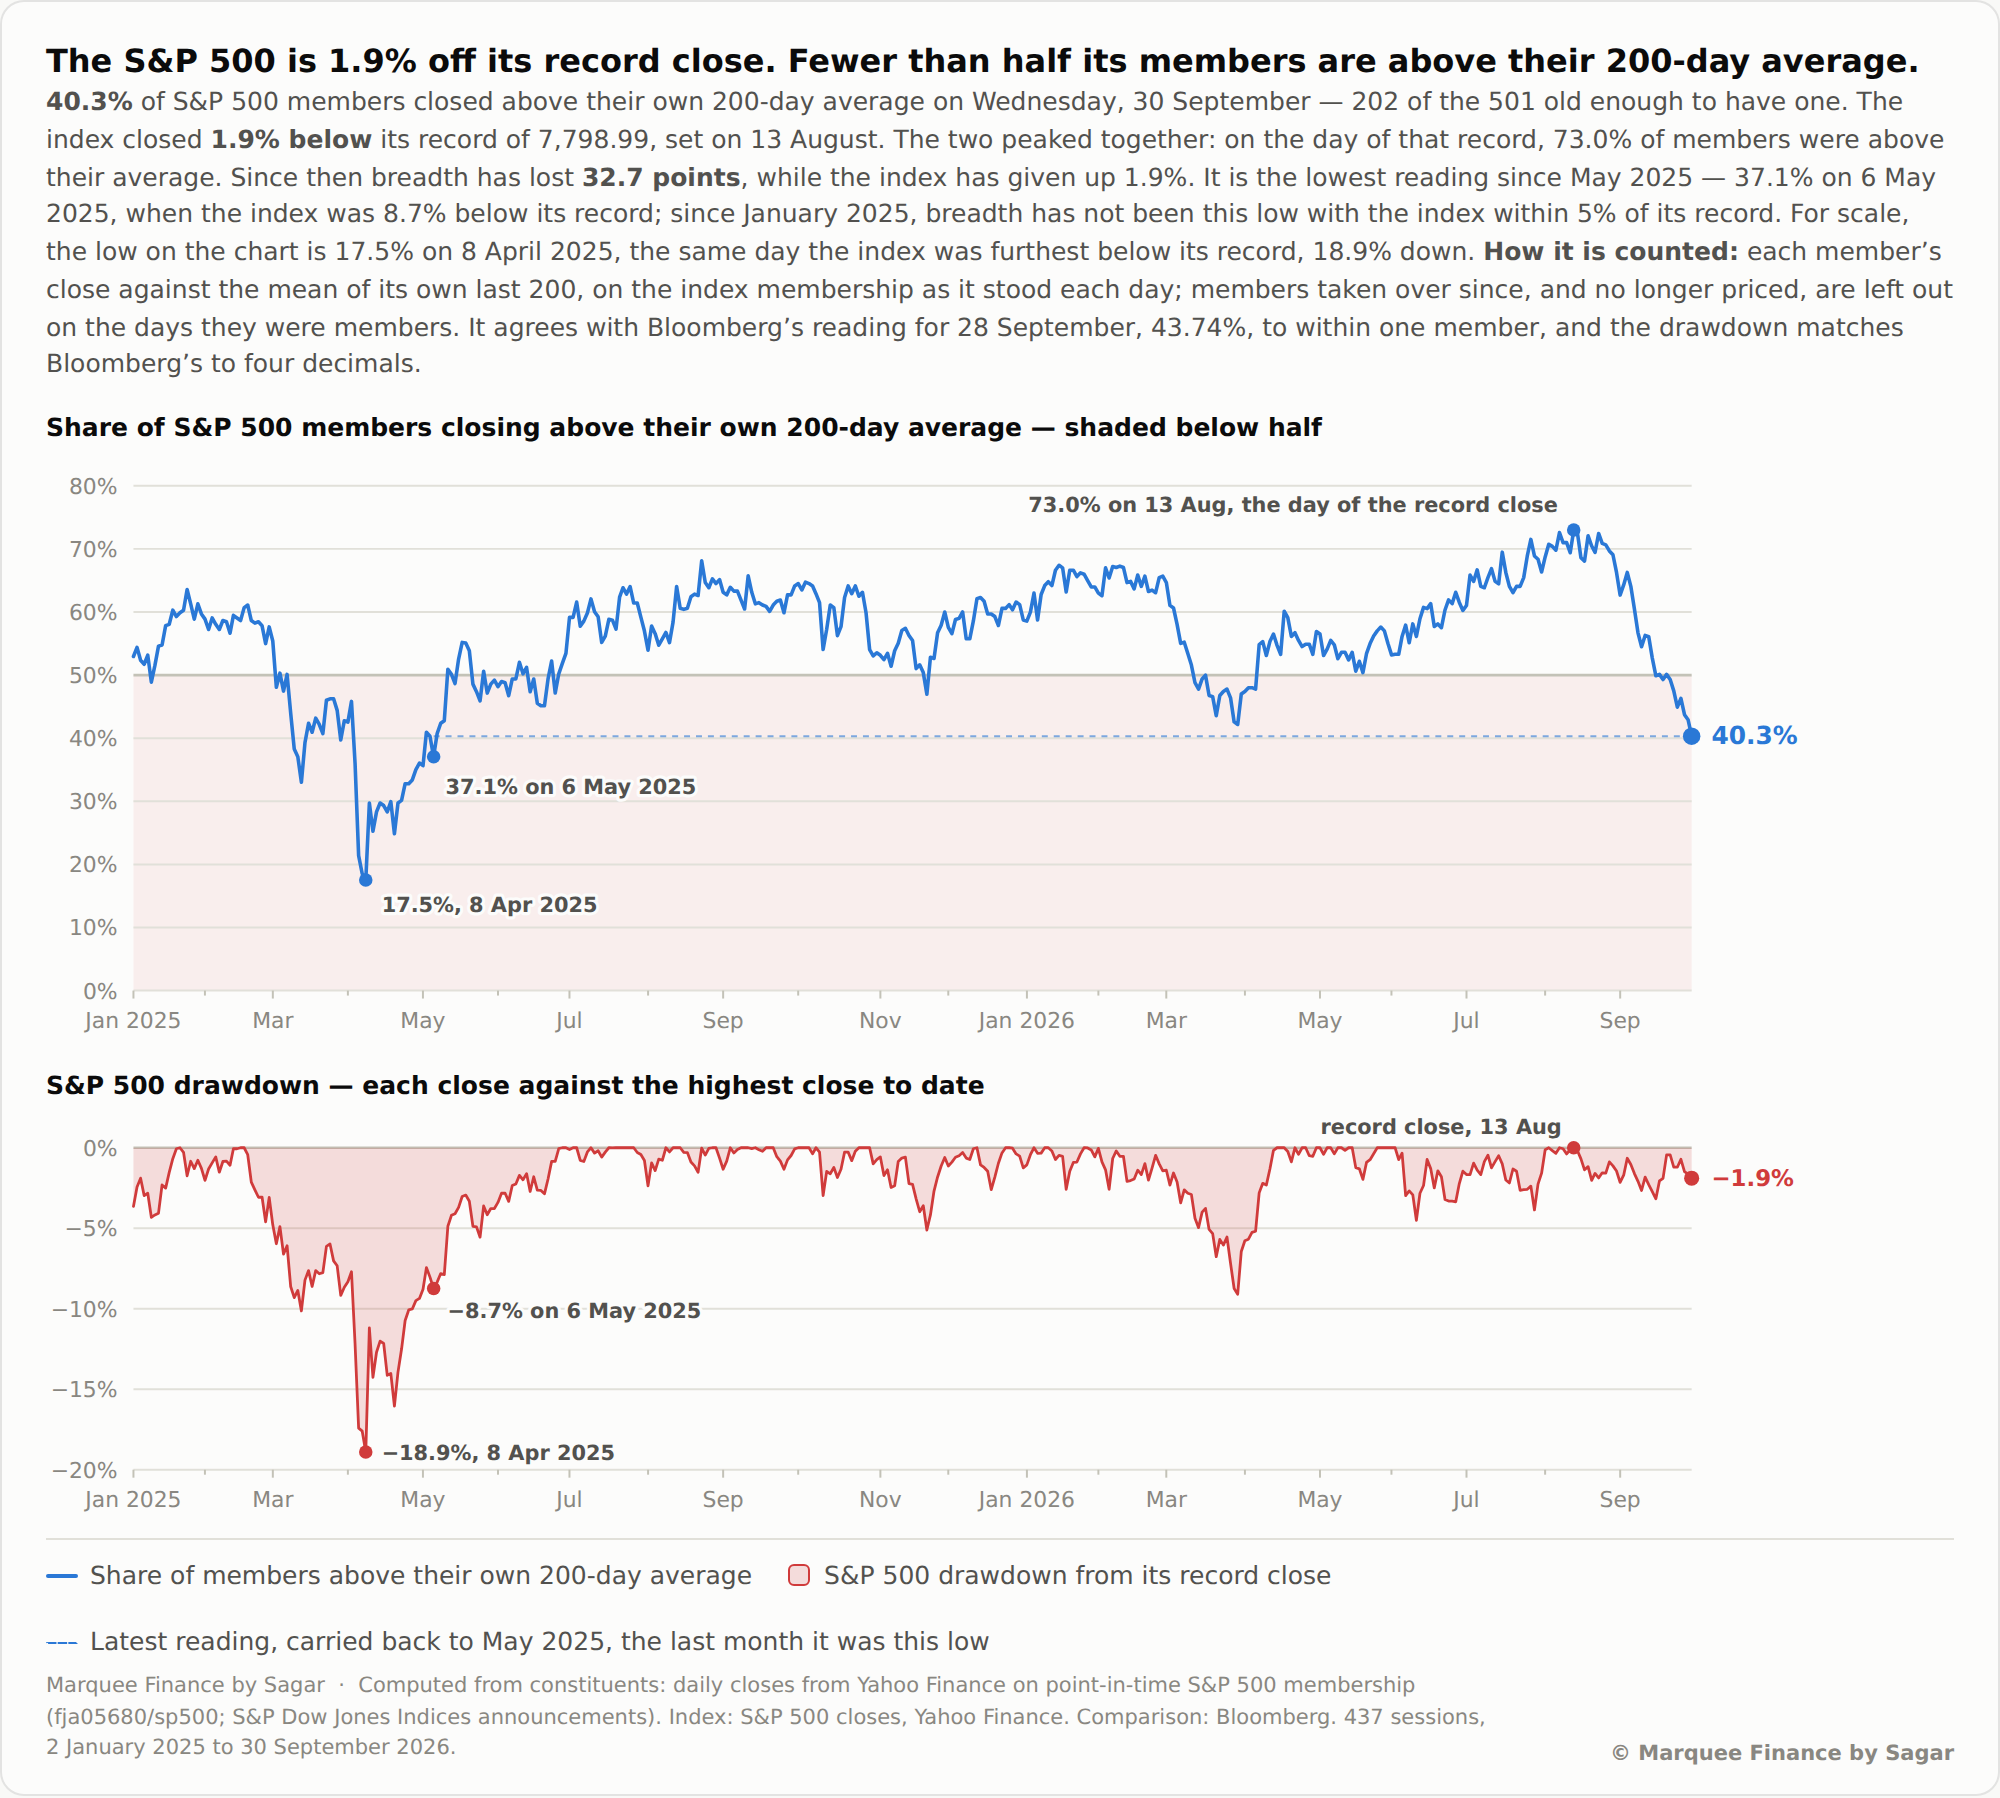
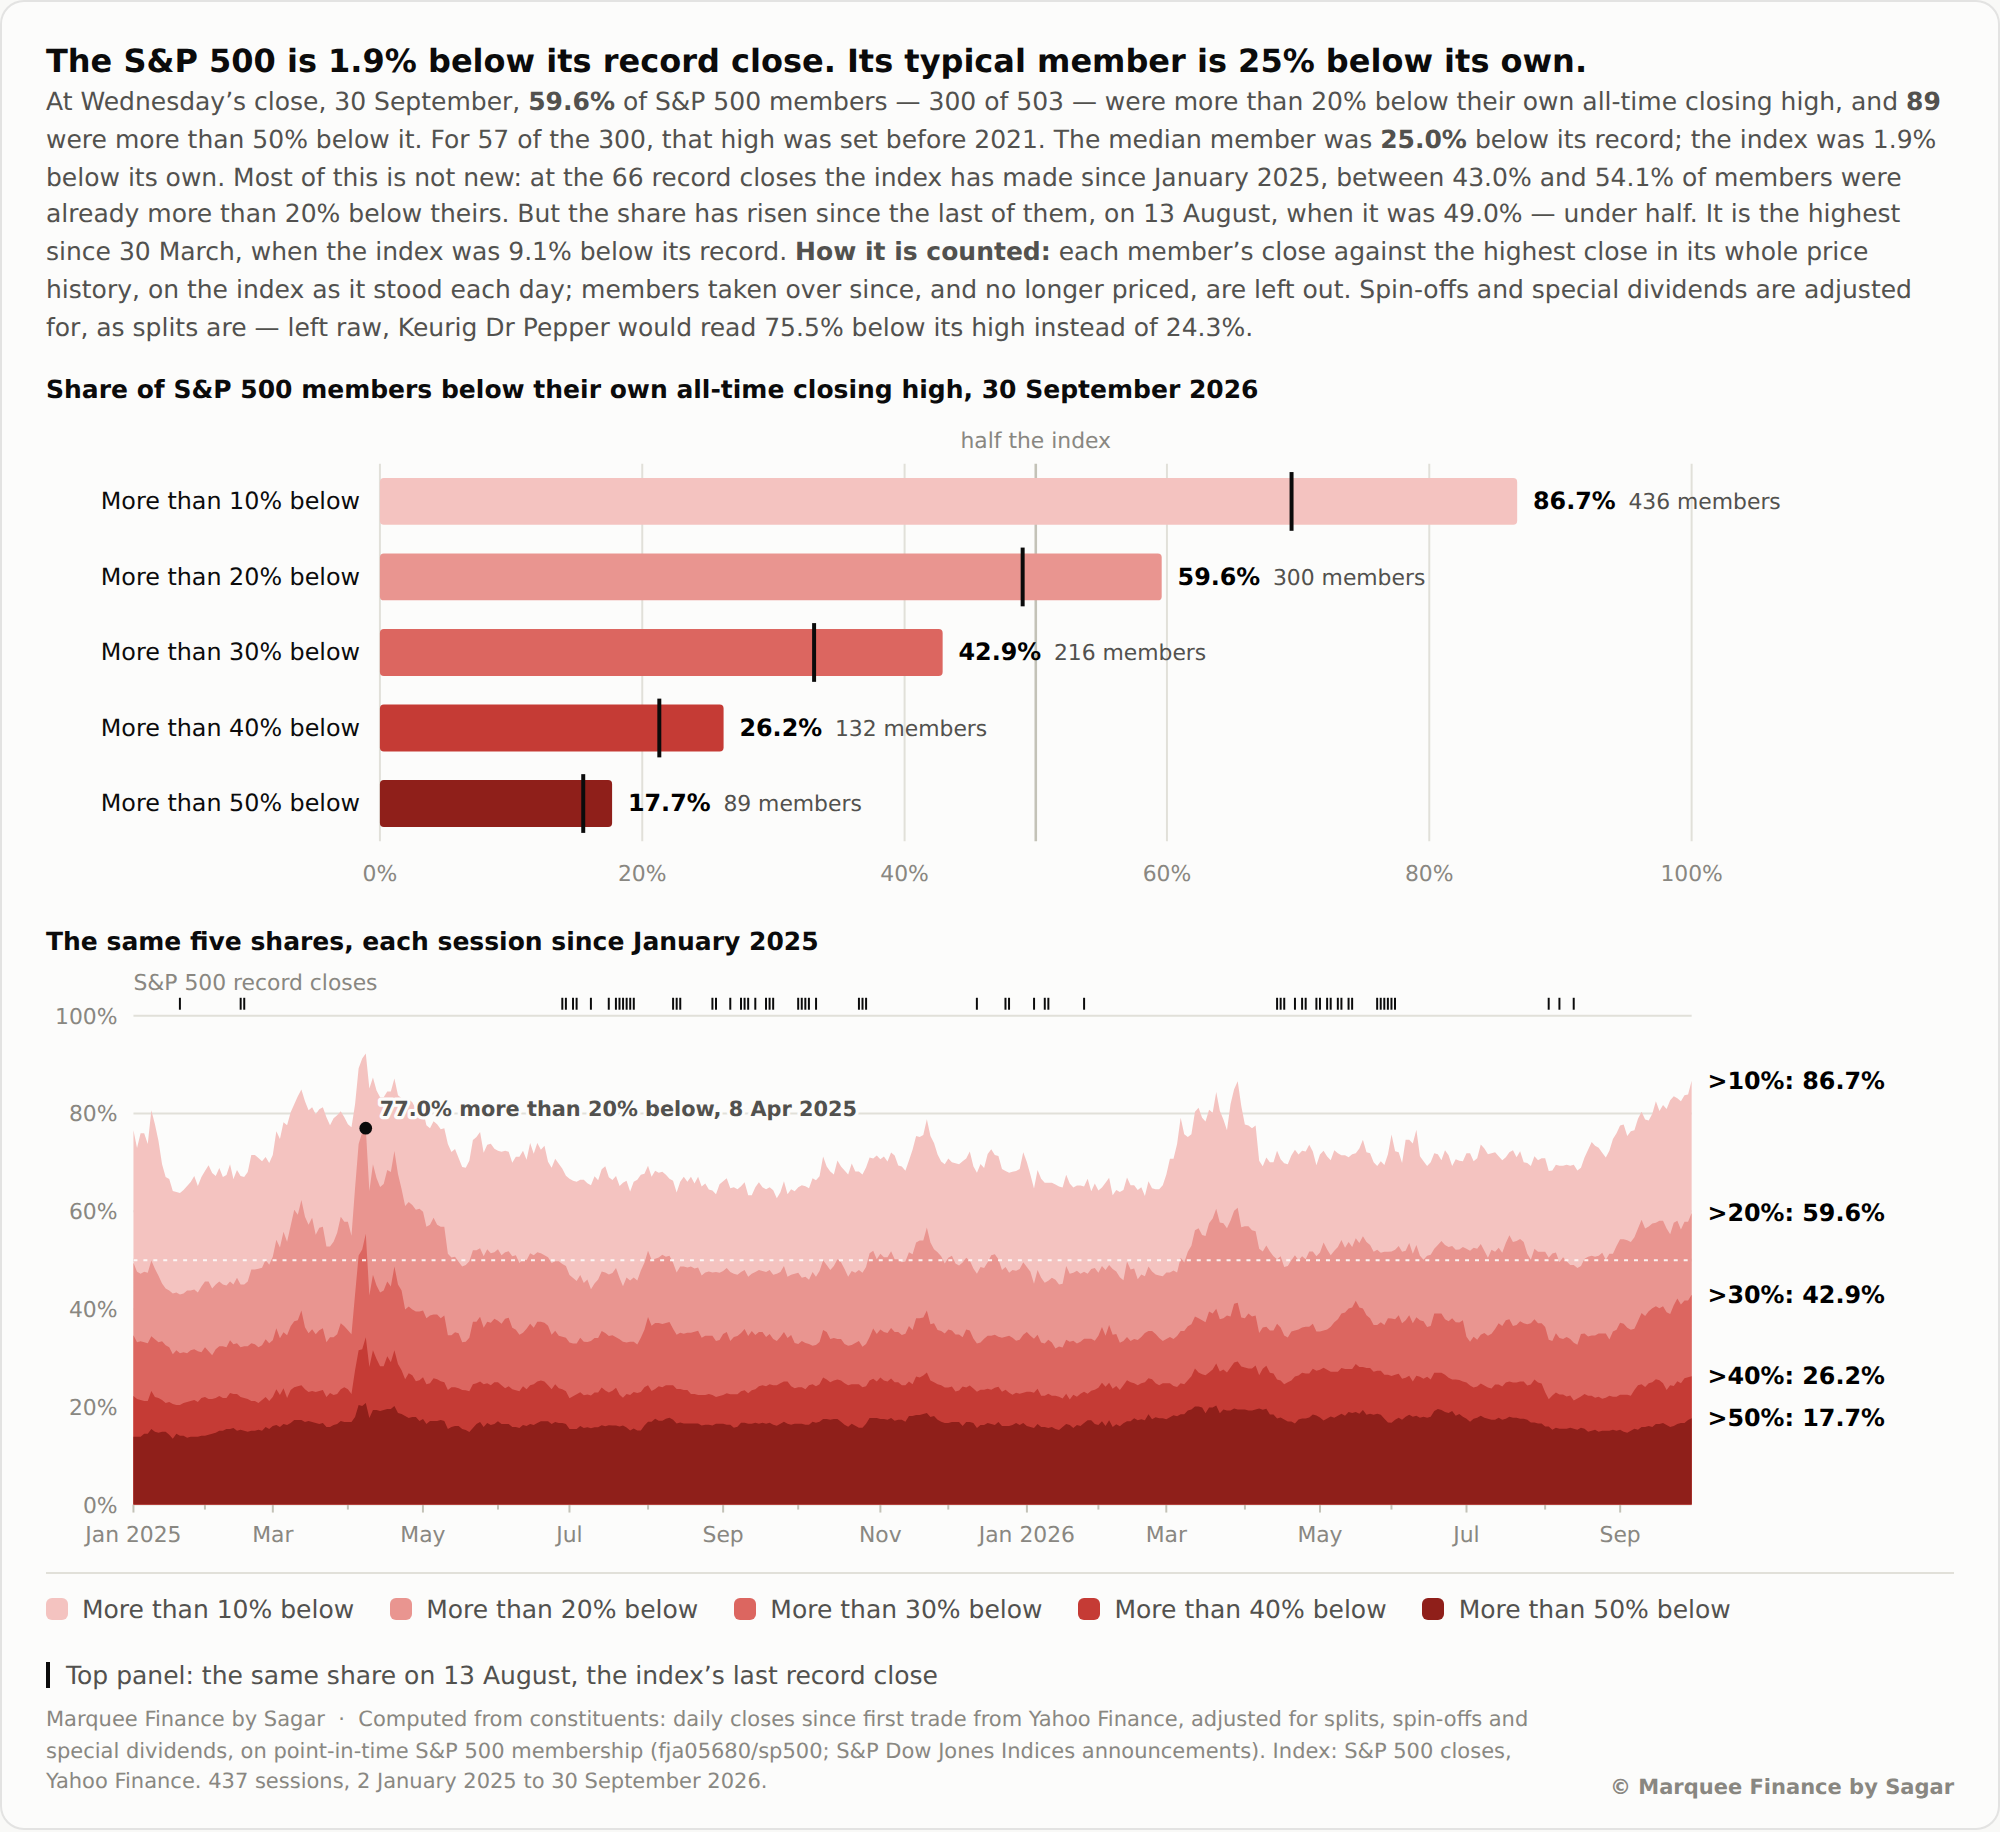
While the headline index is down just 1.9% from ATHs, only 40% of S&P 500 constituents are above their 200 DMA, a key technical indicator.
Furthermore, the last time we saw such a figure, the index was already down more than 8%.
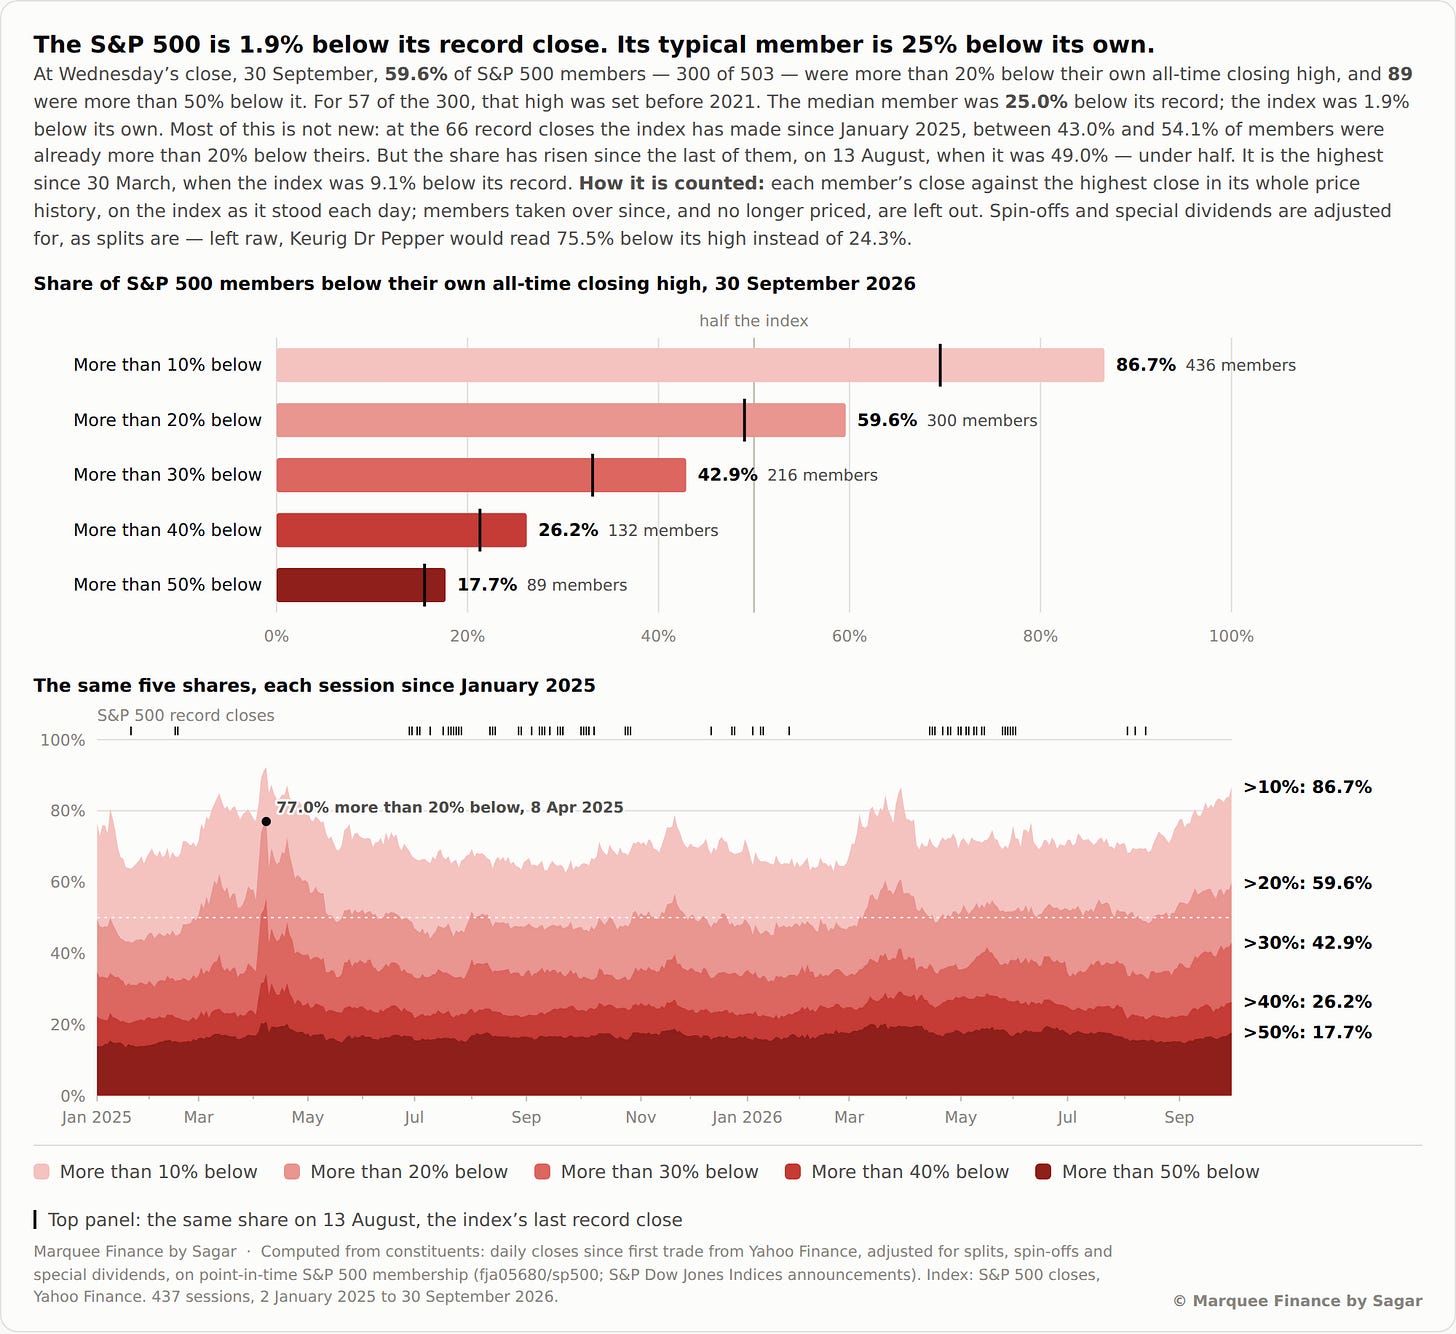
On a deeper look, we can see wealth destruction and deteriorating breadth at an unprecedented scale.
More than 43% of stocks are down 30%, and 60% of the index is in a bear market (stocks down more than 20%).
It’s absolute carnage out there; 18% of the constituents (roughly 95 stocks) are down 50%.
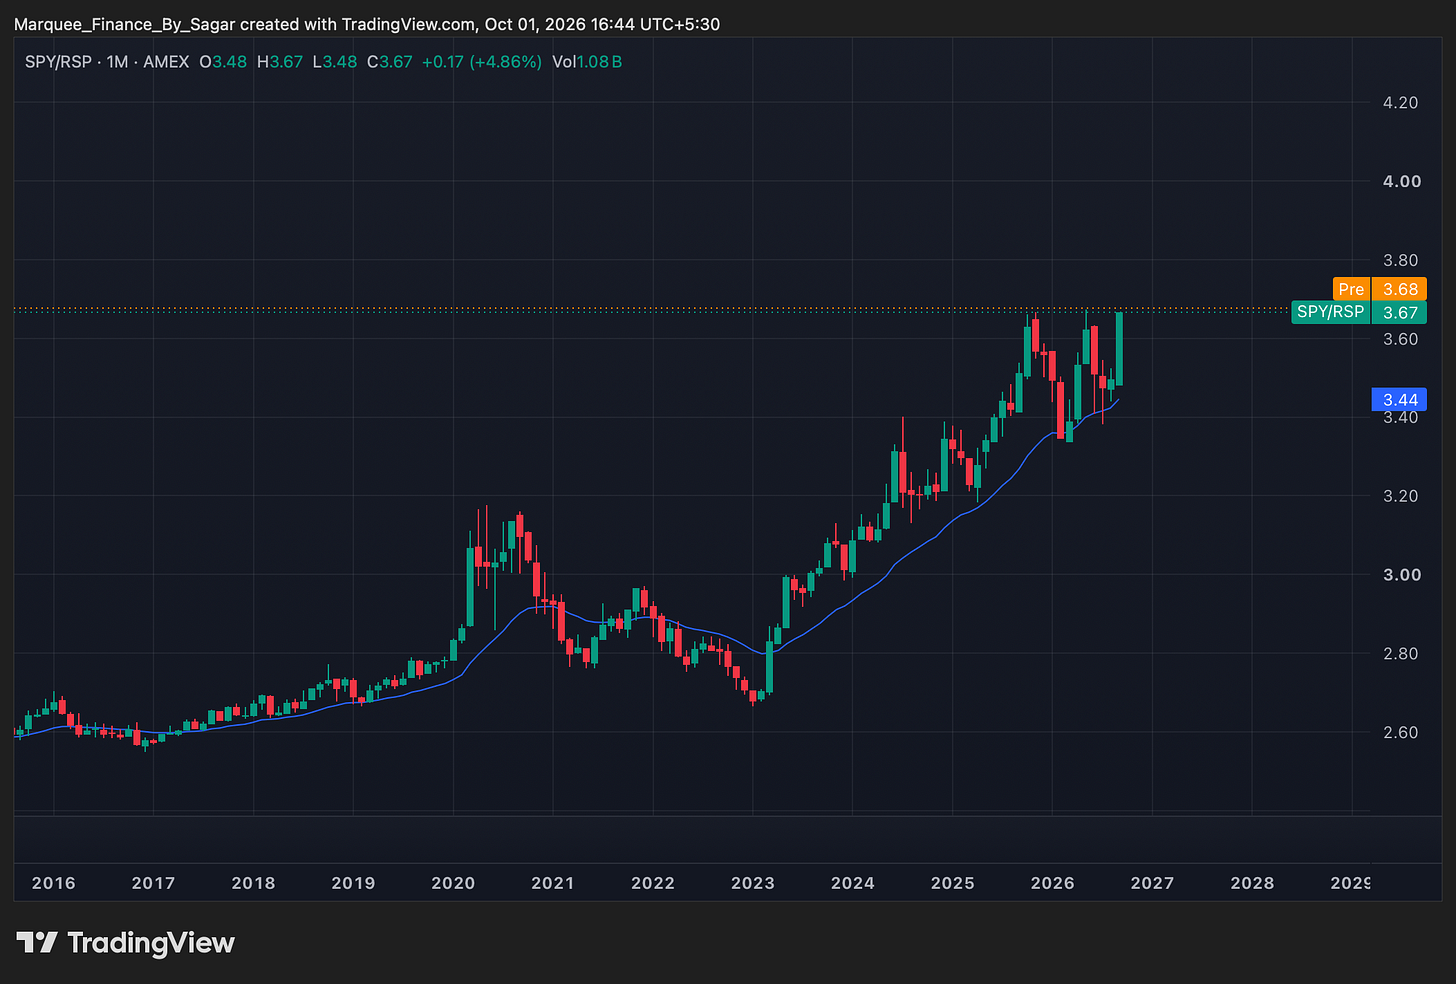
Since ChatGPT launched and the Mag7 bull market began, RSP (the equal-weight index) has underperformed SPY (the market-weight index).
In early 2026, we predicted the underperformance would end that year, as the US economy was super strong and a cyclical recovery was underway.
However, RSP’s full-year outperformance faded in a single month.
RSP’s underperformance vs SPY was the worst since March 2020; thus, unsurprisingly, diversified portfolios have been bleeding.
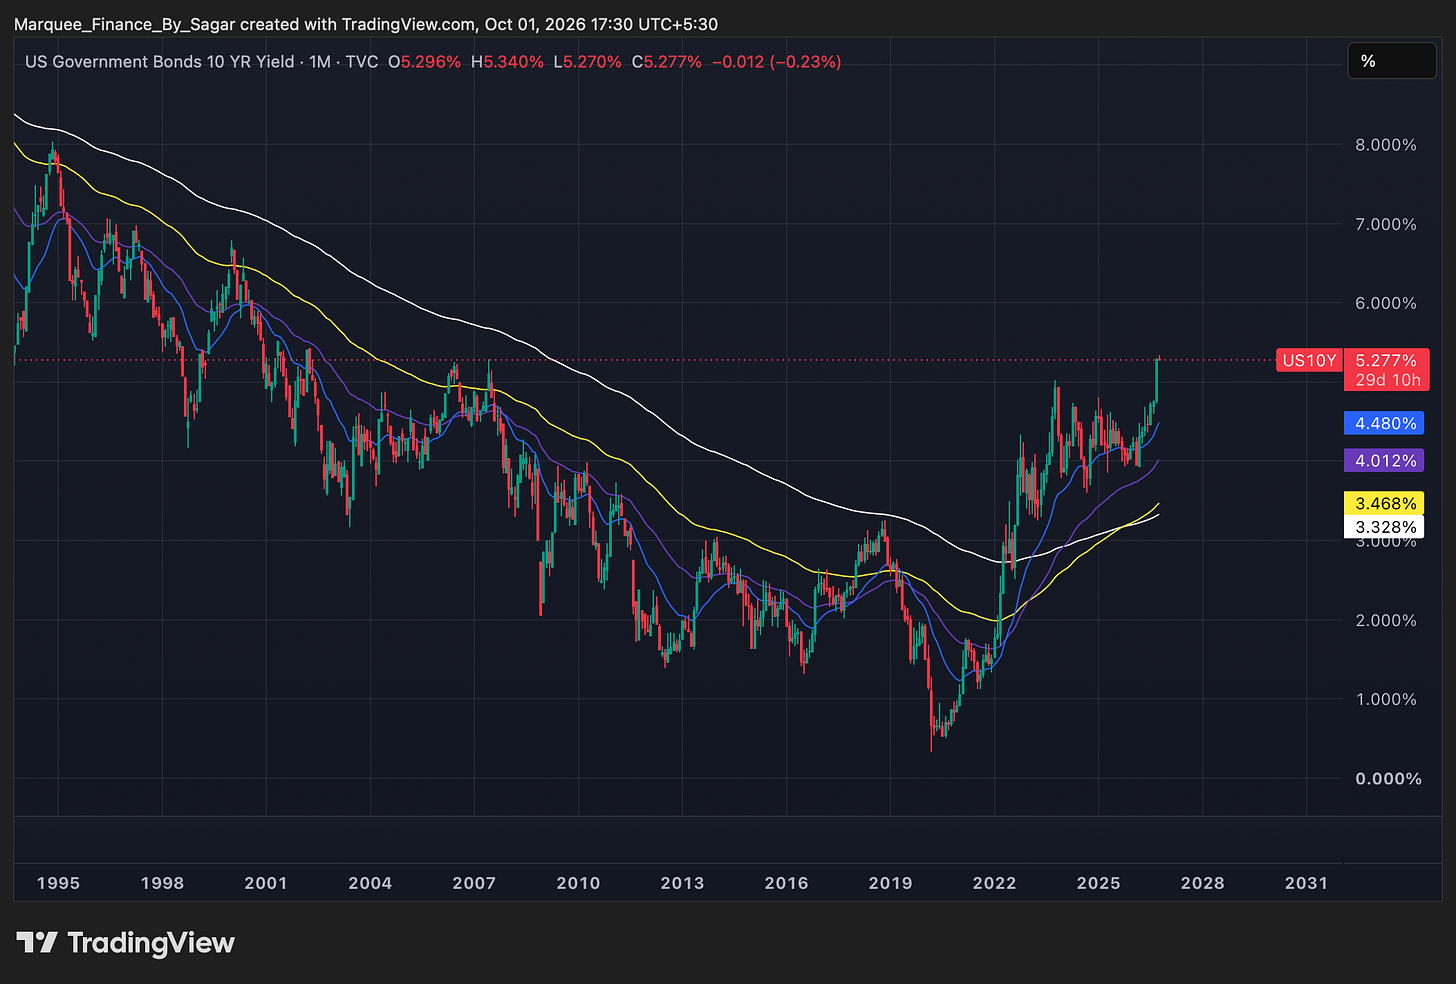
Pre-COVID bonds were a natural hedge against stock volatility, so 60:40 portfolios were introduced.
However, bonds have failed to provide a cushion, and we are witnessing a stunning vertical rise in yields.
Bond bulls have been annihilated, and we expect the bear market to continue.
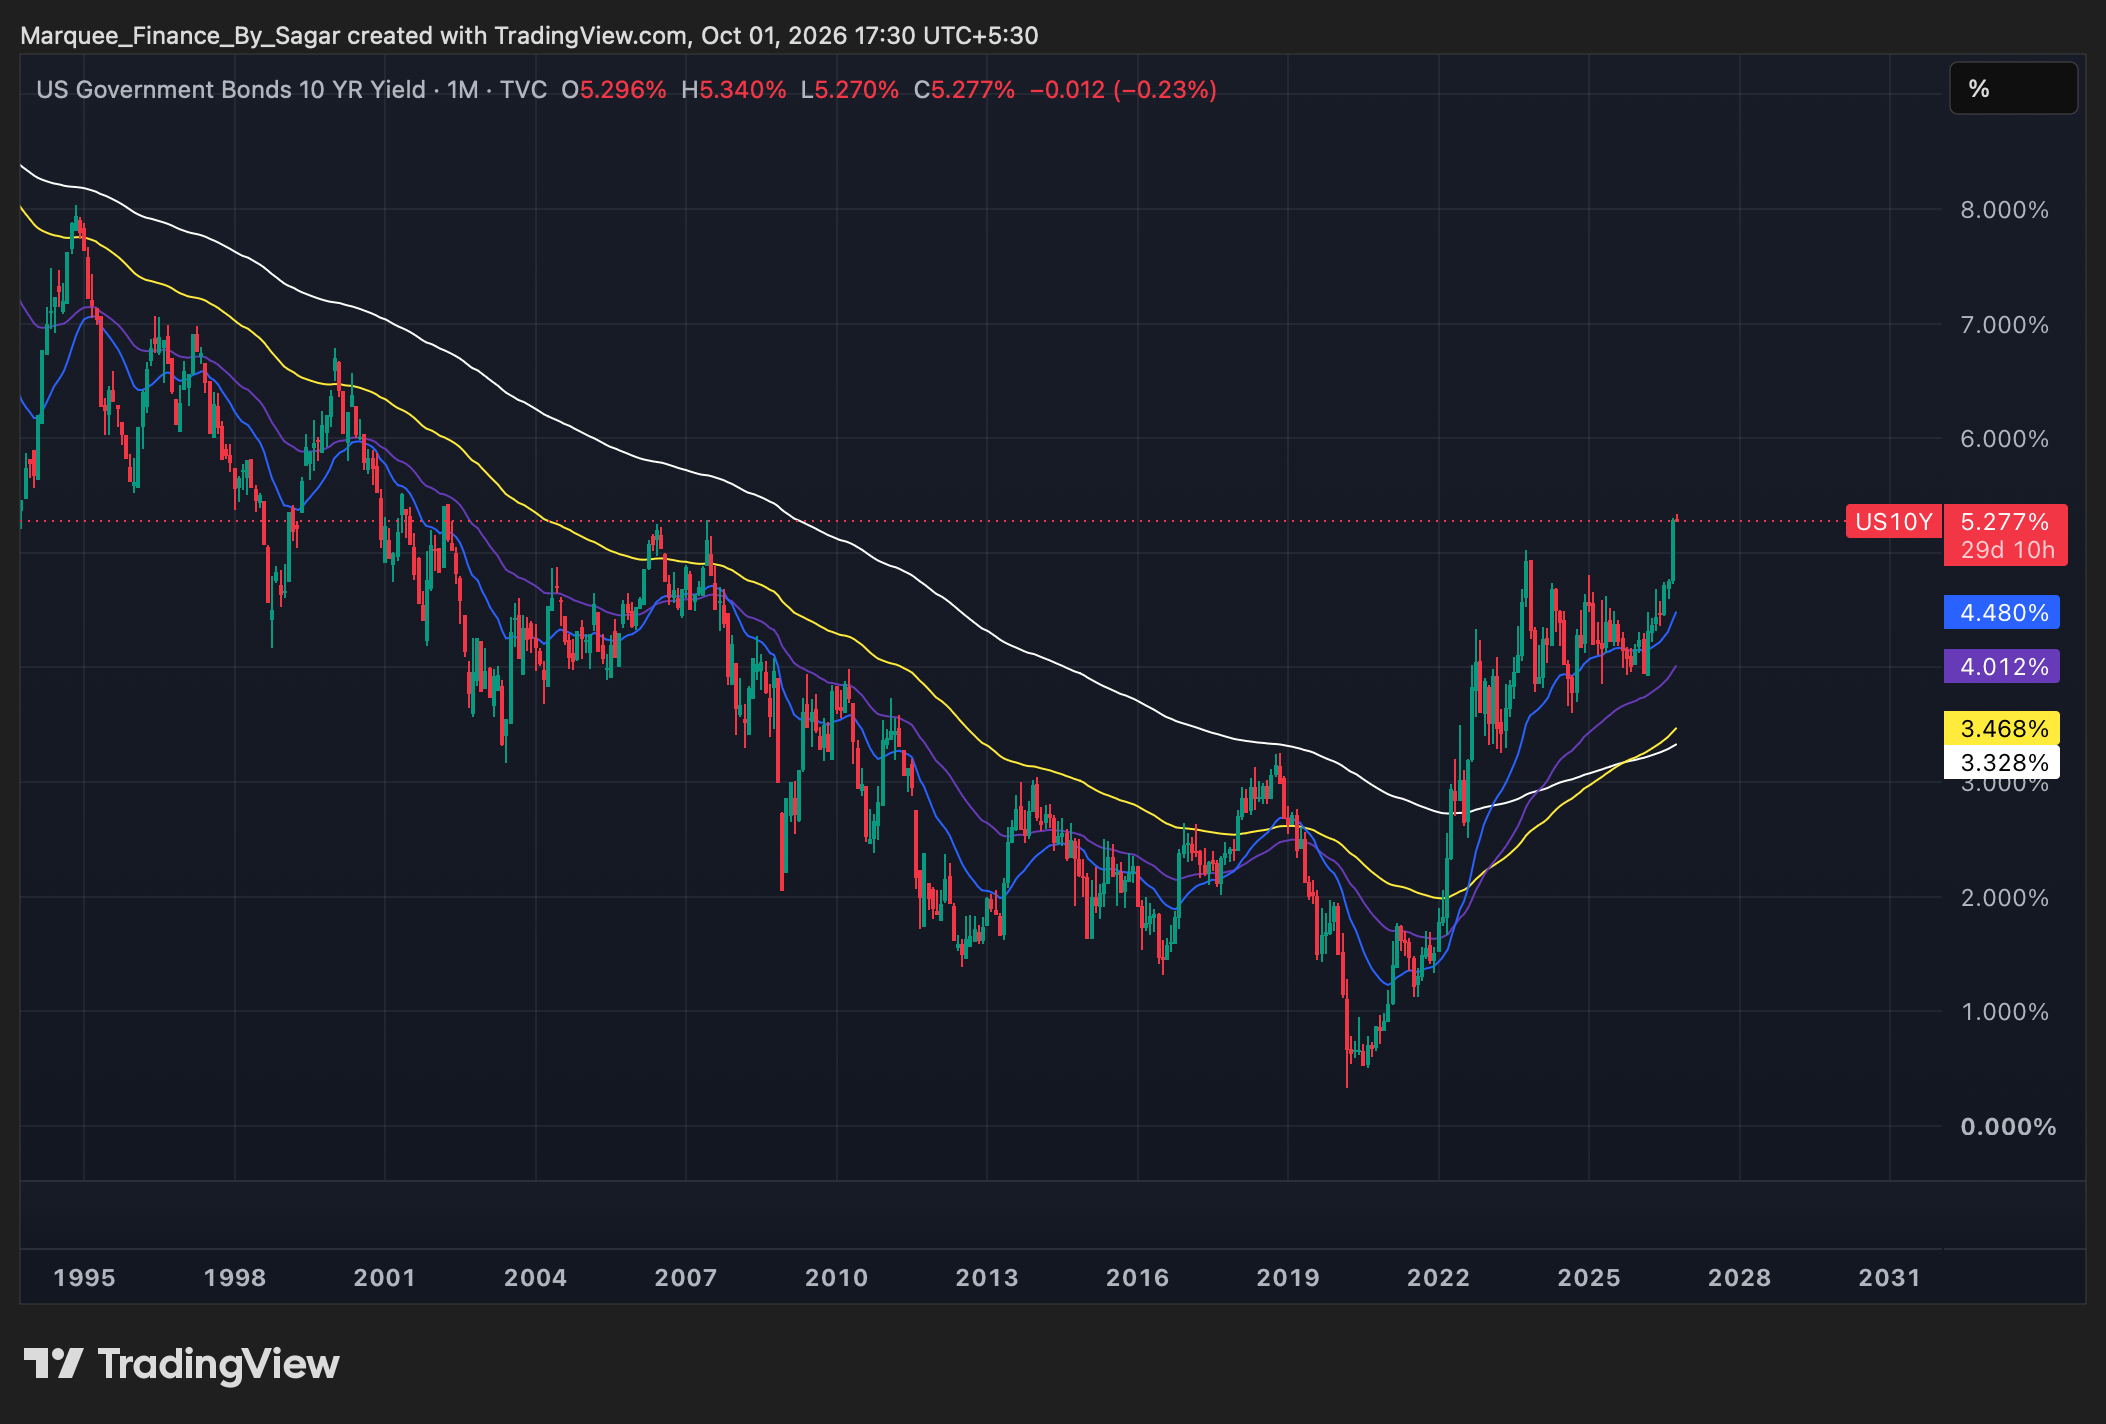
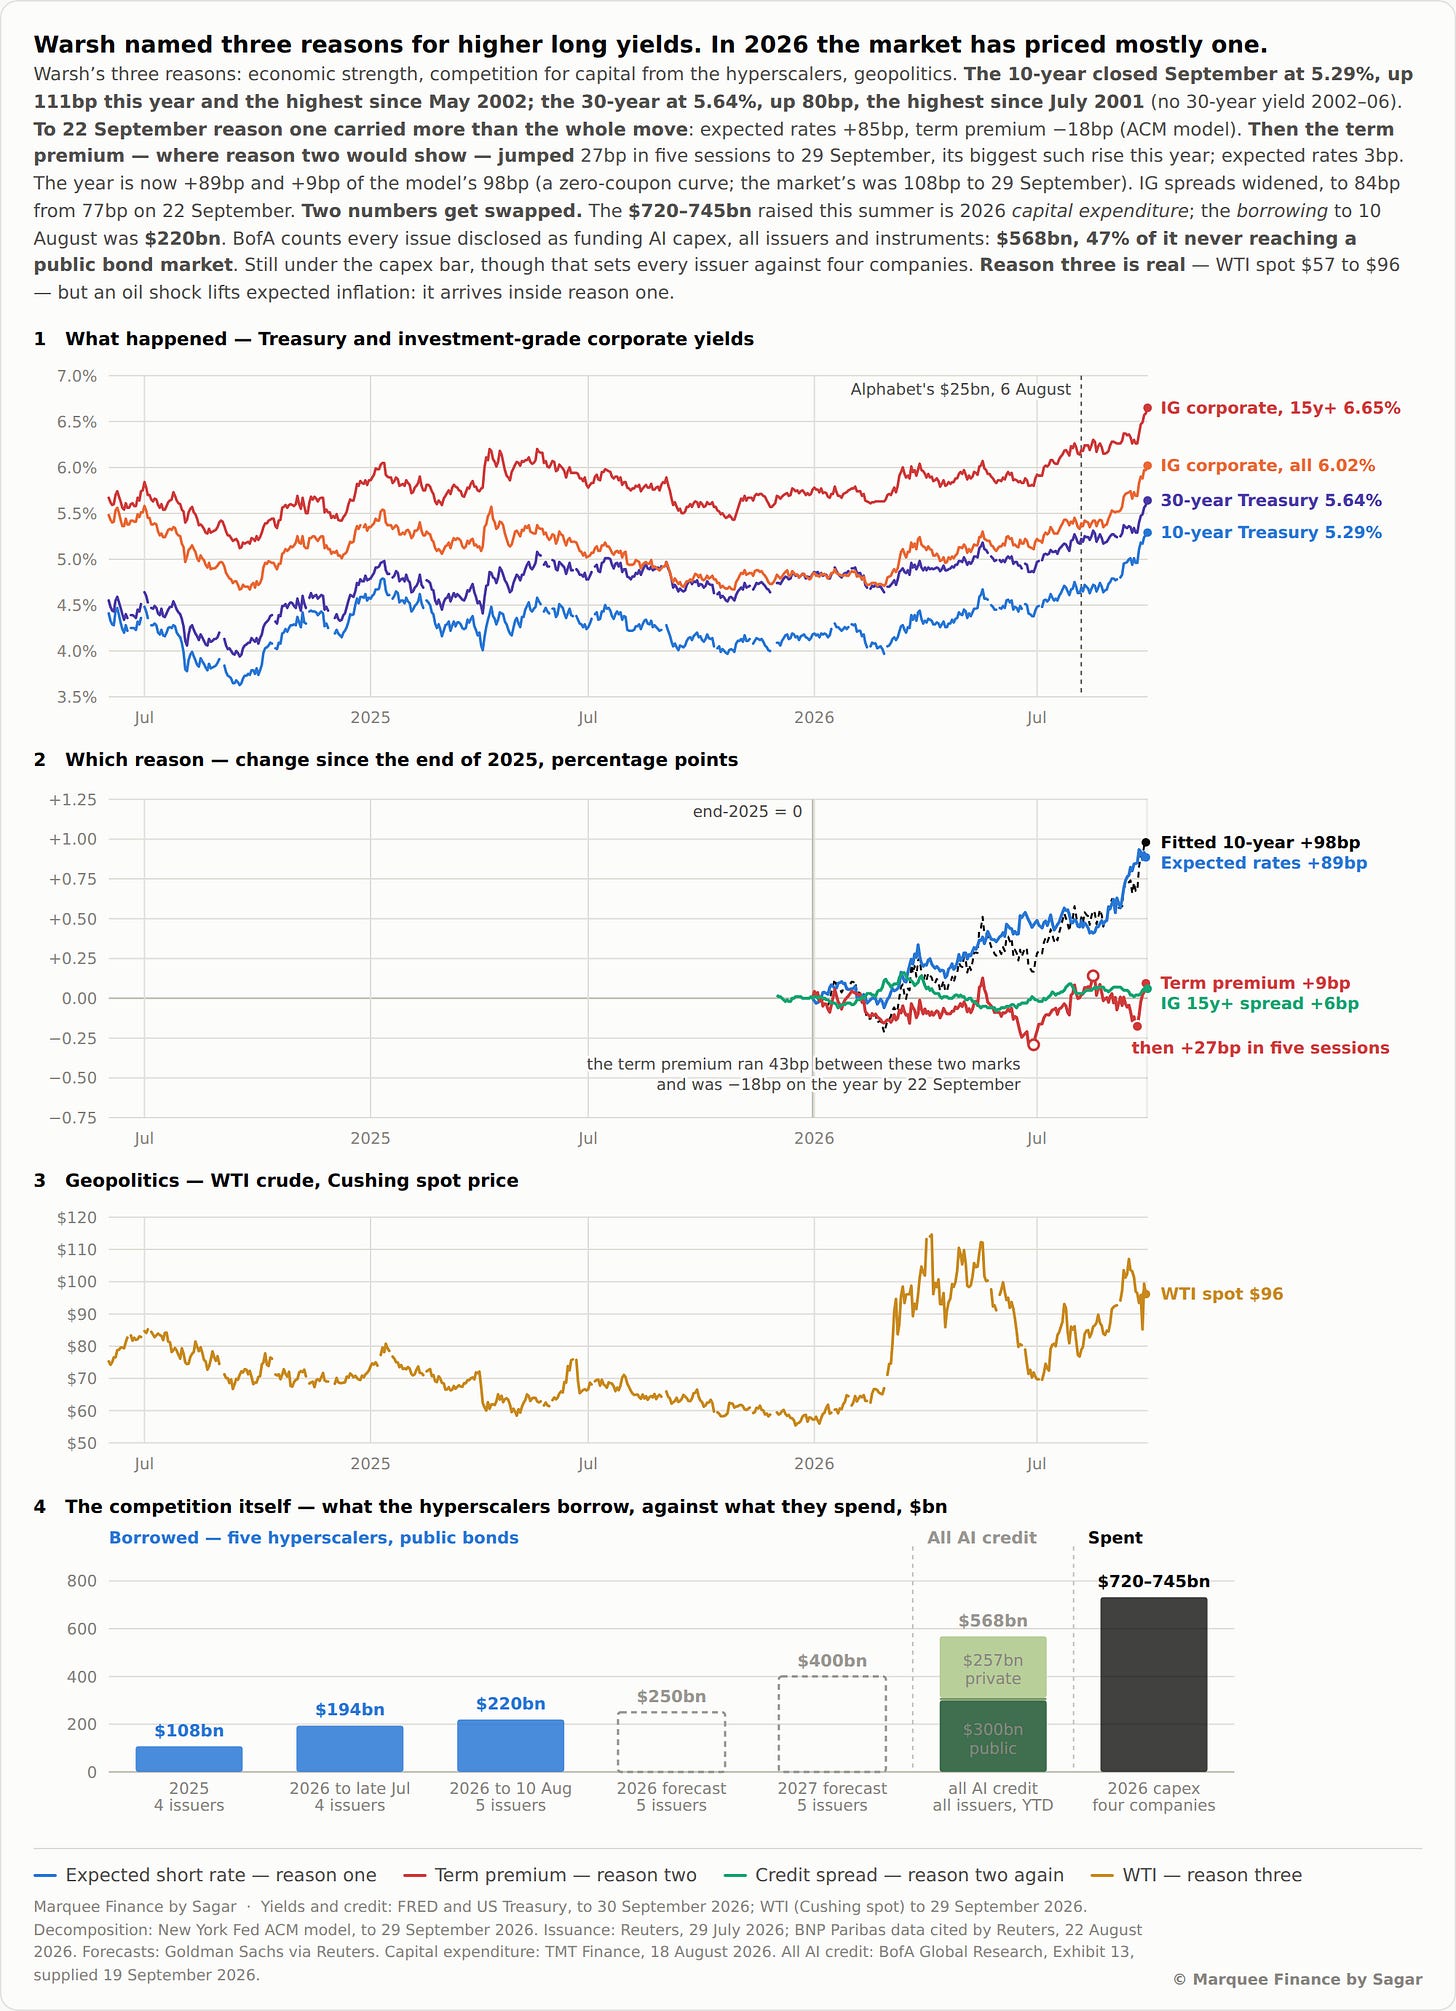
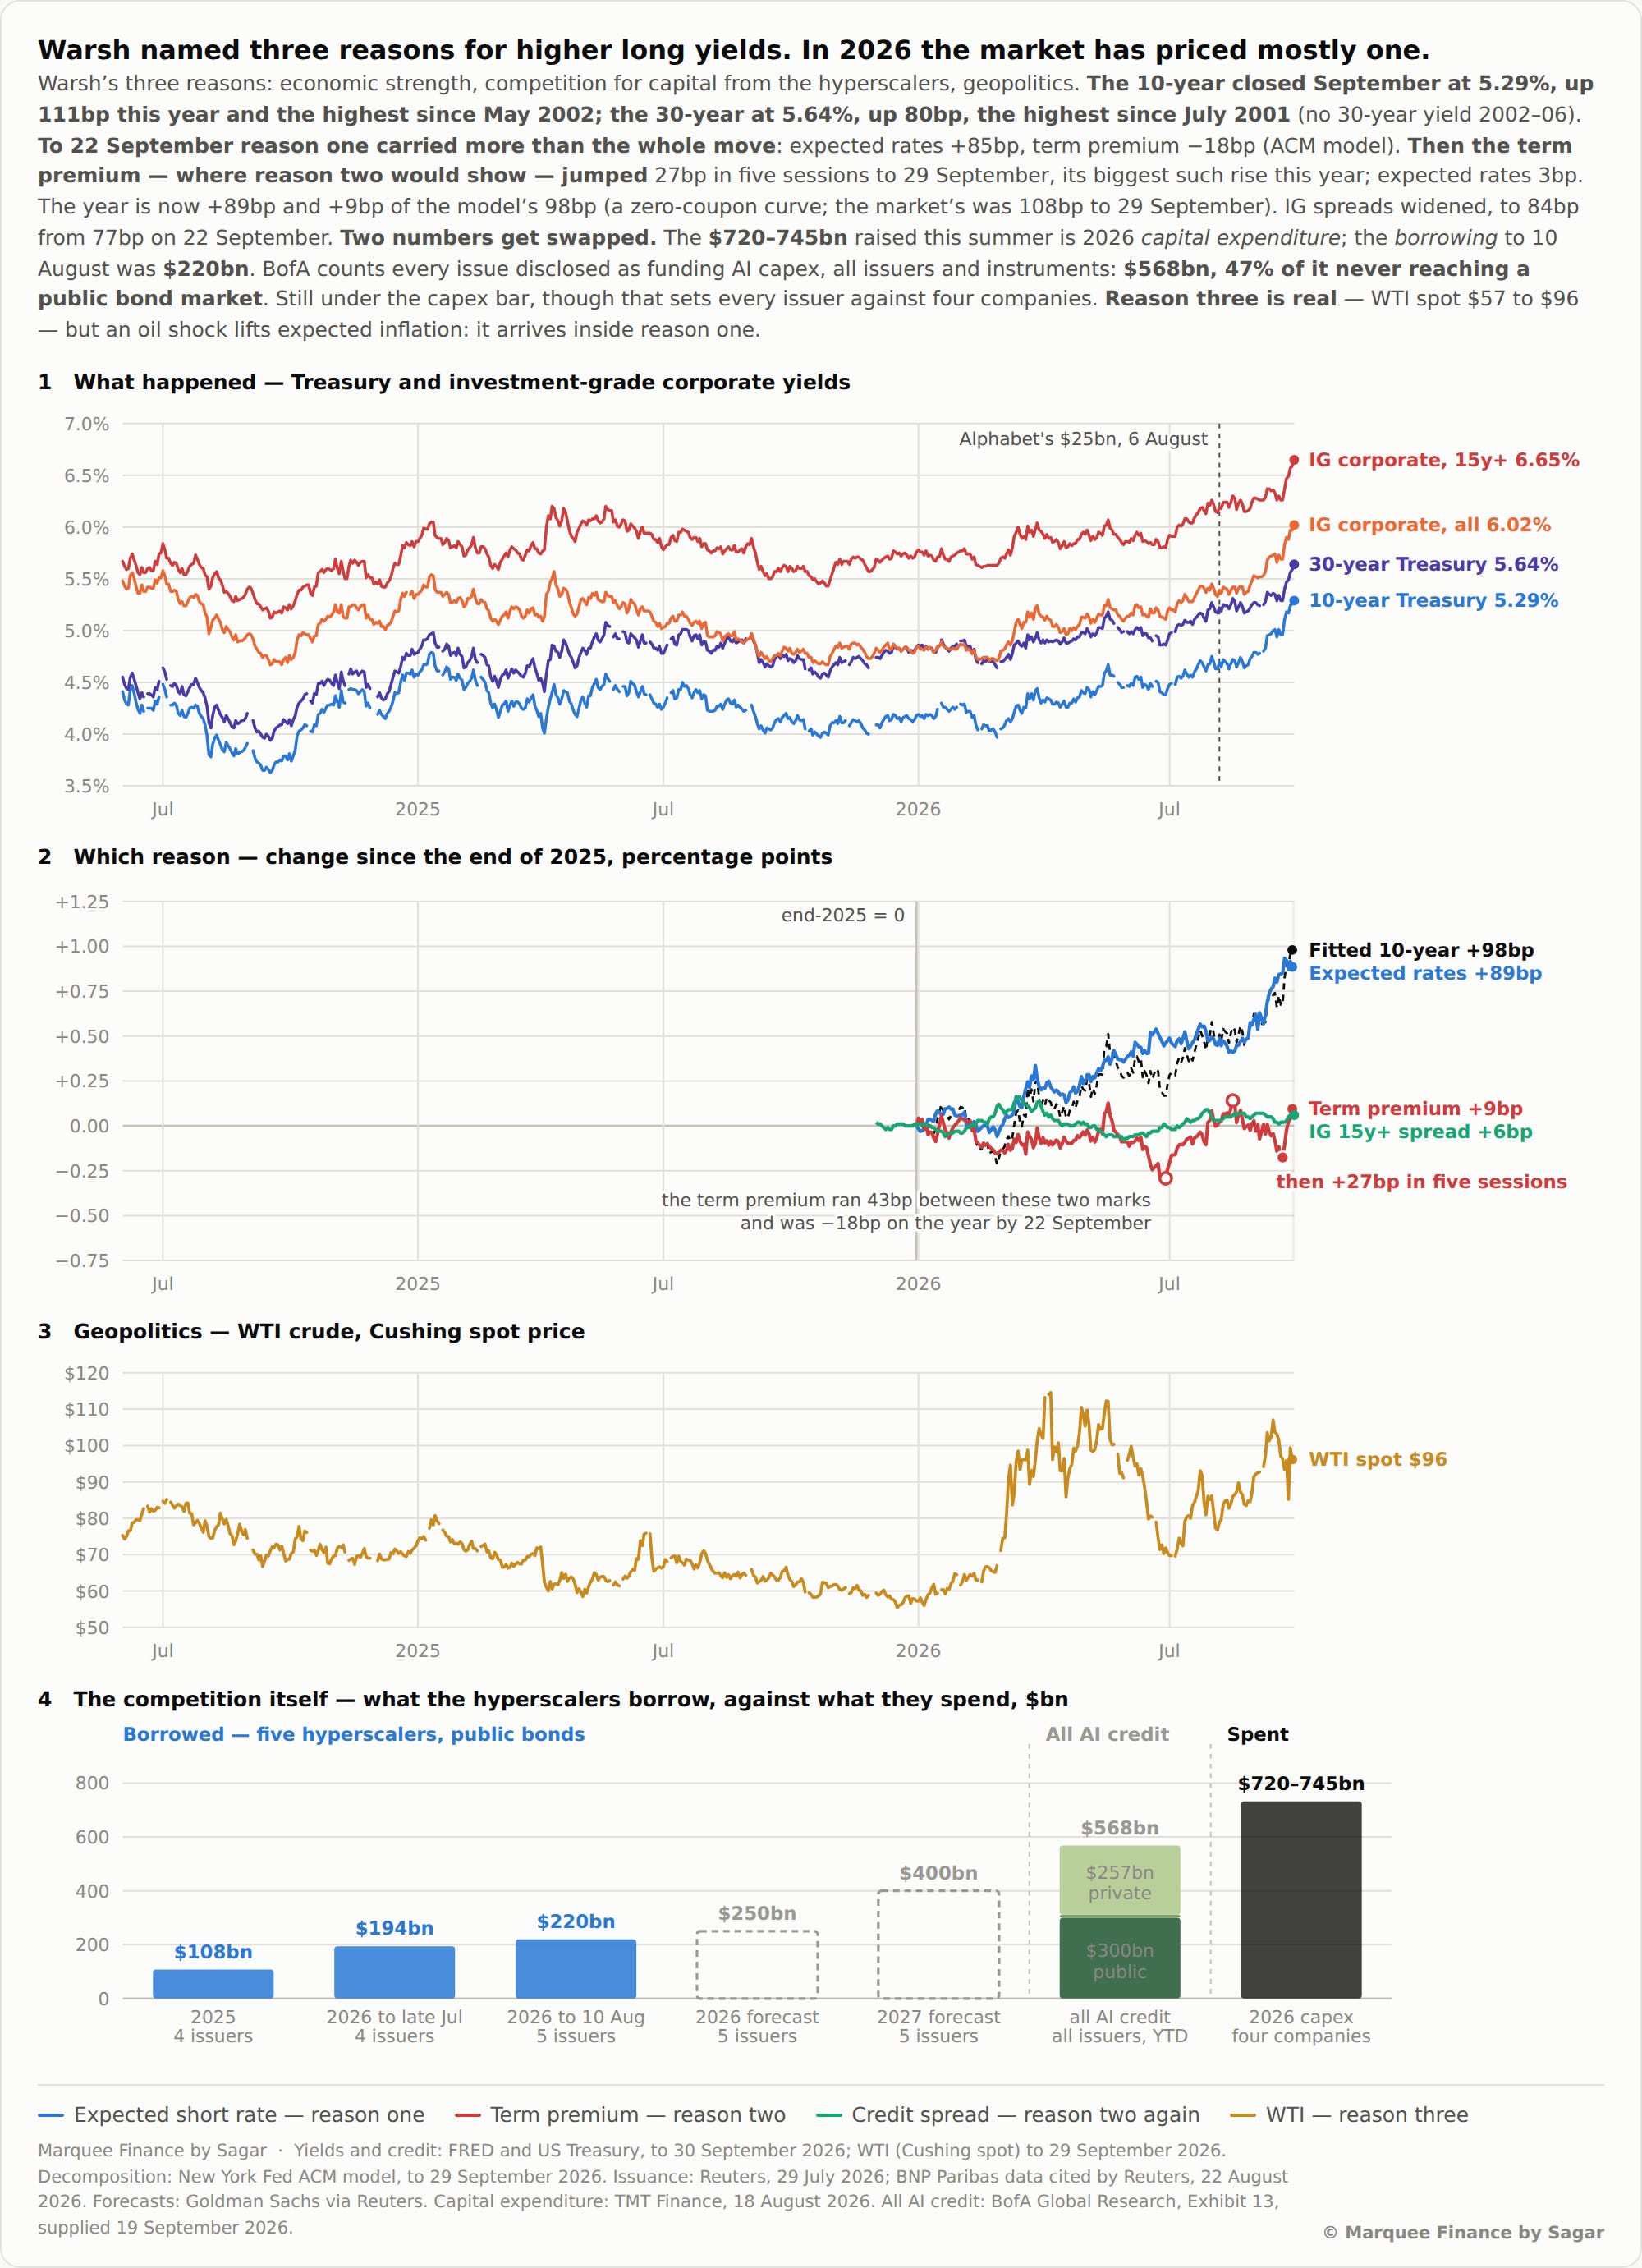
While everybody is wondering what’s driving the move in yields, Warsh mentioned three reasons during the FOMC.
Economic strength, geopolitics, and the crowding-out effect from borrowing by hyperscalers.
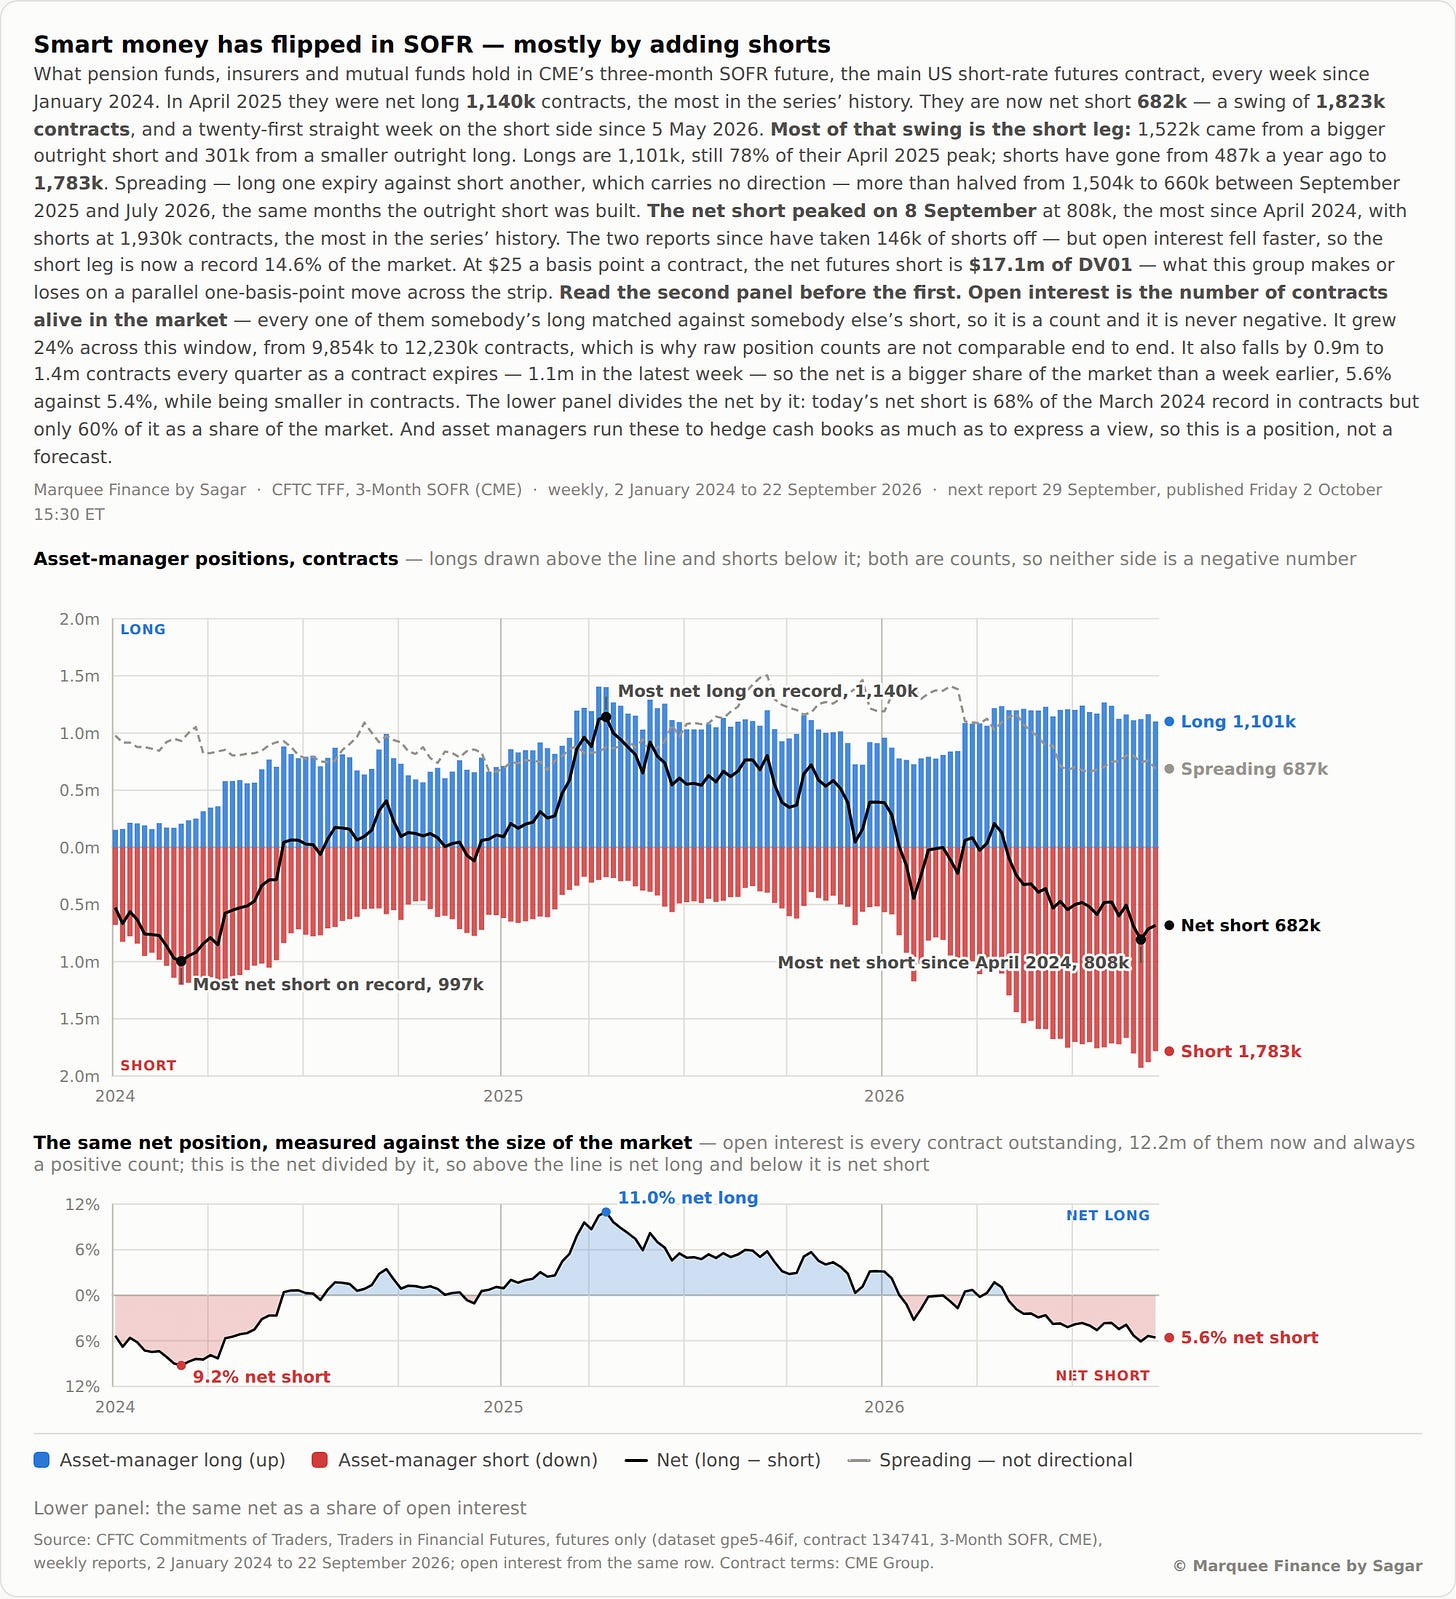
Looking at positioning in the bond market, smart money is still net short (enormous) in futures.
Some market participants believe that the bond market is susceptible to a short squeeze; however, we need positive news flow from the Middle East for a material decline in yields.
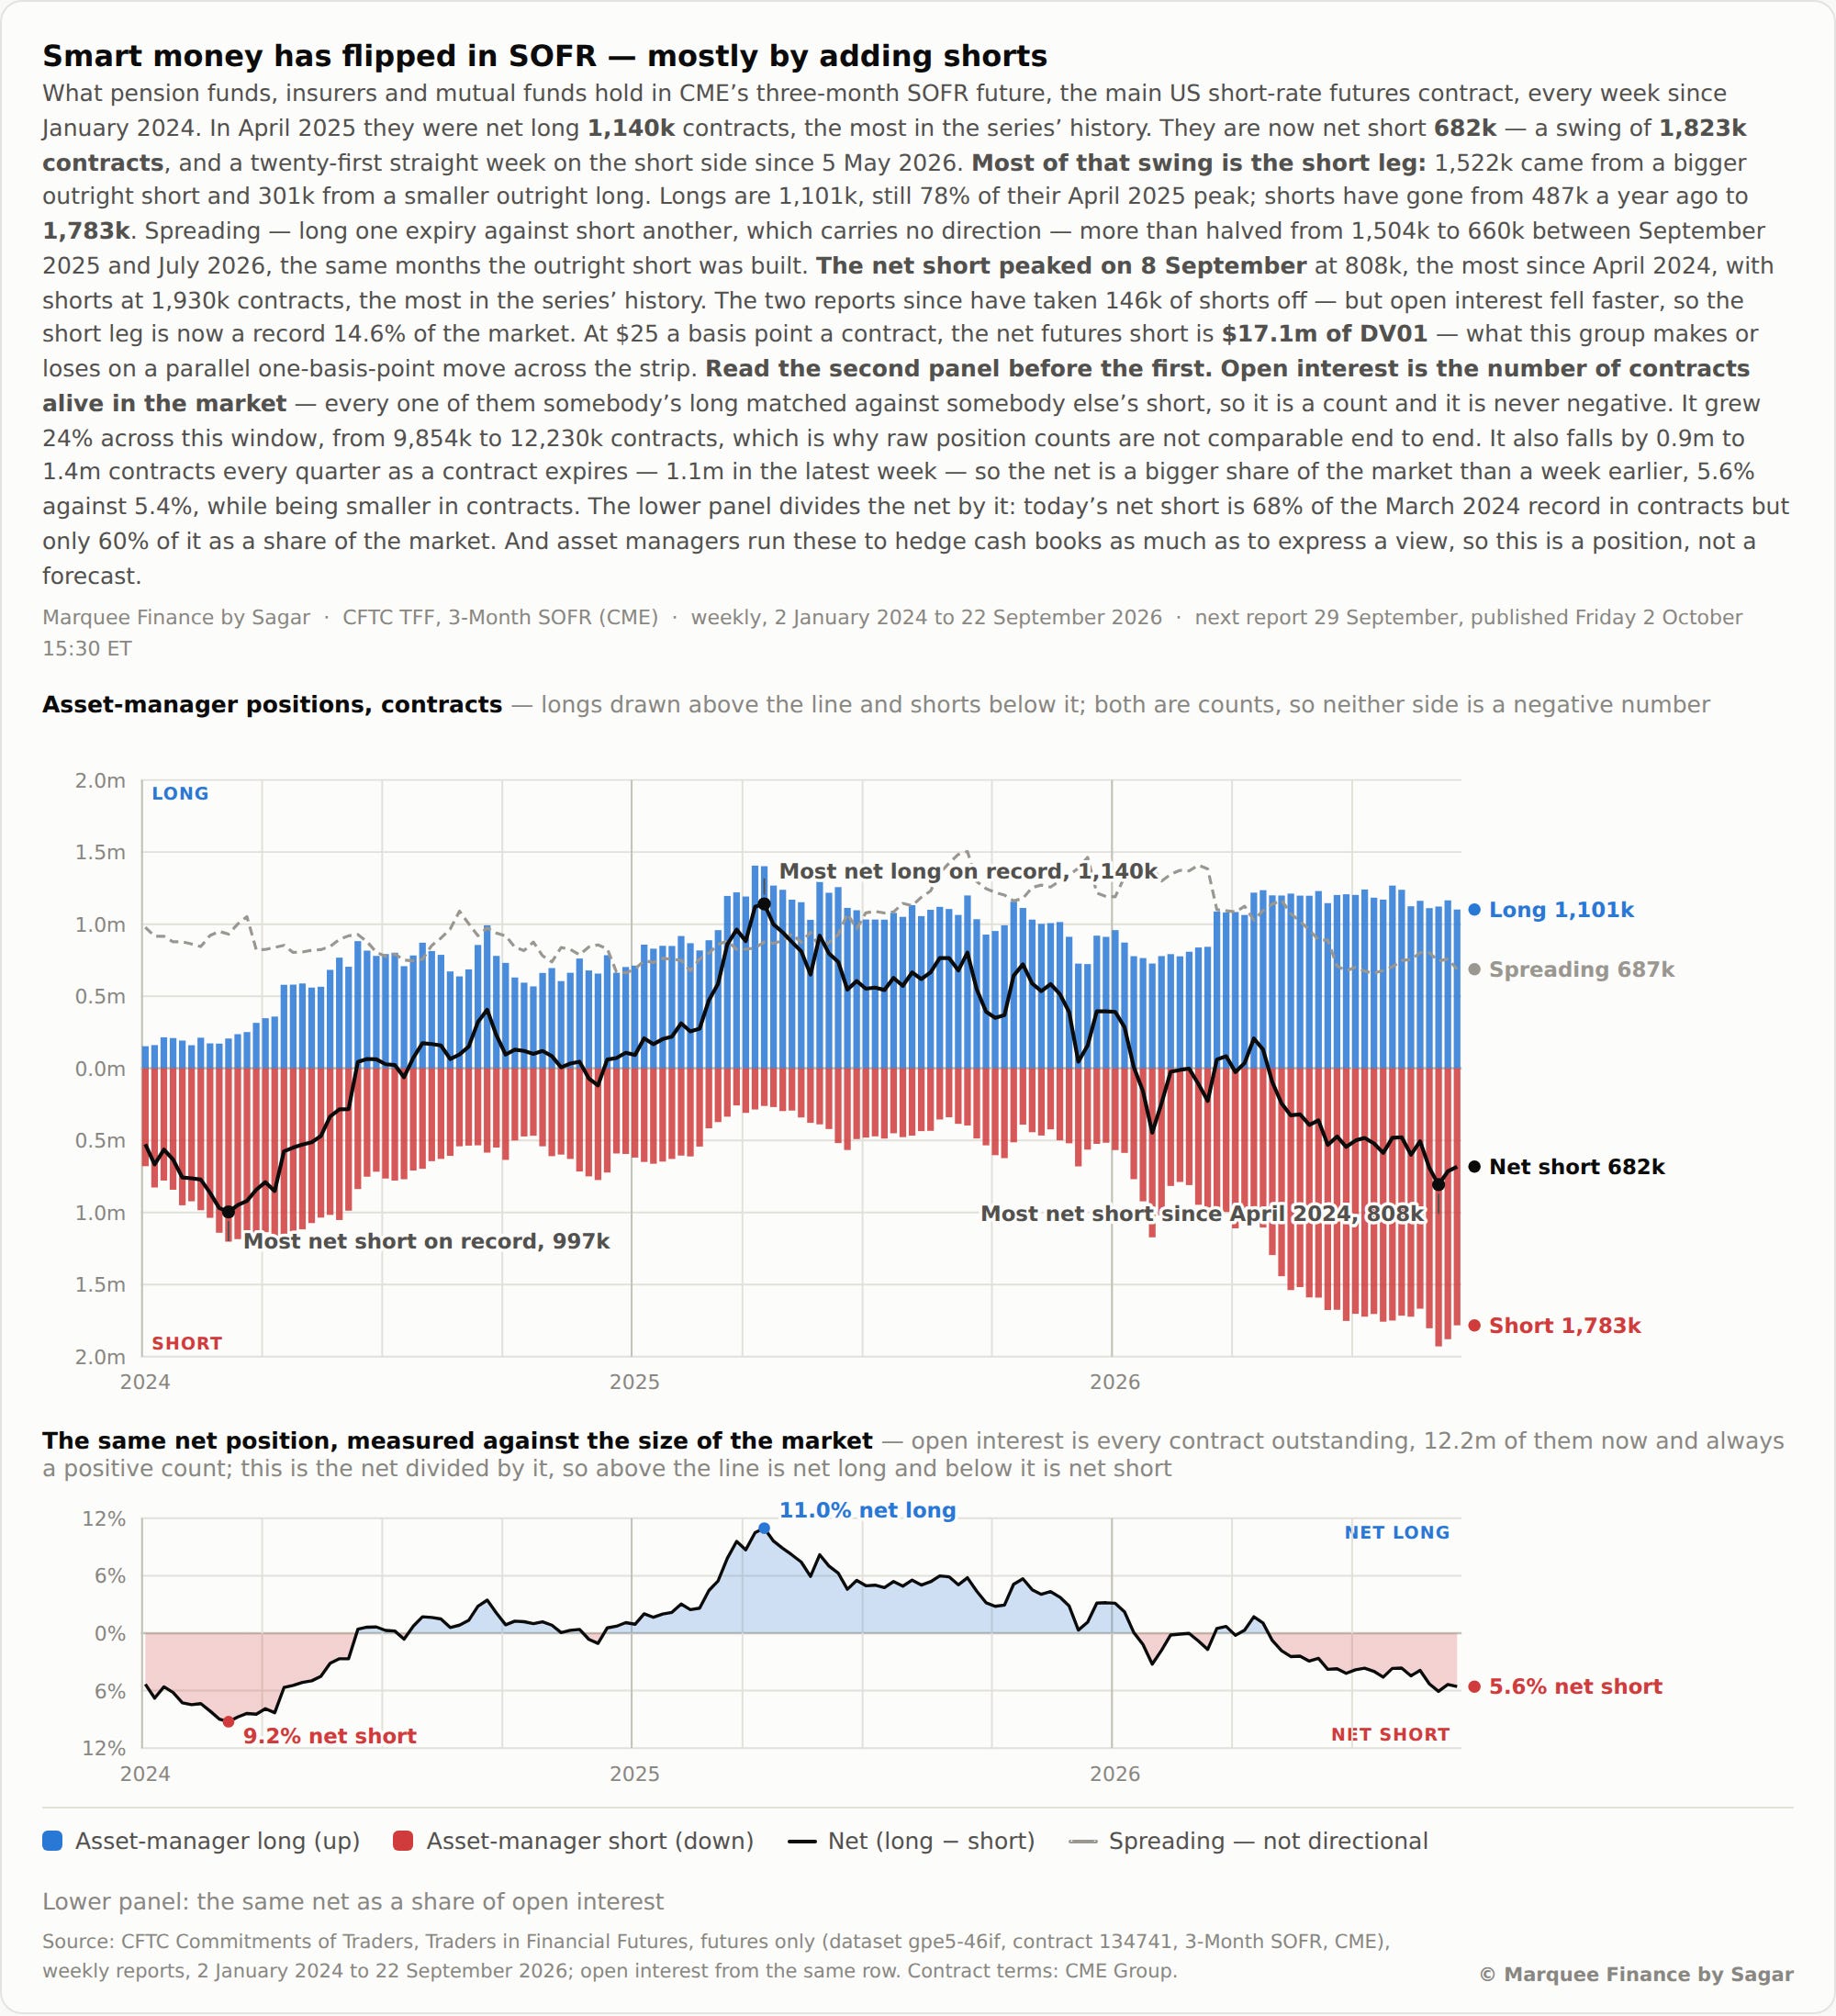
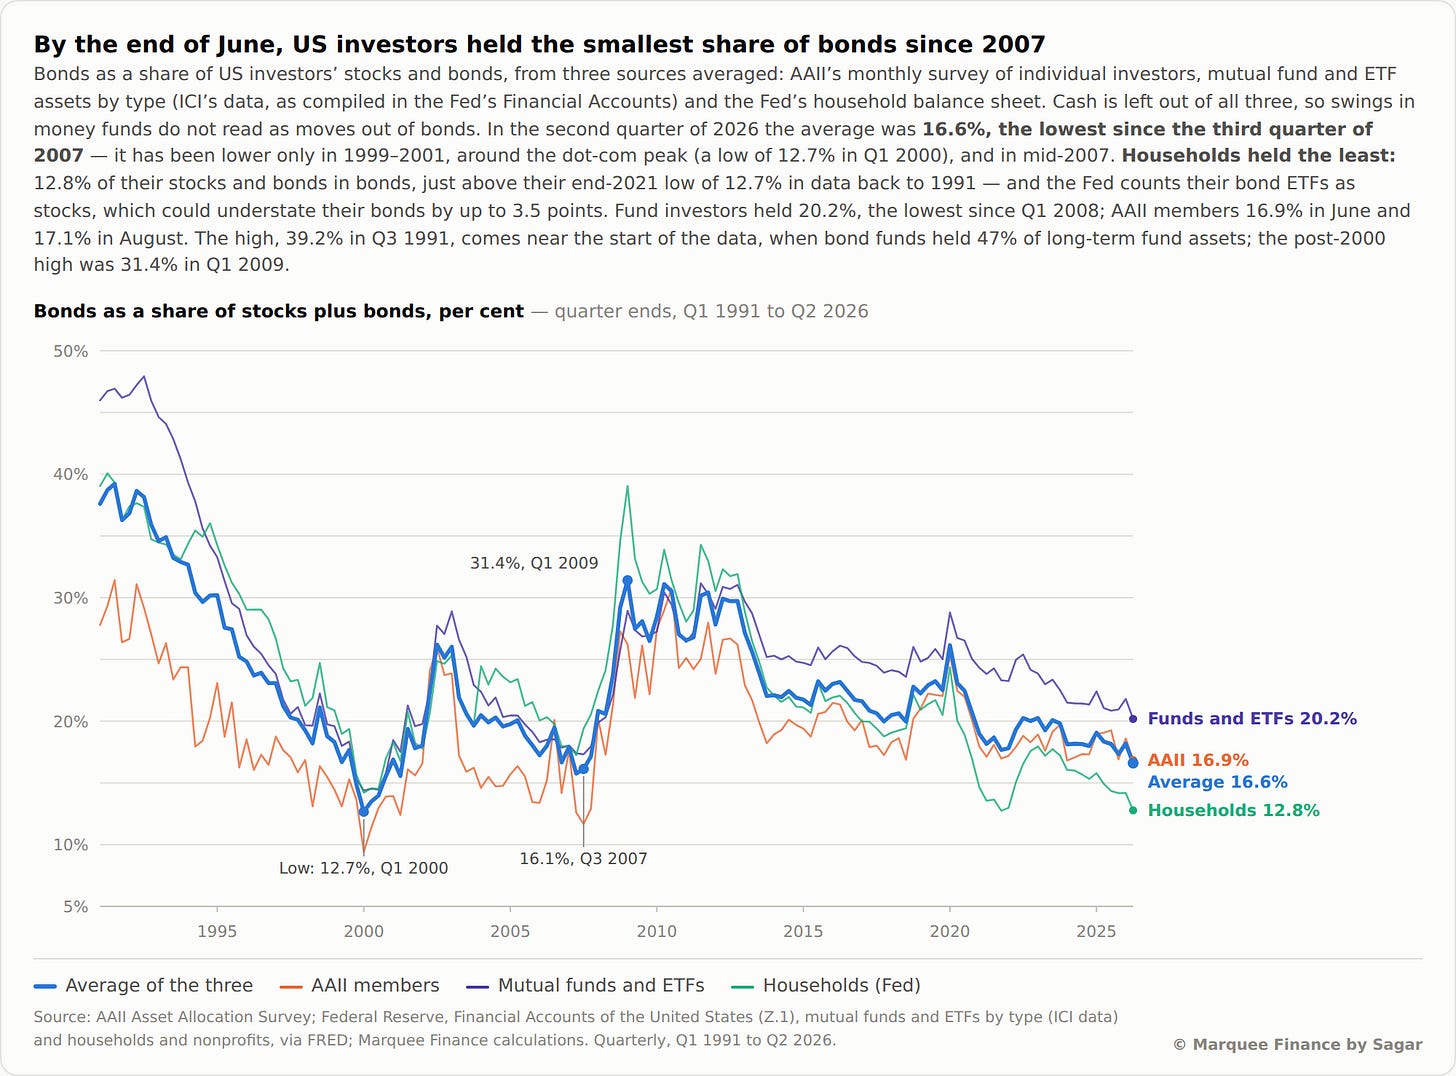
While speculators remain net short, ironically, long-term bonds remain the most hated asset class on earth.
Investor allocation to bonds has fallen significantly and is now down to16.6% (average).
HHs hold just 12.8% of their assets (stocks & bonds) in bonds, the lowest since 1991.
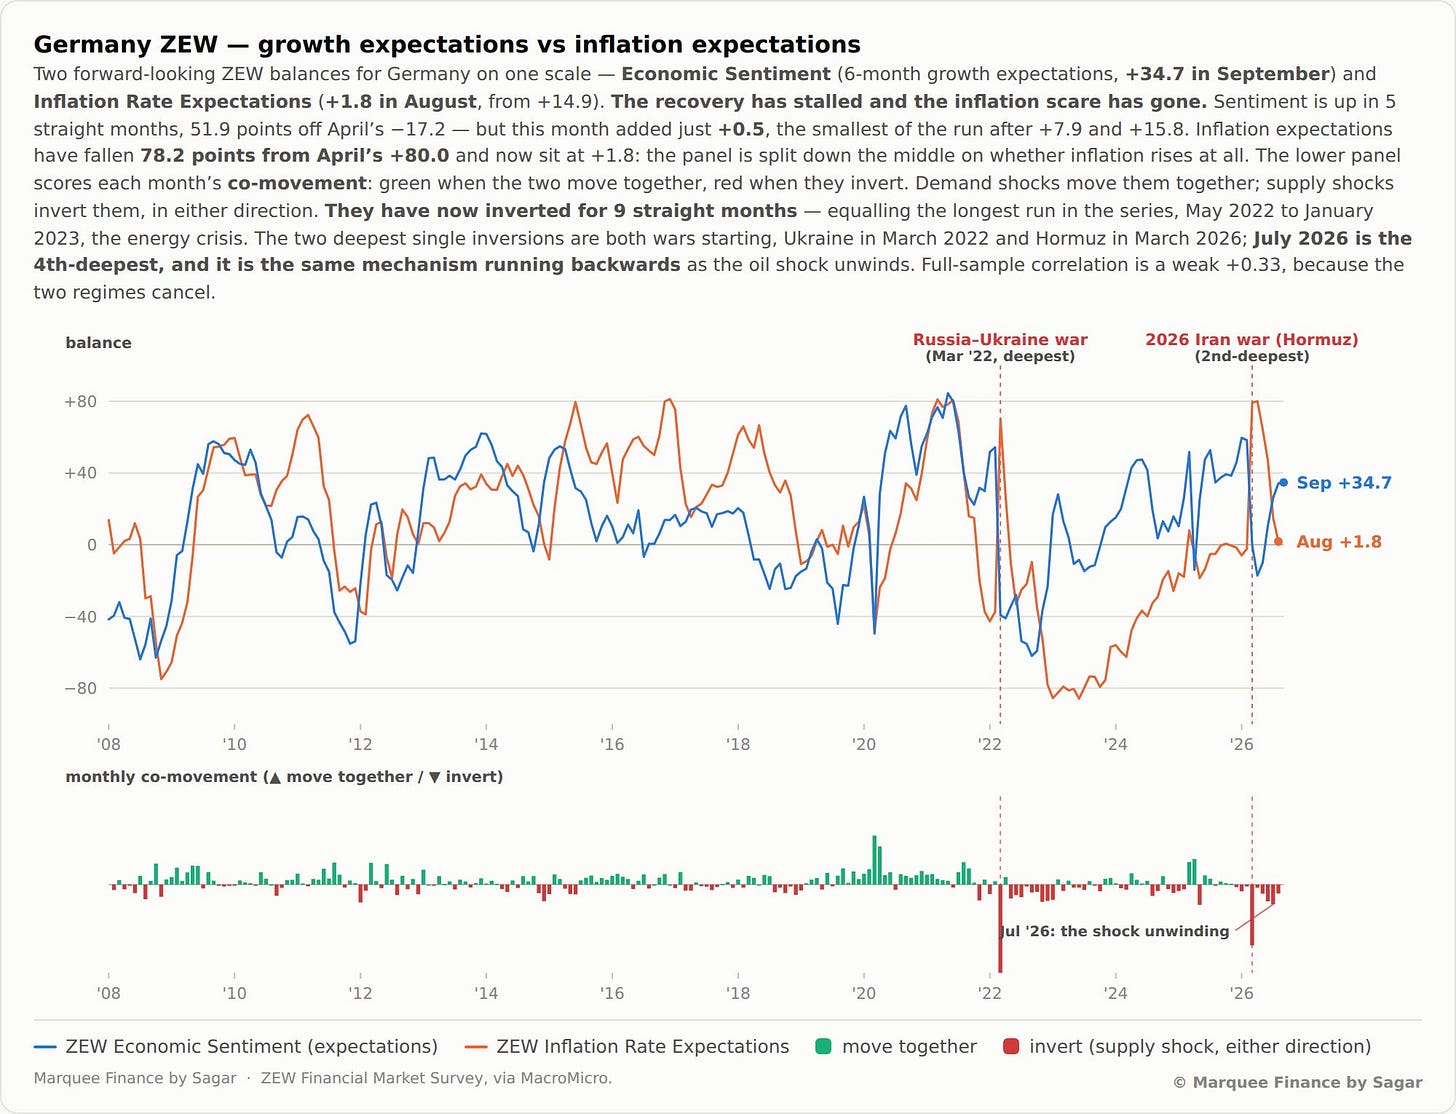
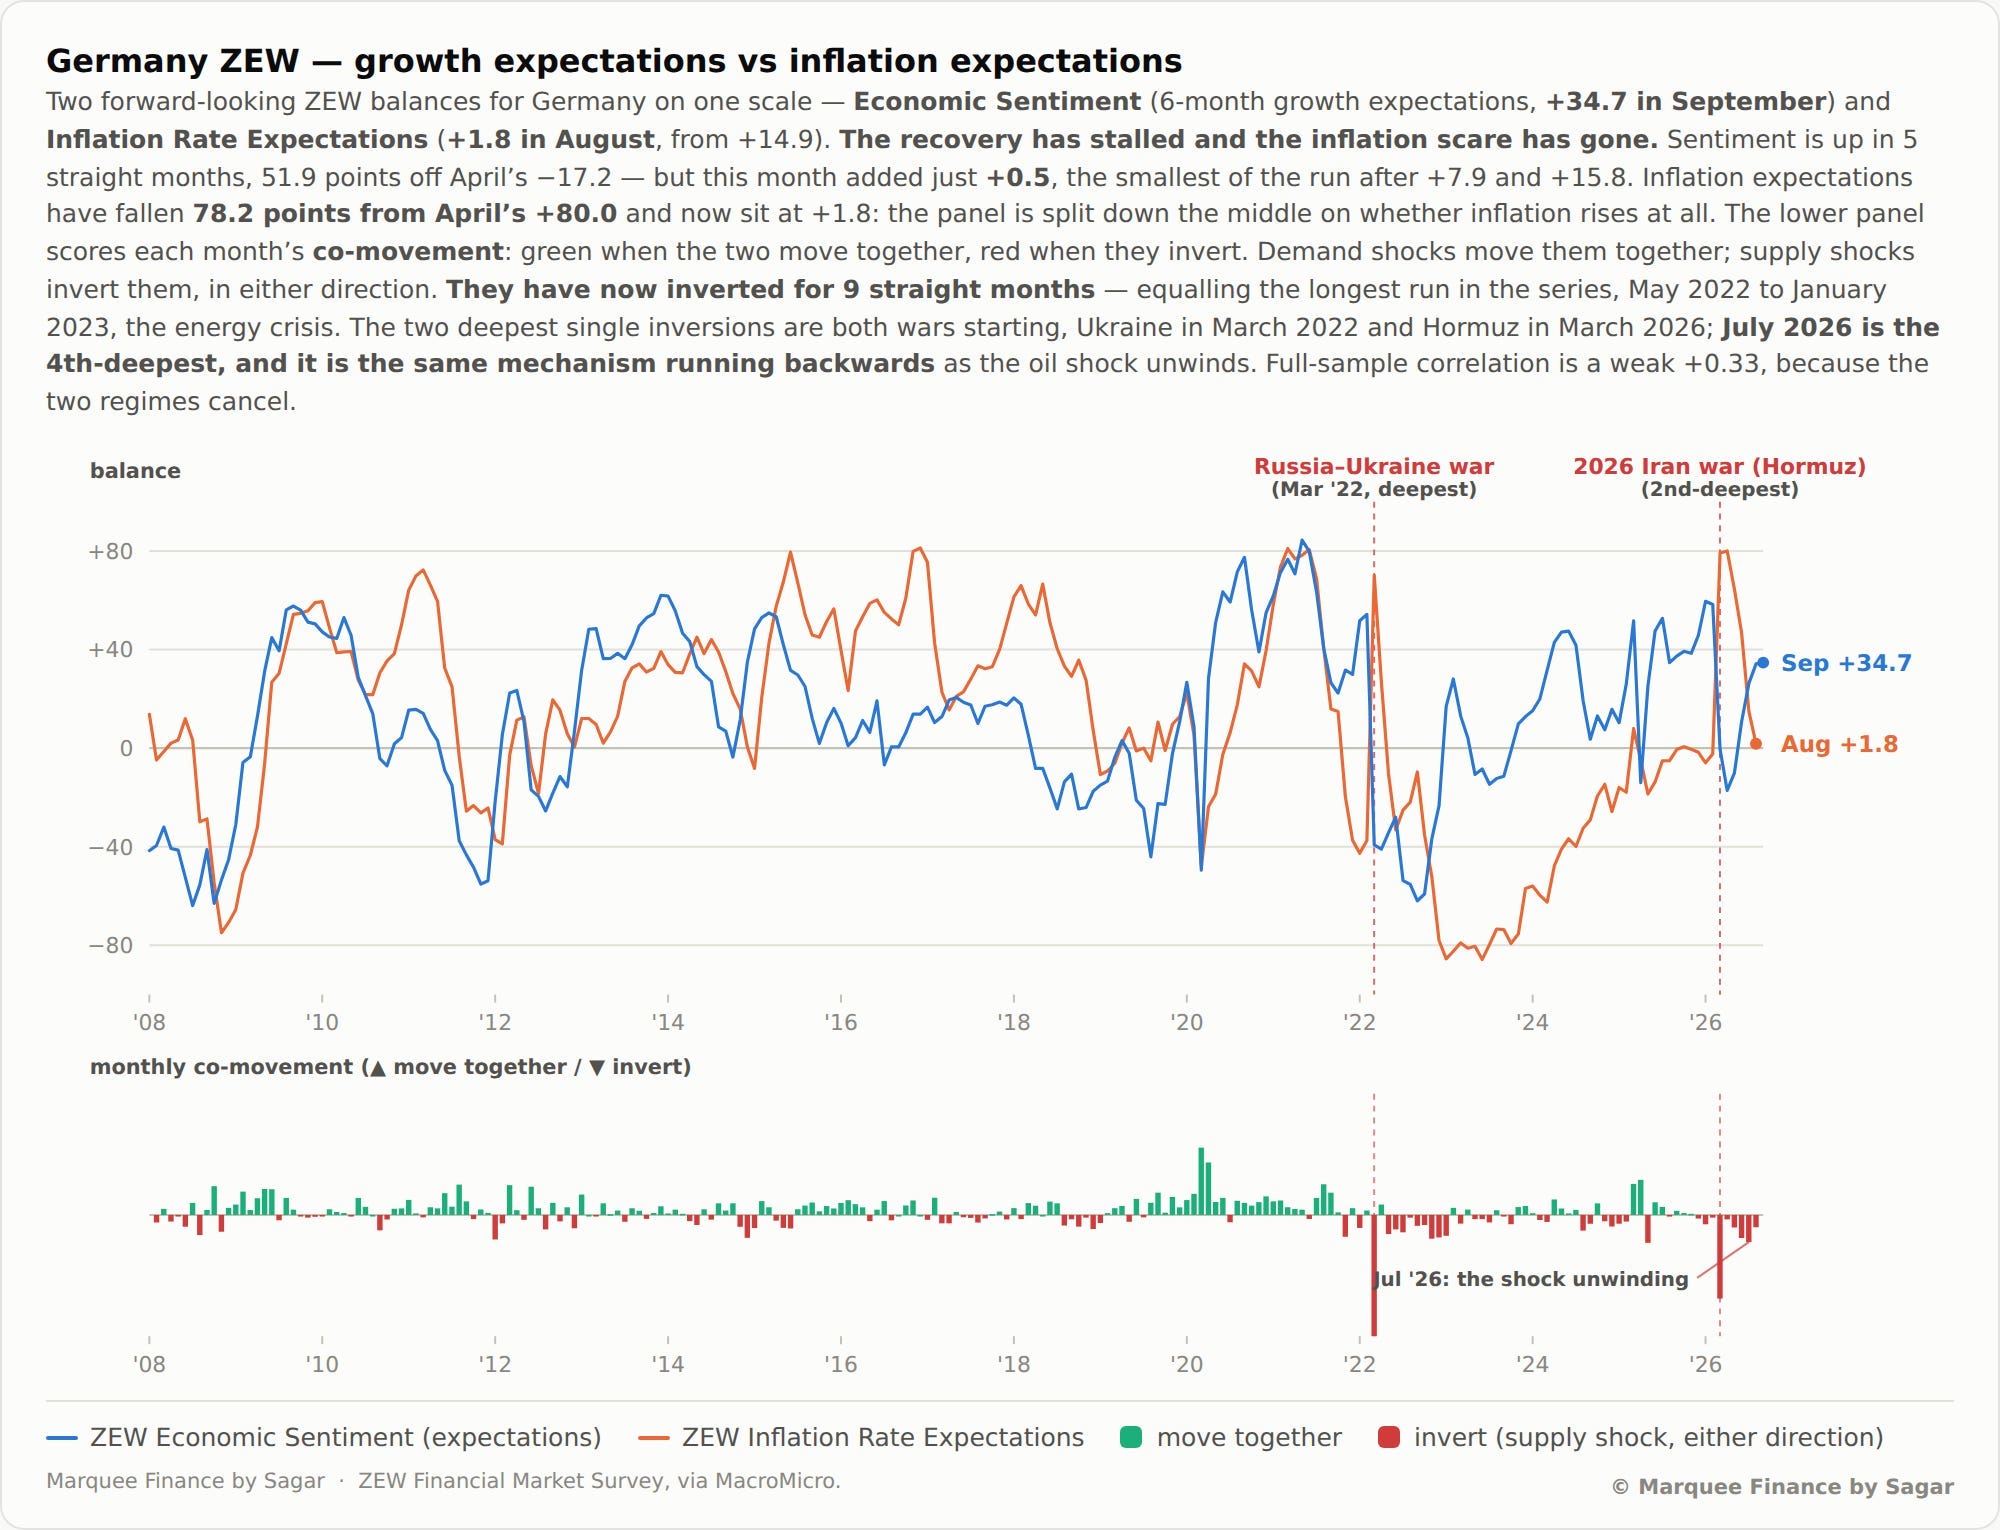
The sharp recovery we saw in Germany’s soft data is now on the verge of stalling as natural gas prices hit a record and the ECB raises rates to quell inflation.
ZEW Economic sentiment rose by just 0.5 points to 34.7.
We expect sentiment to worsen and inflation expectations to rise in the coming months.
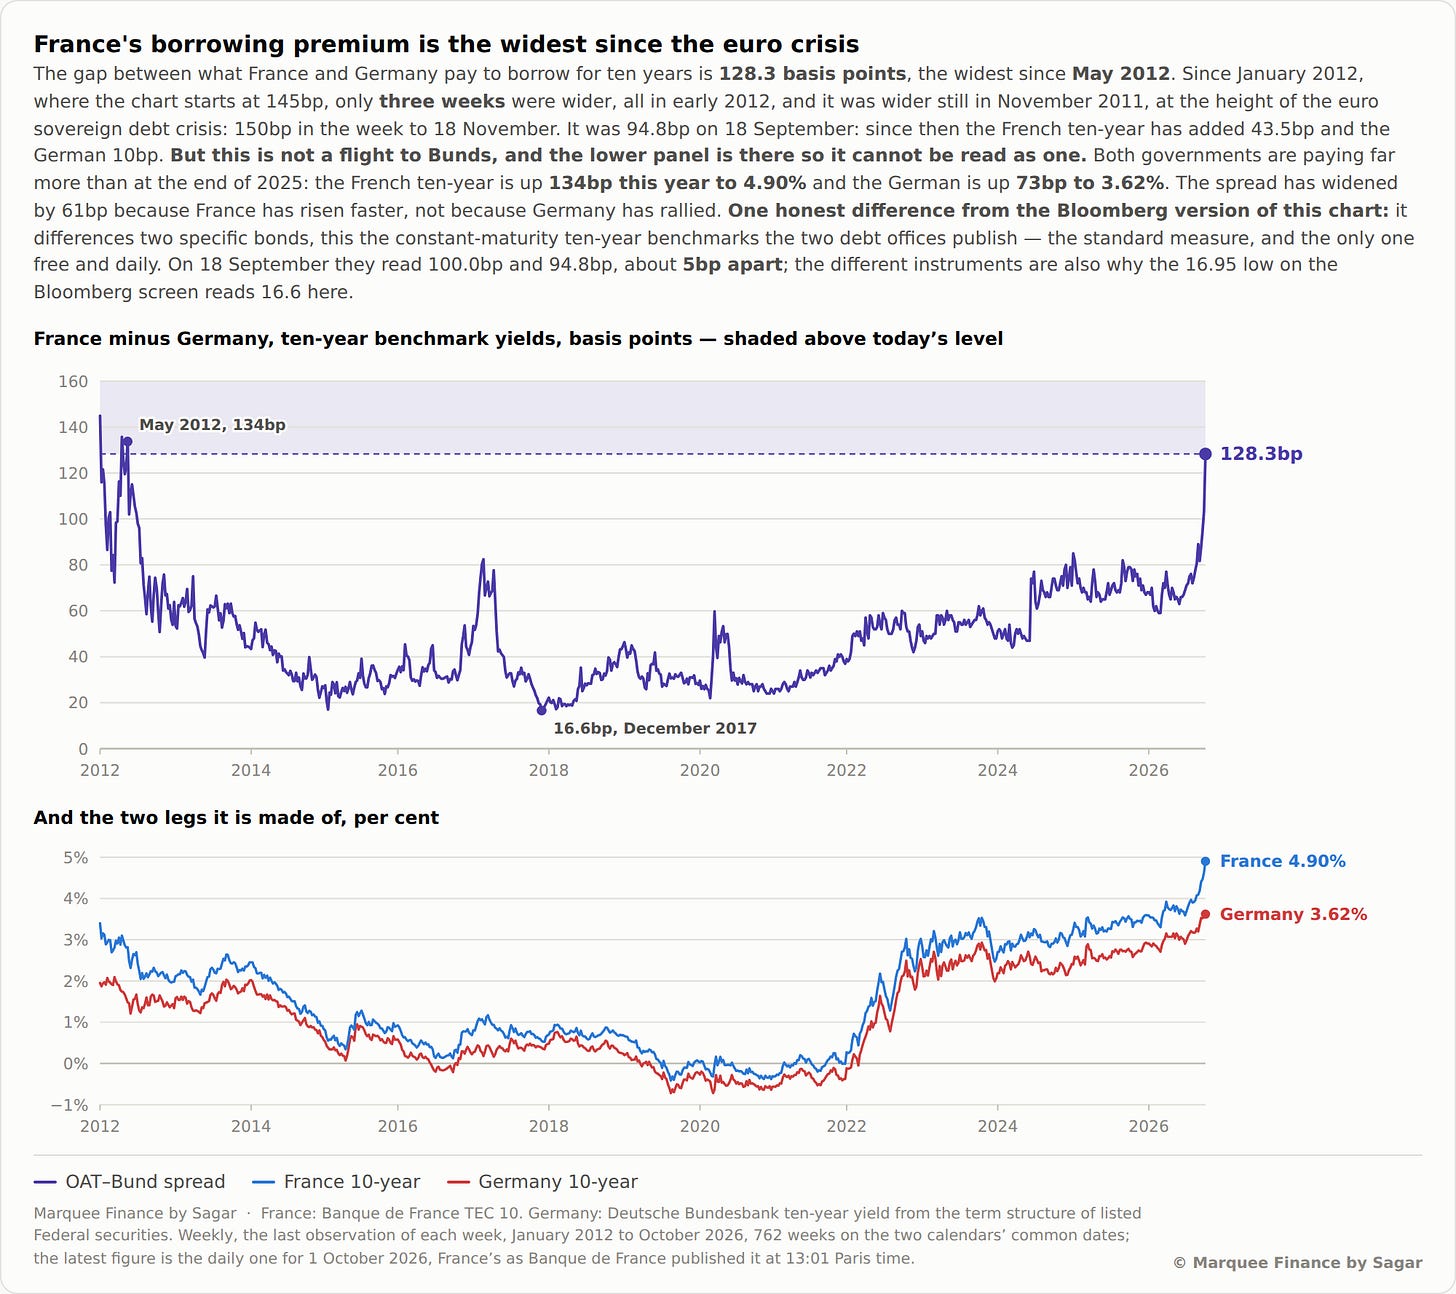
OAT-Bund spread has blown up as French elections loom in the next few months.
With Macron's approval rating at just 18% (lowest ever for a French President), the market fears a change of guard and a worsening fiscal position.
As a result, the spread is the highest since the 2012 Euro crisis, and French yields are higher than LVMH bonds.
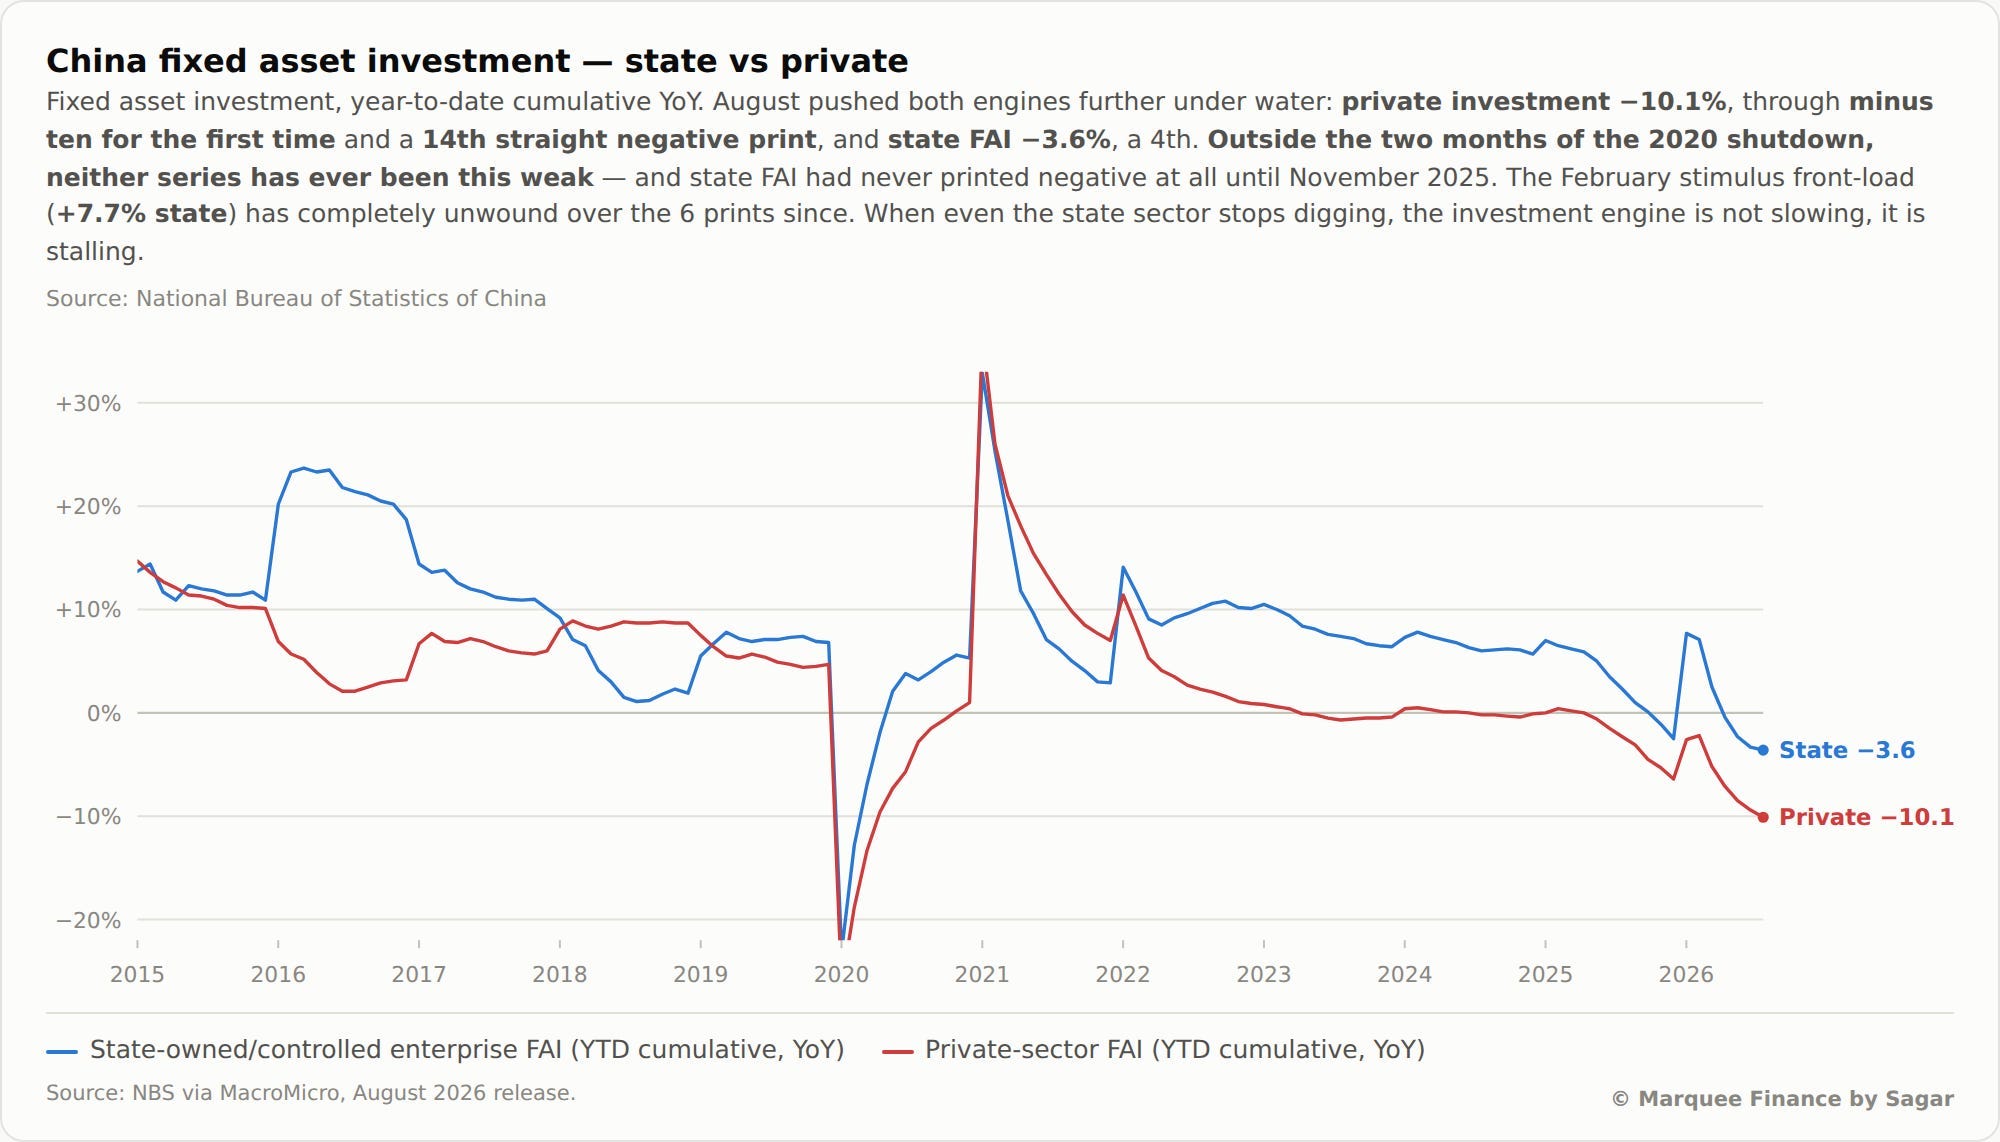
It’s a sordid state of affairs in China.
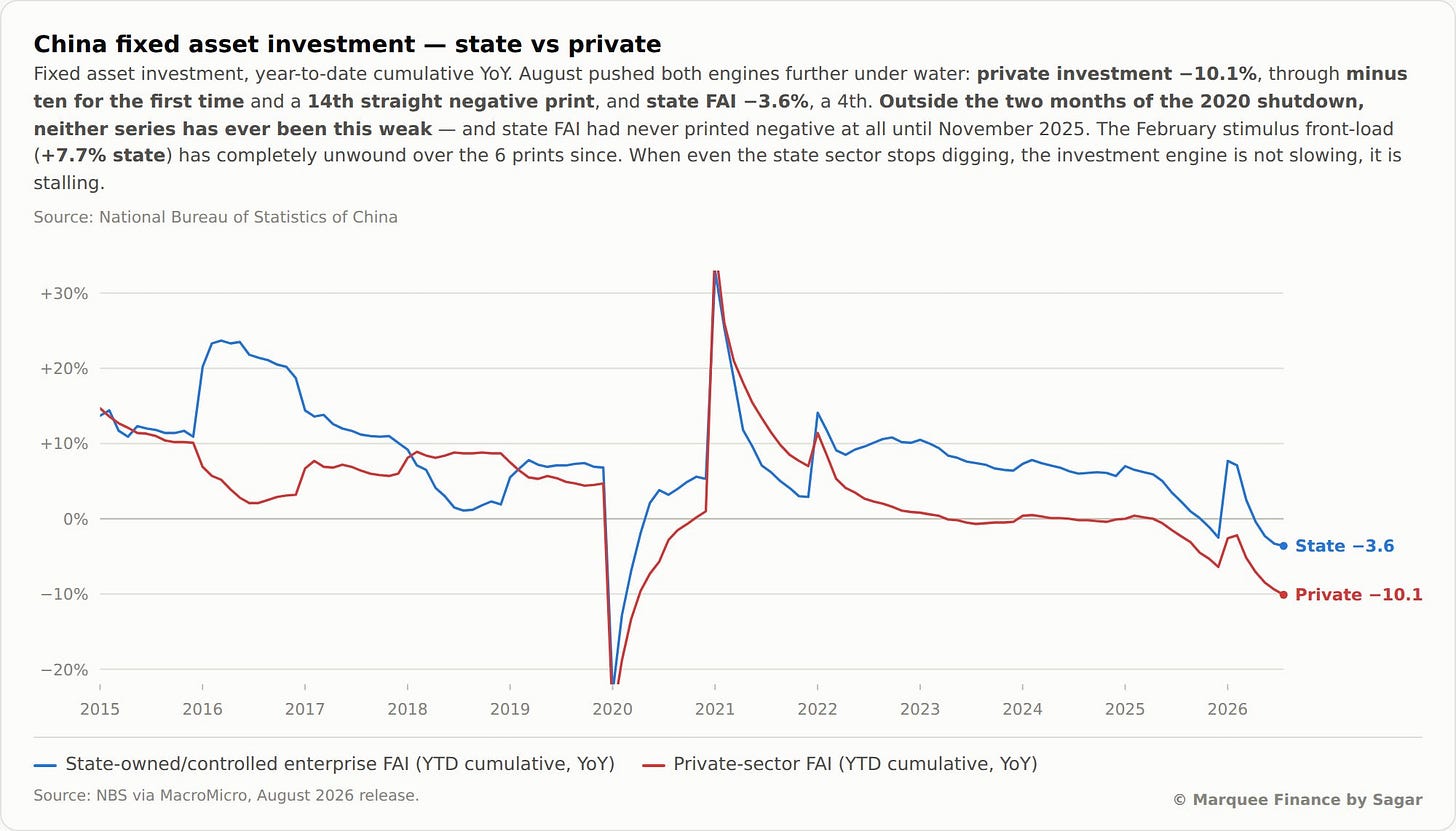
The Fixed Asset Investment (FAI) continues to plunge as the Chinese economy suffers from a balance sheet recession caused by the property bubble.
It was the 14th straight negative print for the private sector, and even State FAI continues to tumble, down 3.6% YoY (the longest consecutive negative streak outside of COVID).
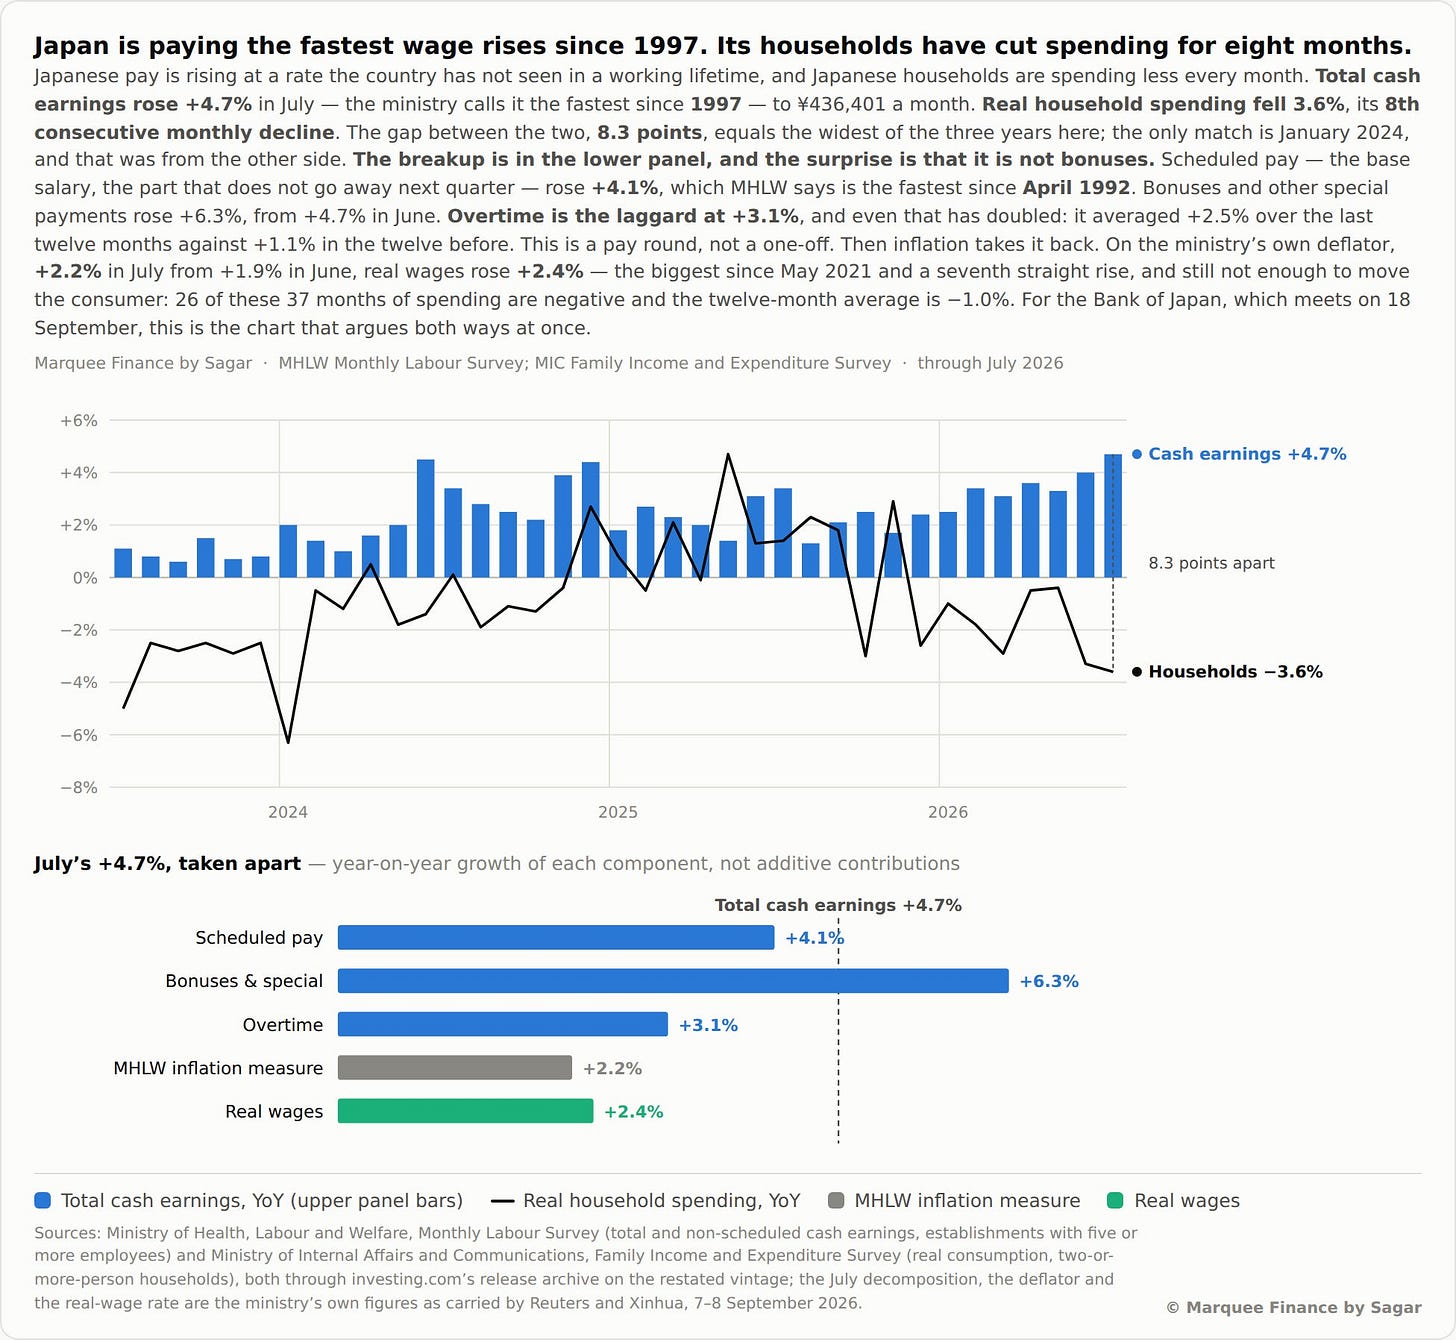
In the land of the rising sun, nominal wages have risen enormously from depressed pre-COVID levels.
Cash earnings grew by 4.7% YoY. Bonuses grew by a whopping 6.3%.
However, real wages (adjusted for inflation) rose by 2.4%, and household spending has moderated significantly.
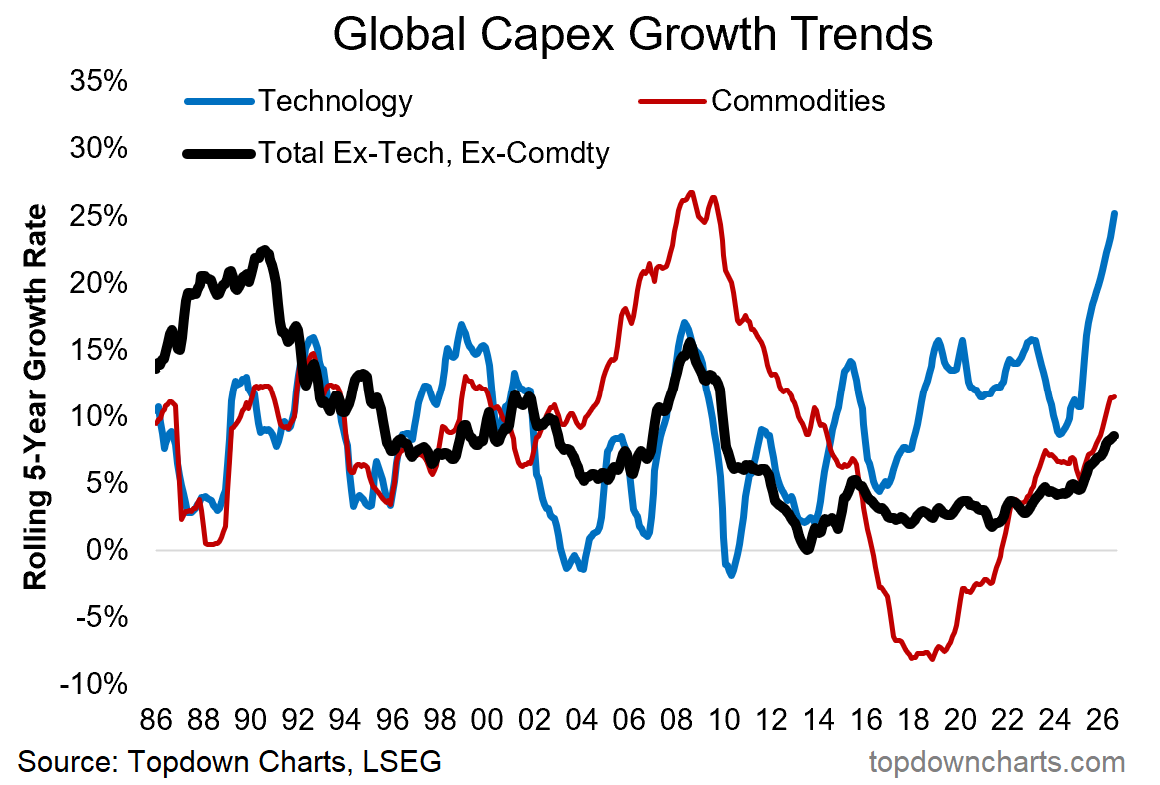
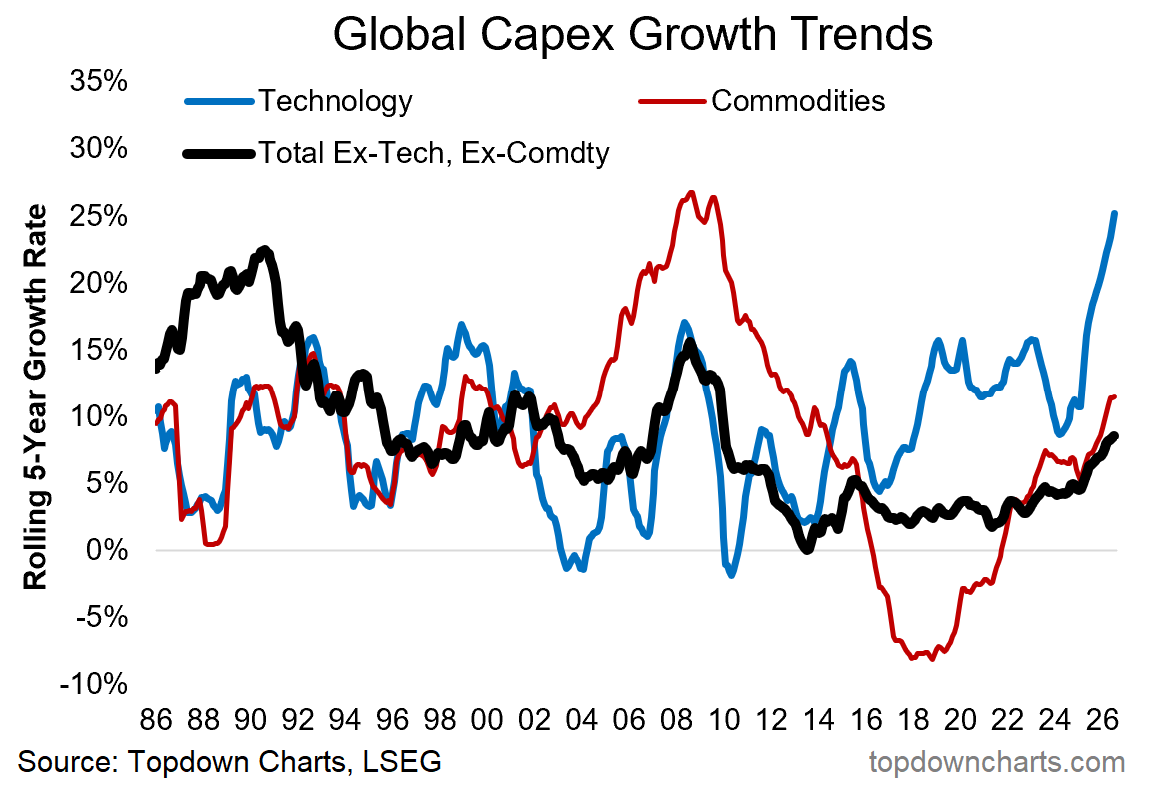
BONUS CHART: Led by the AI wave, global capex is witnessing unprecedented growth.
Trillions of dollars from hyperscalers and Chinese AI companies have driven 25% rolling 5-year growth in tech capex.
Furthermore, demand for commodities (copper/gold, etc.) and rising oil prices have led to a decadal high in commodity capex growth.
Disclaimer
This publication and its author are not licensed investment professionals. The author & any other individuals associated with this newsletter are NOT registered as Securities broker-dealers or financial investment advisors with the U.S. Securities and Exchange Commission, Commodity Futures Trading Commission, or any other securities/regulatory authority. Nothing produced under Marquee Finance by Sagar should be construed as investment advice. Do your research and consult with your certified financial planner or other dedicated professional before making any investment decisions. Investments carry risk and may lose value; Marquee Finance By Sagar LLC, Marqueefinancebysagar.substack.com or Sagar Singh Setia is not responsible for loss of value; all investment decisions you make are yours alone.