No End In Sight!

We are witnessing historic moves in the oil market as the spread between the physical and paper markets hits a record high.
The Dated Brent (physical) traded at $142 yesterday, its highest levels since the 2008 oil price spike.
As a result, the spread between Dated Brent/Frontline Brent Futures reached an all-time high of $24.
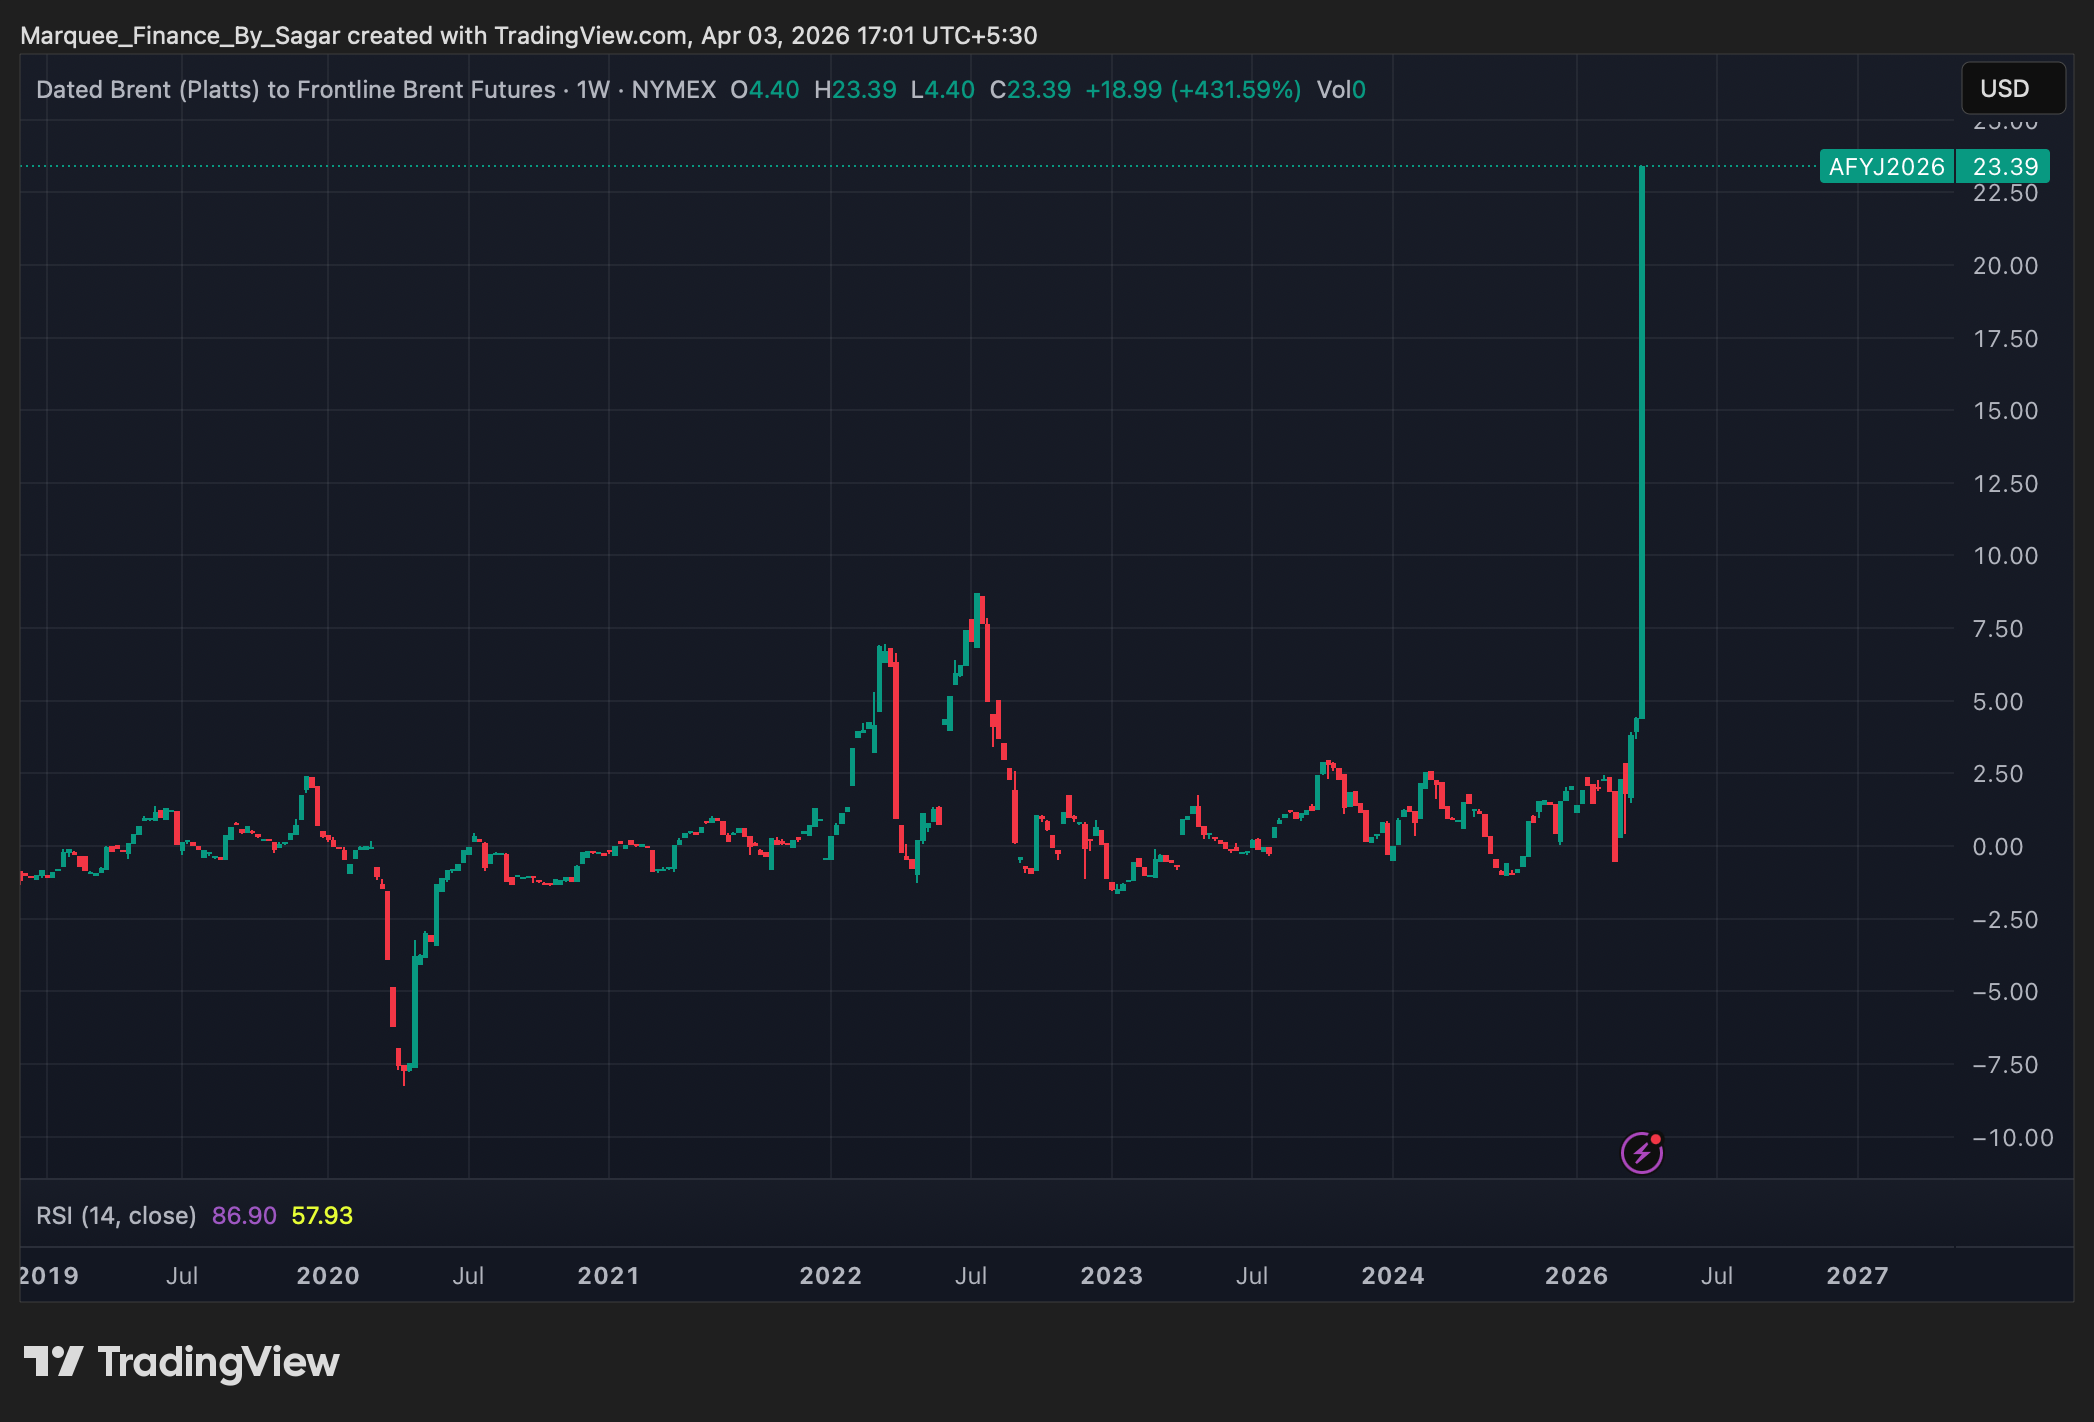
There is absolute panic in the oil markets, with a mad scramble by refiners to purchase every available physical barrel.
For those who aren’t aware of the supply-and-demand scenario in the oil markets, pre-war, supply, including all sanctioned oil, was around 109 mbpd, while demand was 103/4 mbpd, indicating a surplus of 5 mbpd. However, with the production shut-ins of around 10 mbpd post-war, we are in a deficit, with demand far outstripping supply.
Thus, unless demand destruction transpires or the Strait of Hormuz (SOH) reopens, expect the physical market tightness to persist.
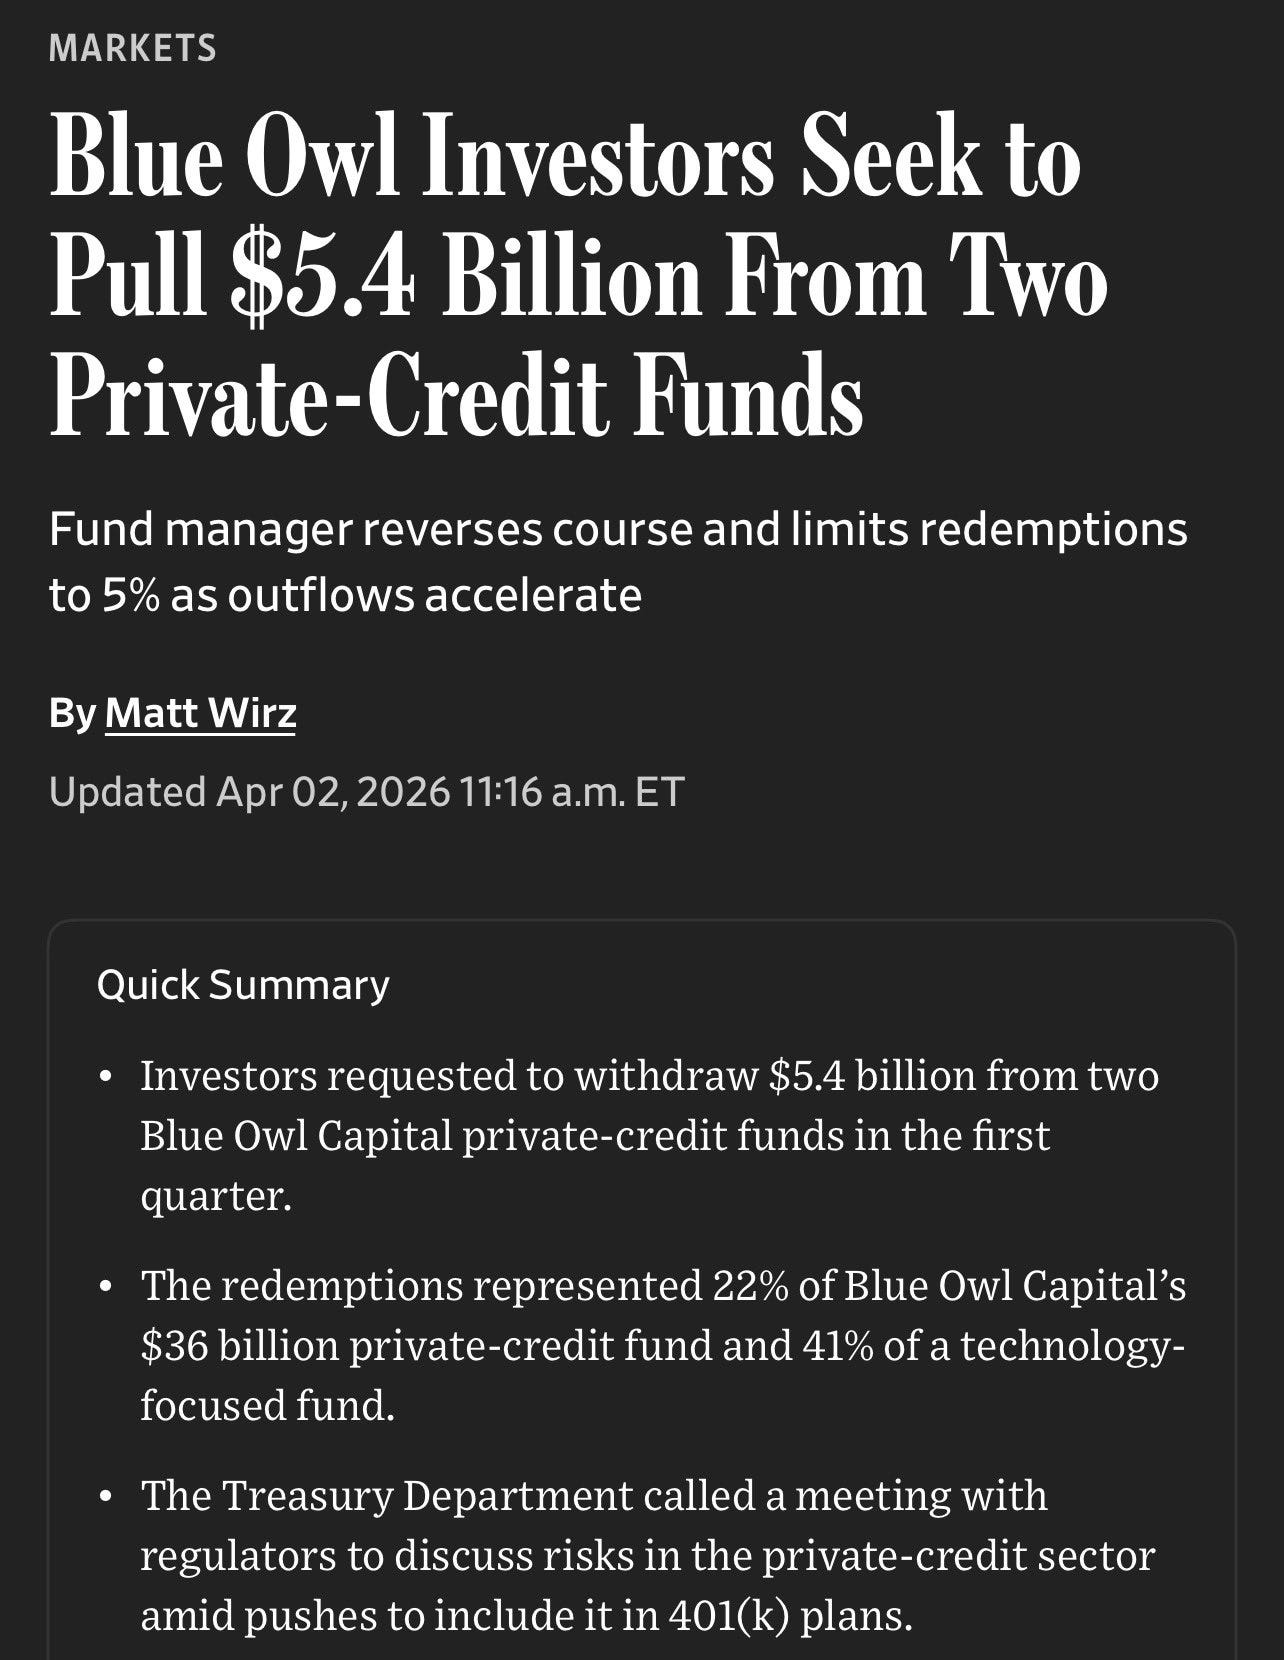
On the other hand, we got a shocker in the private credit space as redemptions reached a mind boggling 22% of one of Blue Owl’s funds, demonstrating that the “music might have stopped playing”.
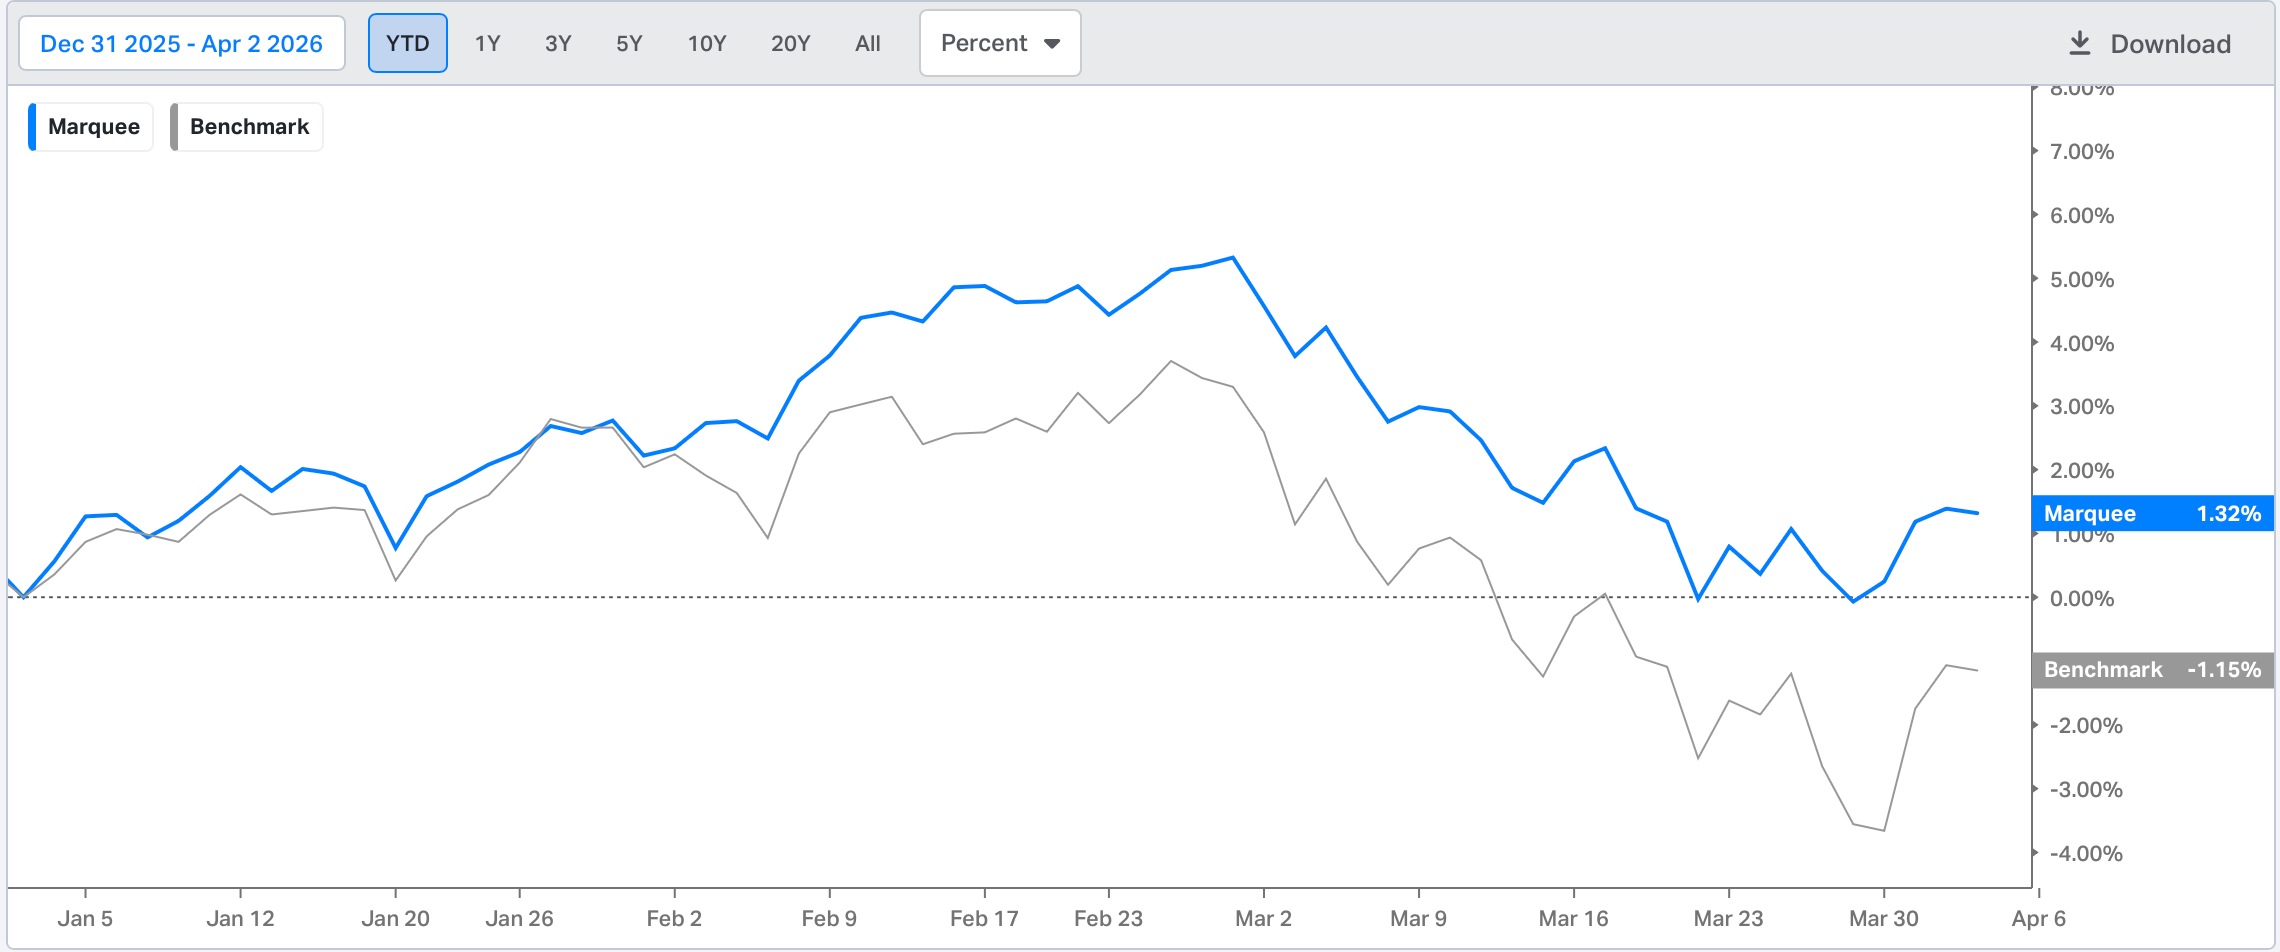
As we navigate turbulent times in the financial markets, we continue to outperform our benchmark, with a YTD return of 1.32% versus -1.15%.
Today, we examine the probable timeline of the Middle East conflict and delve into the macro universe to understand the cross-asset implications.
US/Equities/Bonds/Oil/Dollar/Gold/Silver!
We received a whole host of macro data this week.
We begin with retail sales, one of the most crucial metrics for tracking household spending amid multi-year high gas prices.
Note that we got February retail sales data, and since the war began on 28th February, we won’t know the effect of higher gas prices yet.
It was an all-around beat:
Headline Retail sales at 0.6% v/s Exp. 0.5%.
Retail sales ex auto at 0.5% v/s Exp. 0.3%.
Control Group at 0.5% v/s Exp. 0.3%.
Some of the categories (sporting goods, clothing), including online, saw a massive YoY surge in sales.
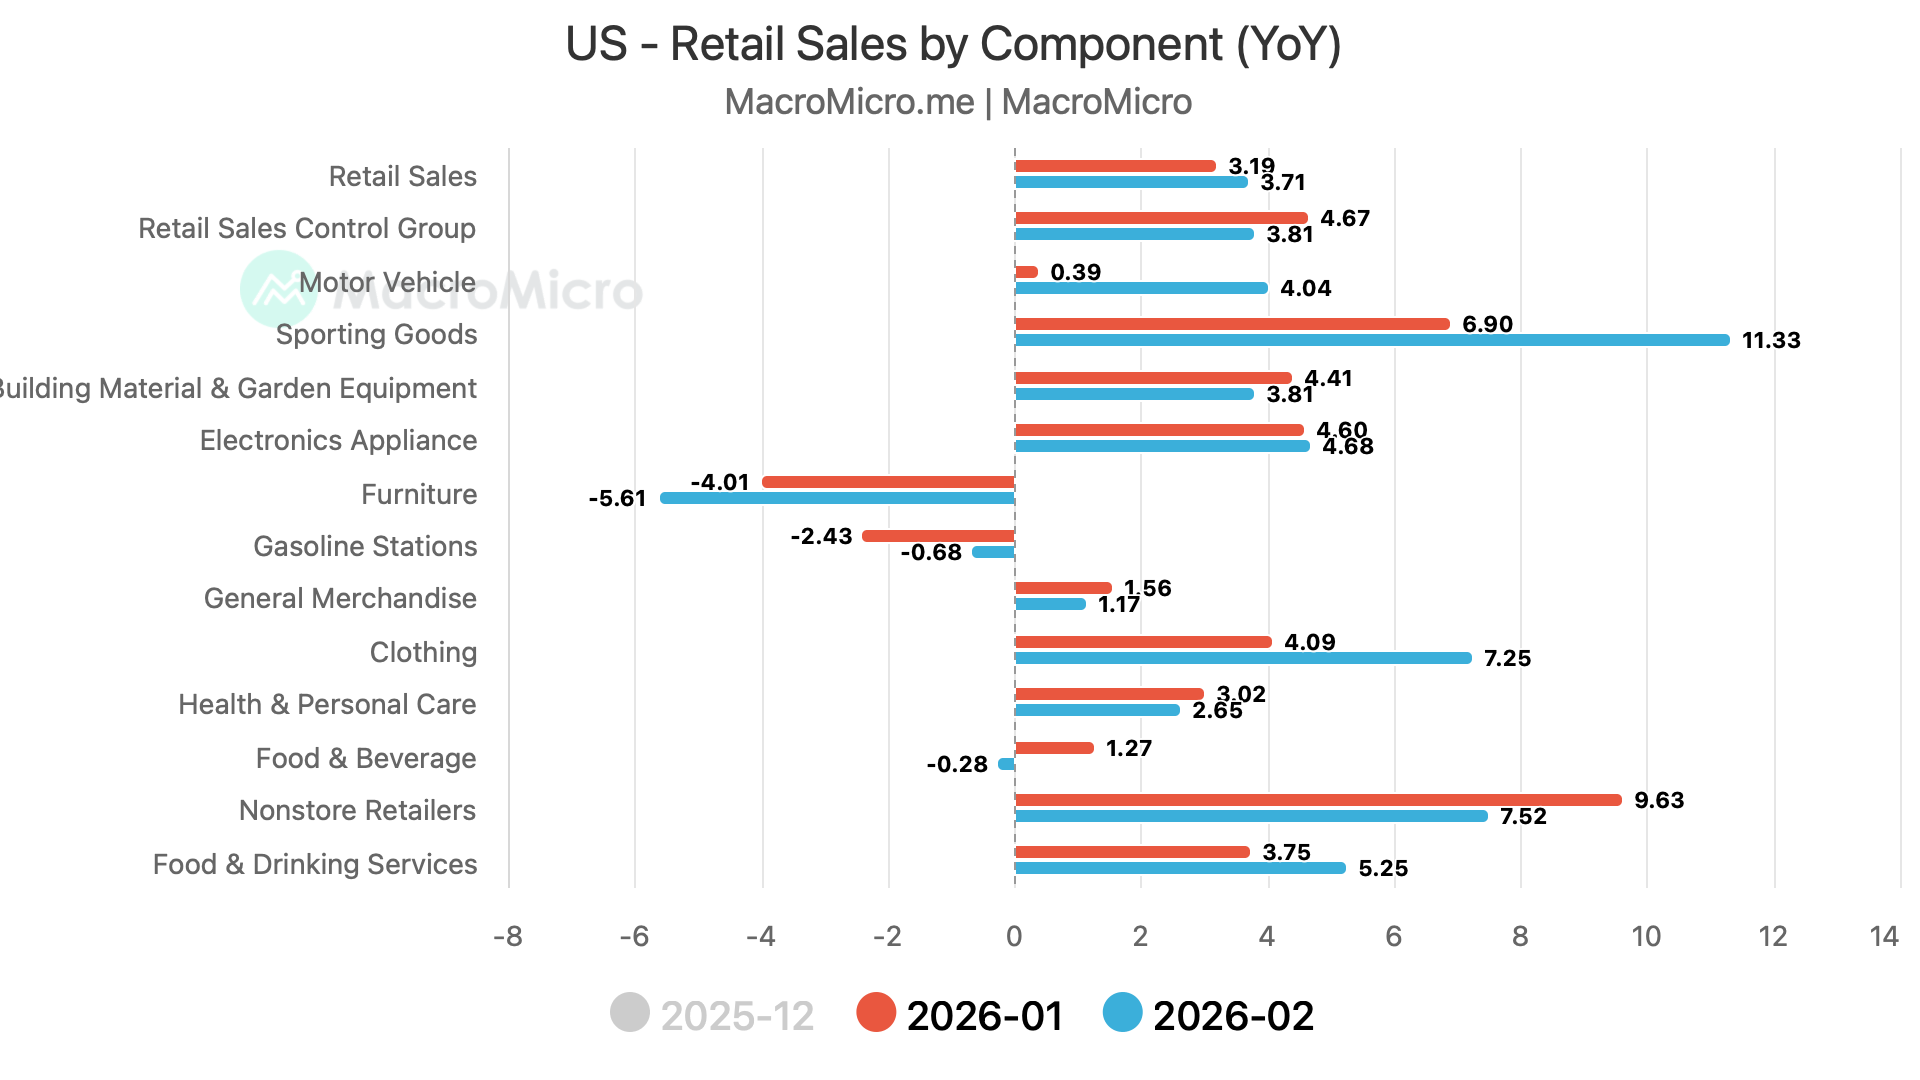
Note that these are also the categories in which prices were significantly higher due to tariffs (and thus nominal retail sales were higher for these categories).
Note that over the six months ending in February, control retail sales and food services are up just 2.1% on an annualised basis.
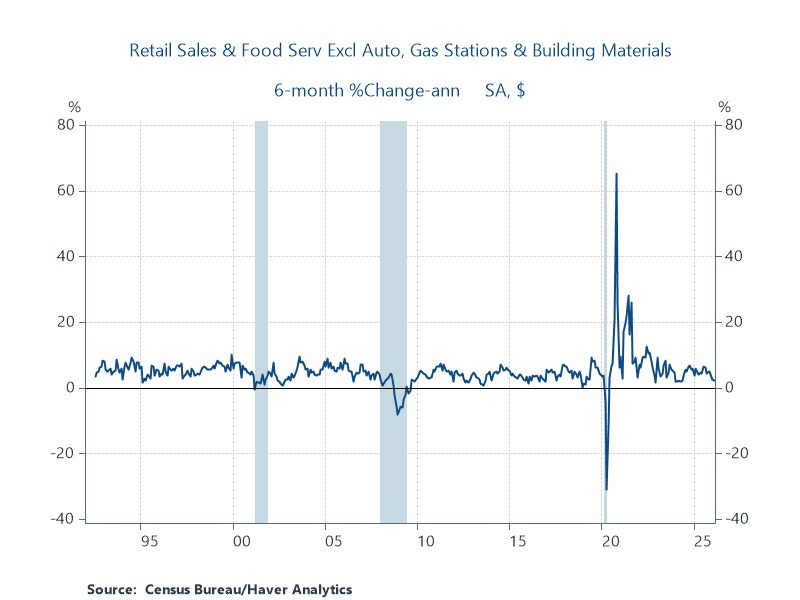
With inflation running at 3%, the real retail sales (adjusted for inflation) have been subdued.
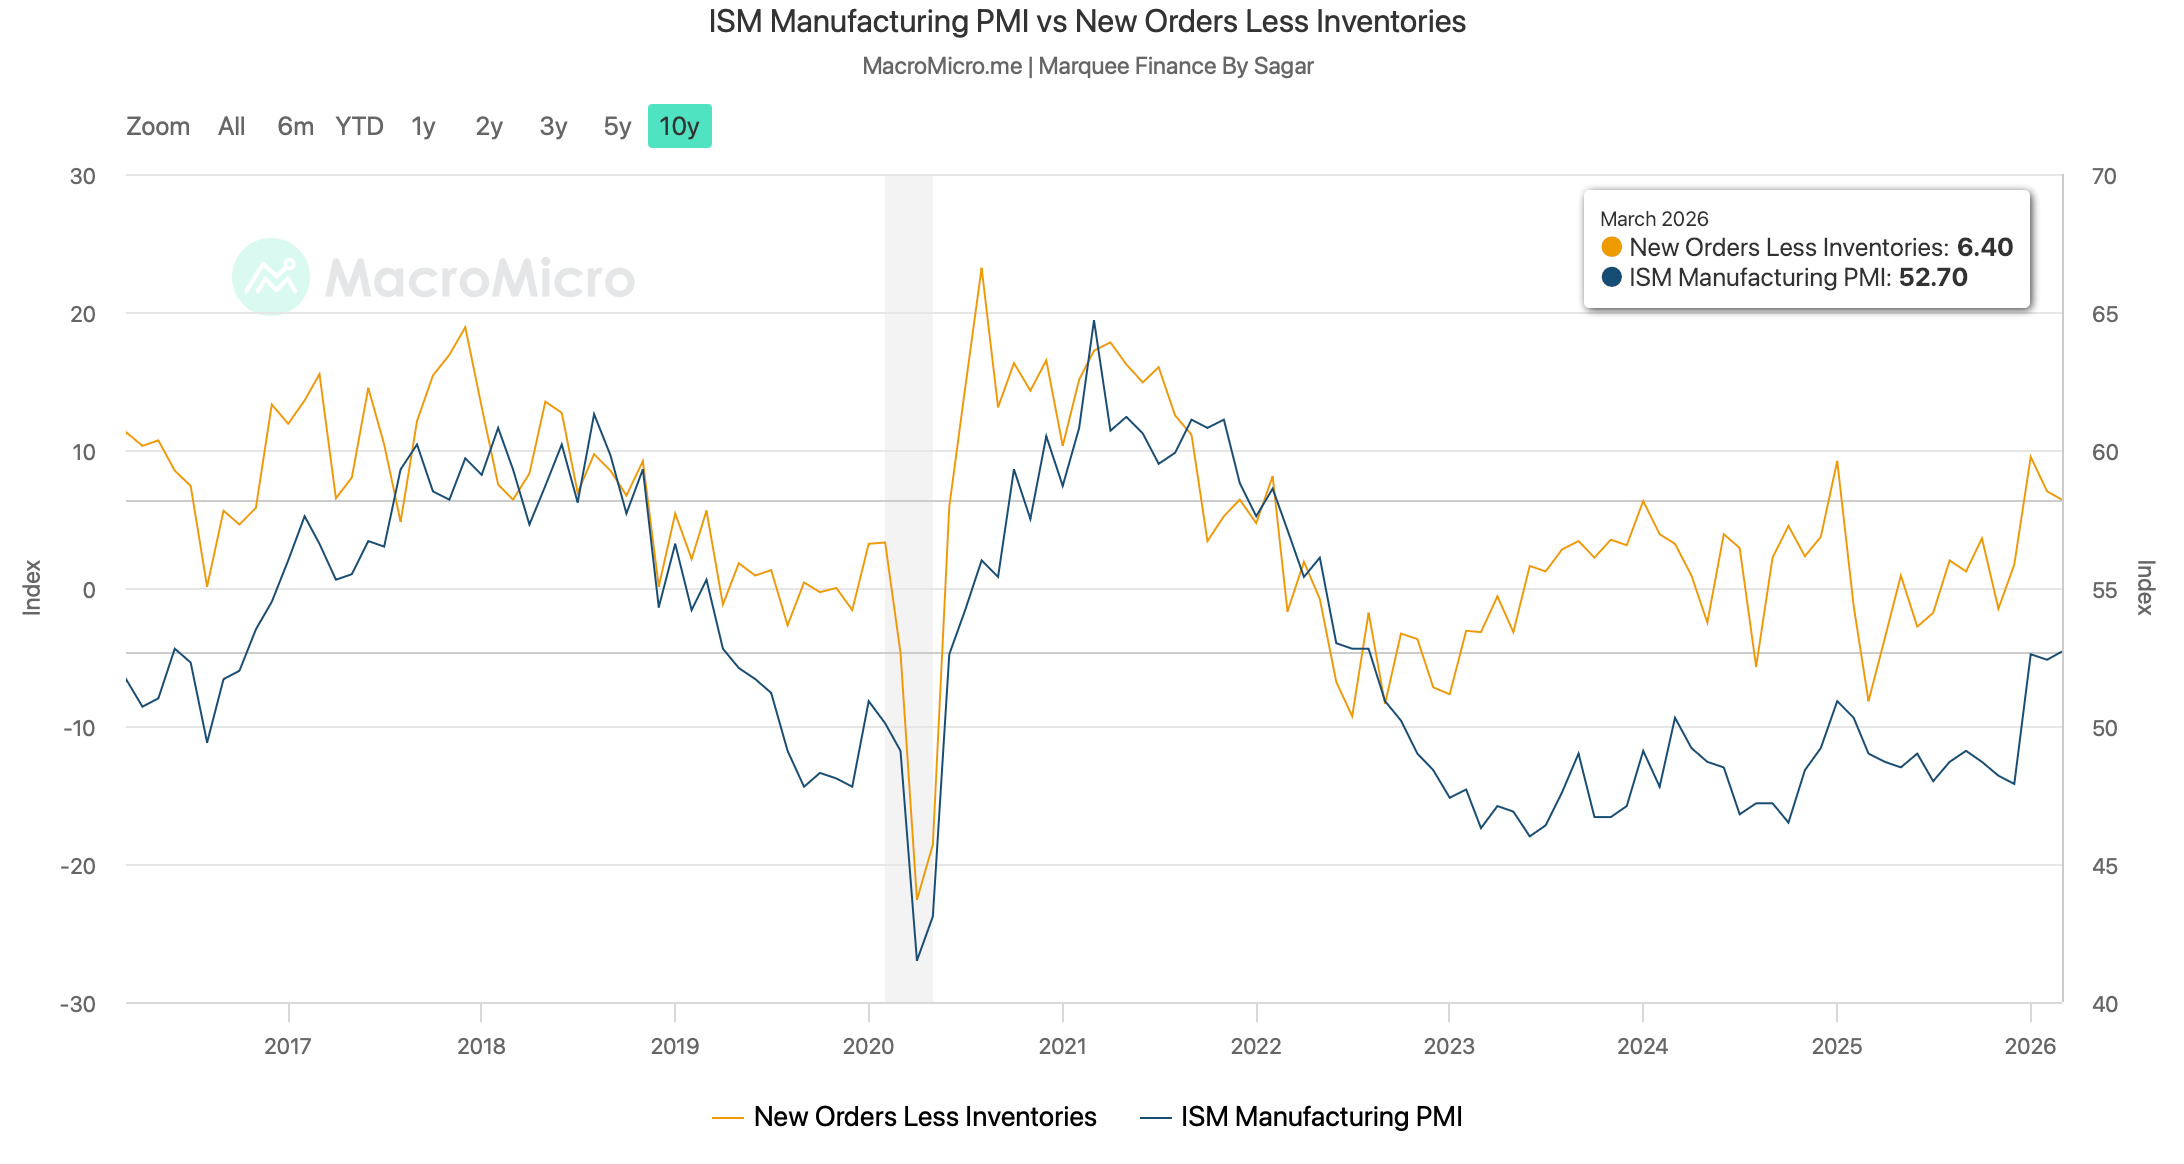
ISM Manufacturing came in at 52.4 v/s expected 51.5.
However, the surprise was the blowout Prices Paid, which came in at 78.3, the highest since June 2022.
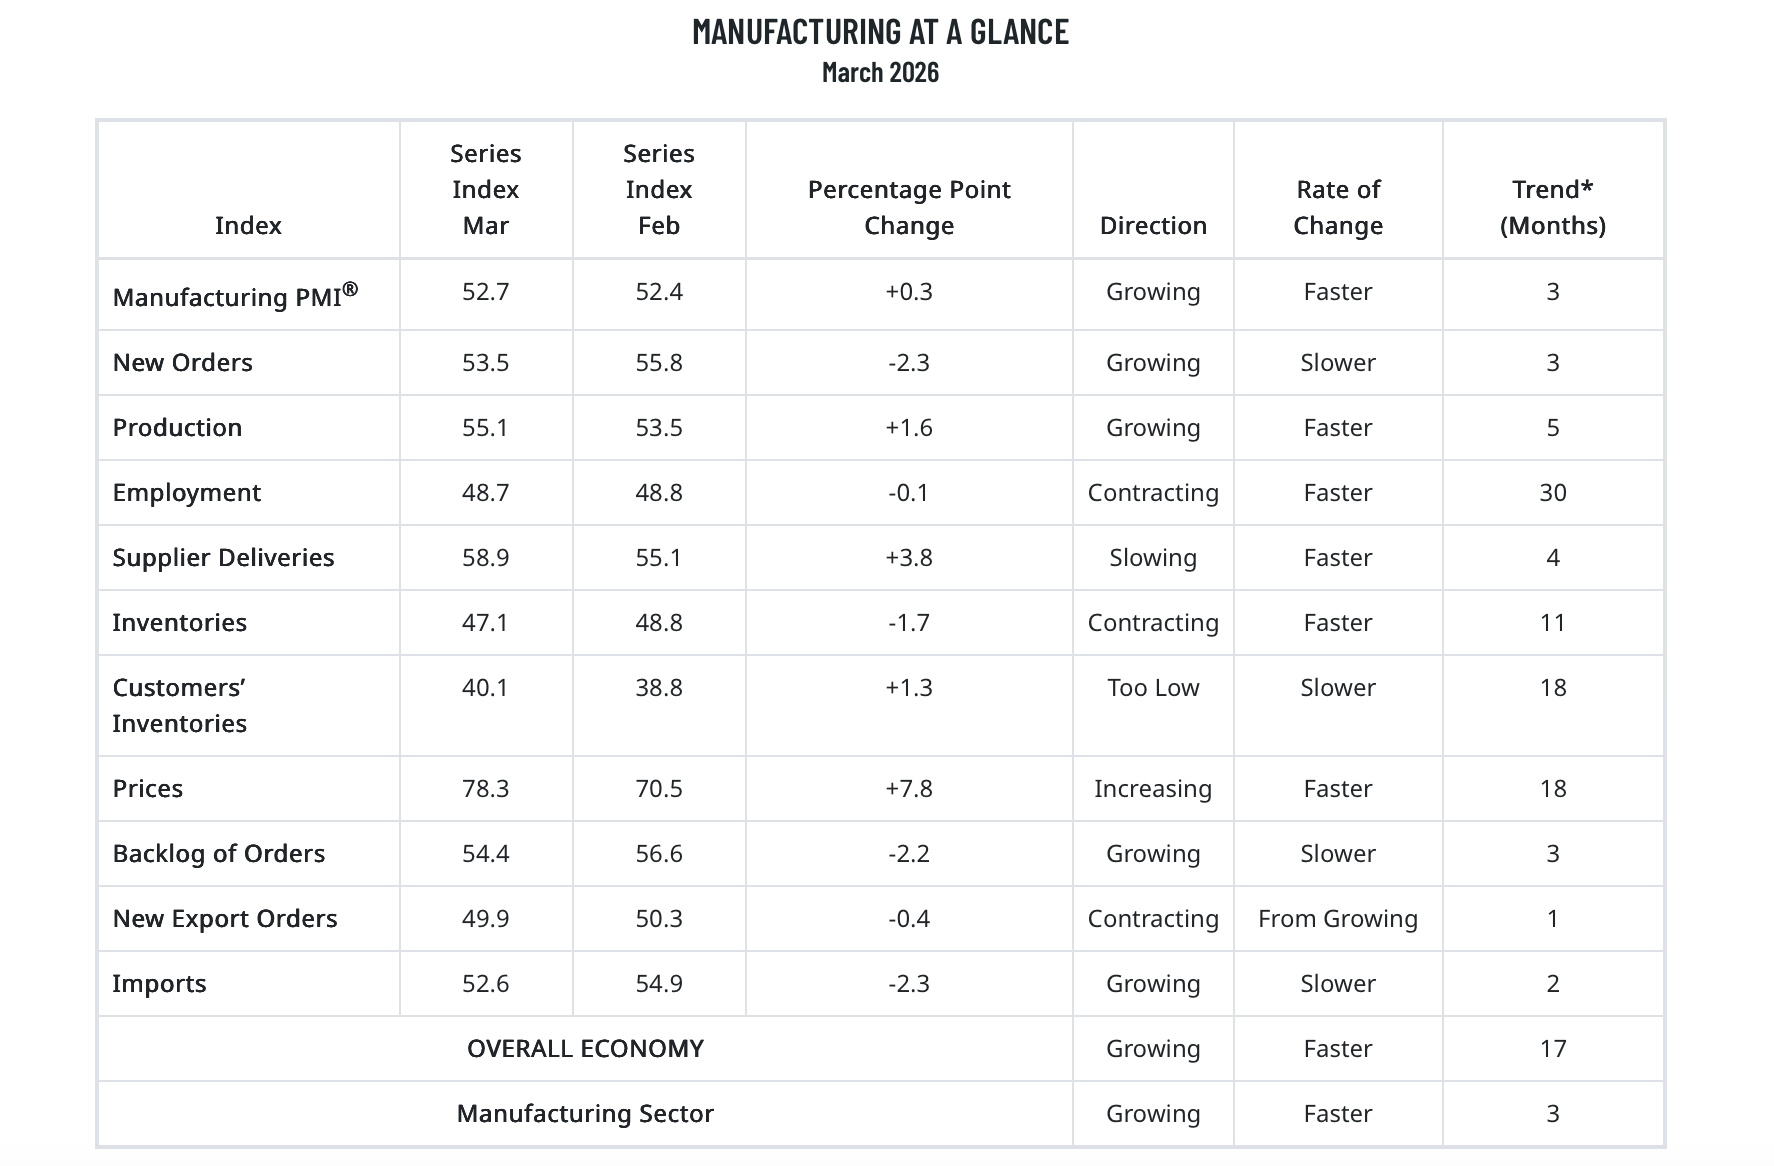
Note that although the employment PMI has risen from its lows, it remains below 50, indicating contraction.
Our favourite indicator, New Orders Less Inventories, moved slightly lower from the highs. However, there are no danger signs yet.
Now let’s turn our attention to the labour market:
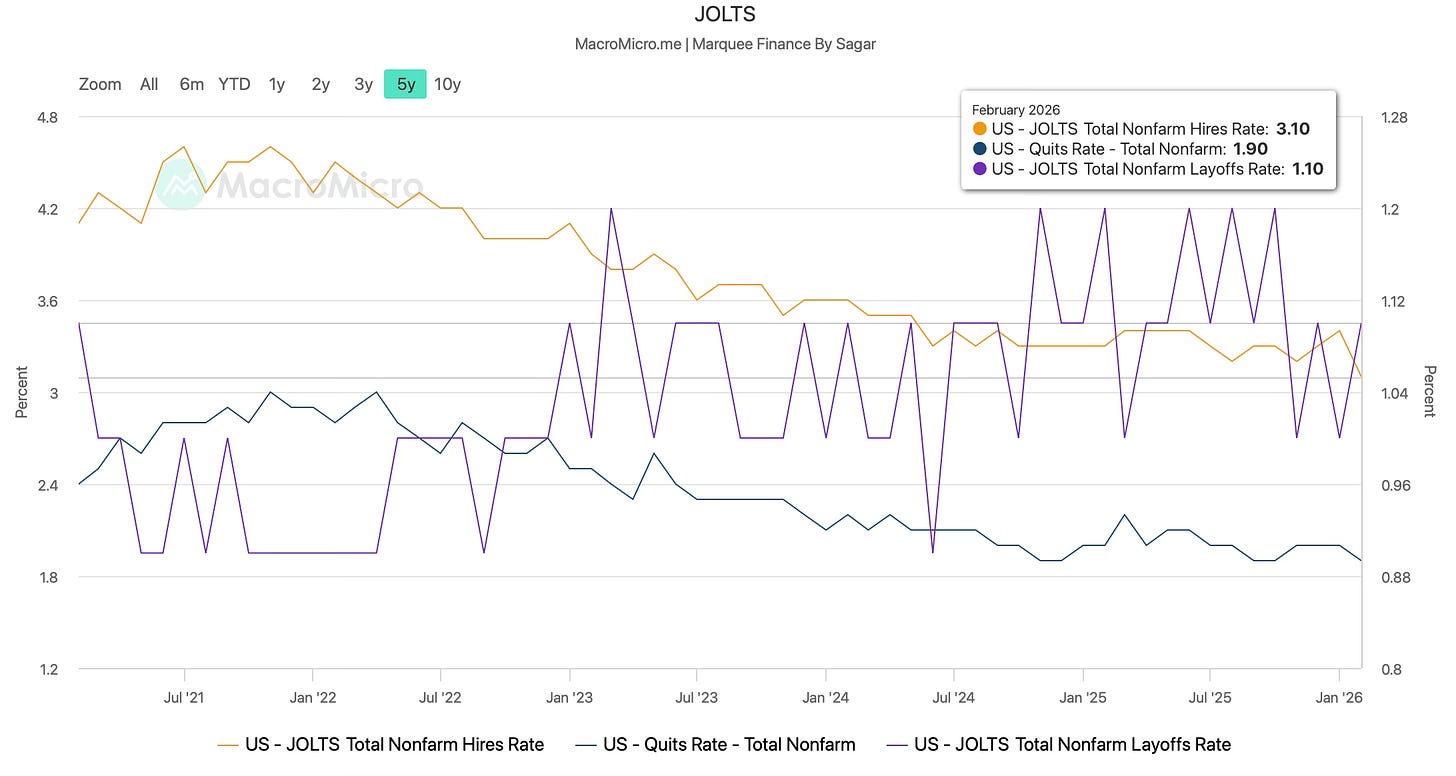
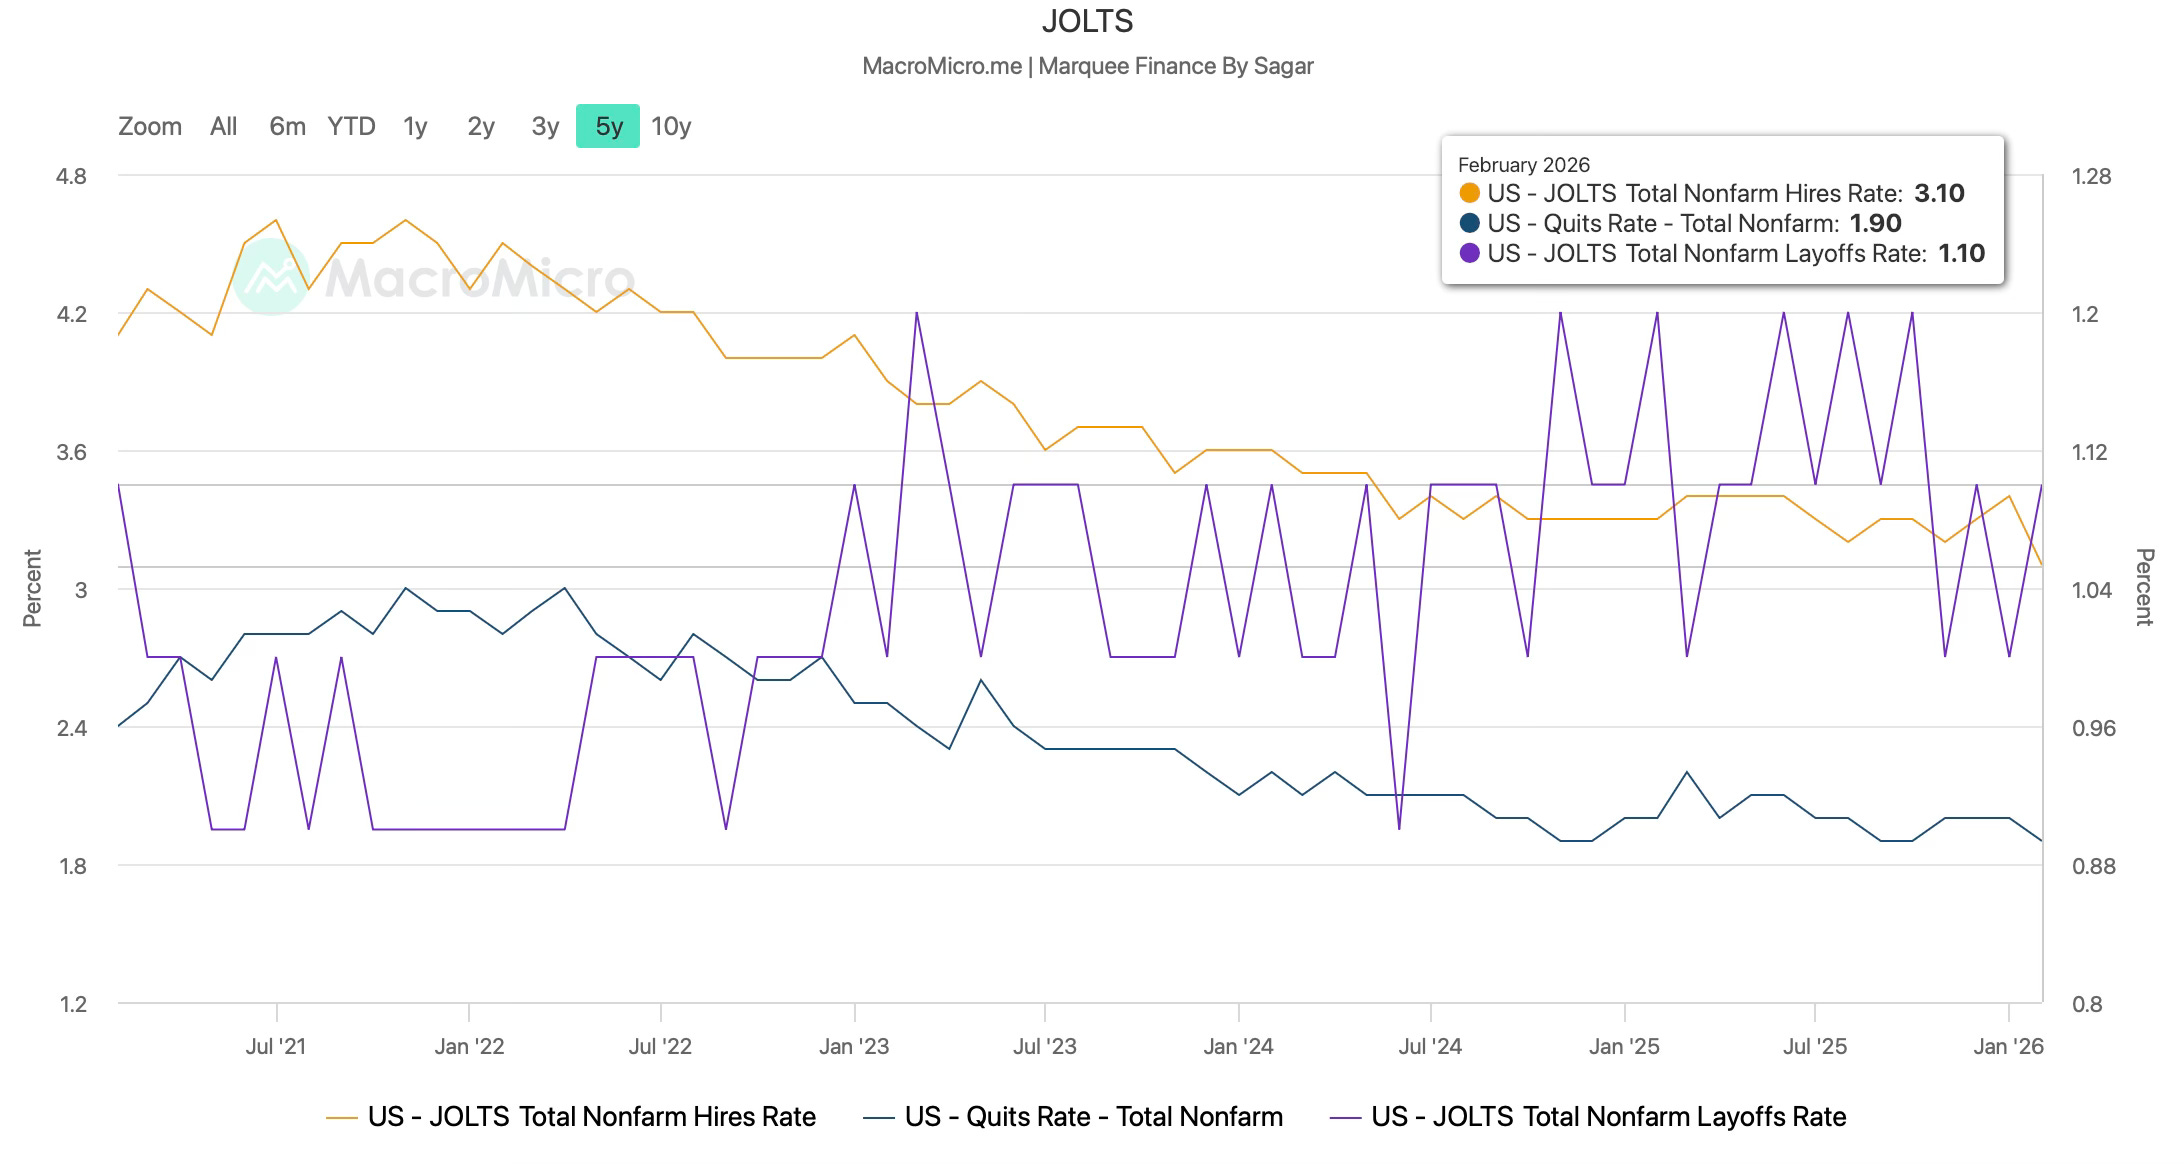
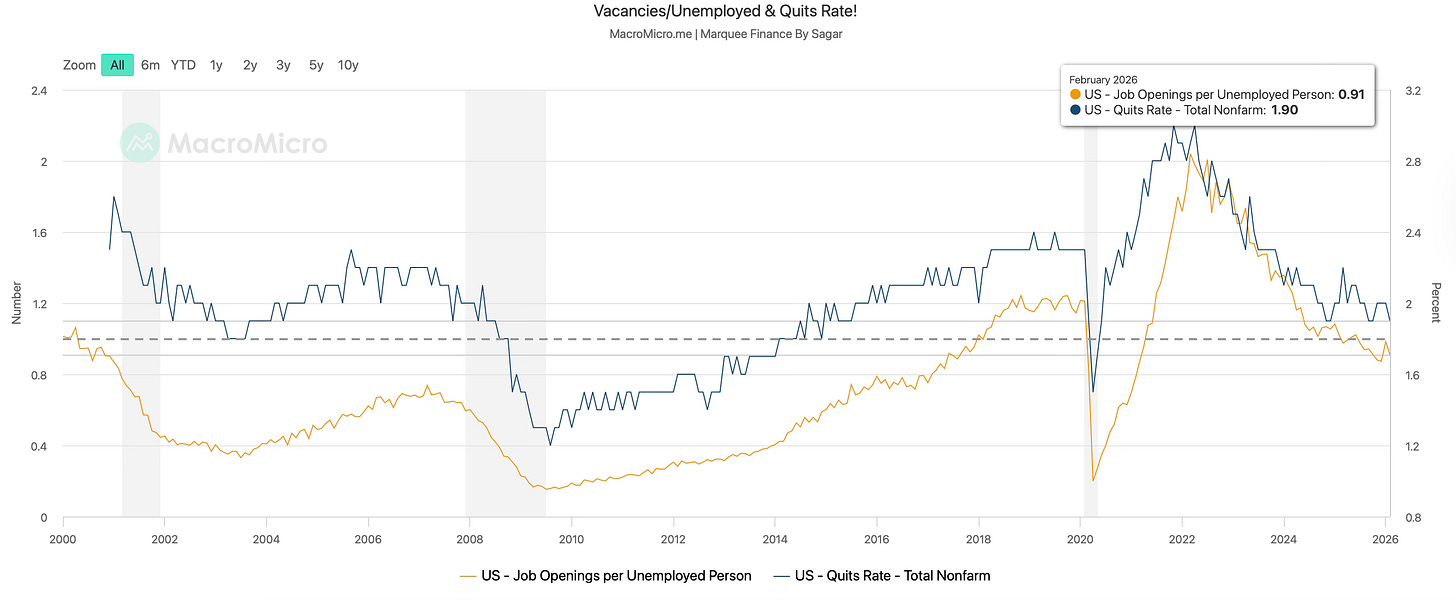
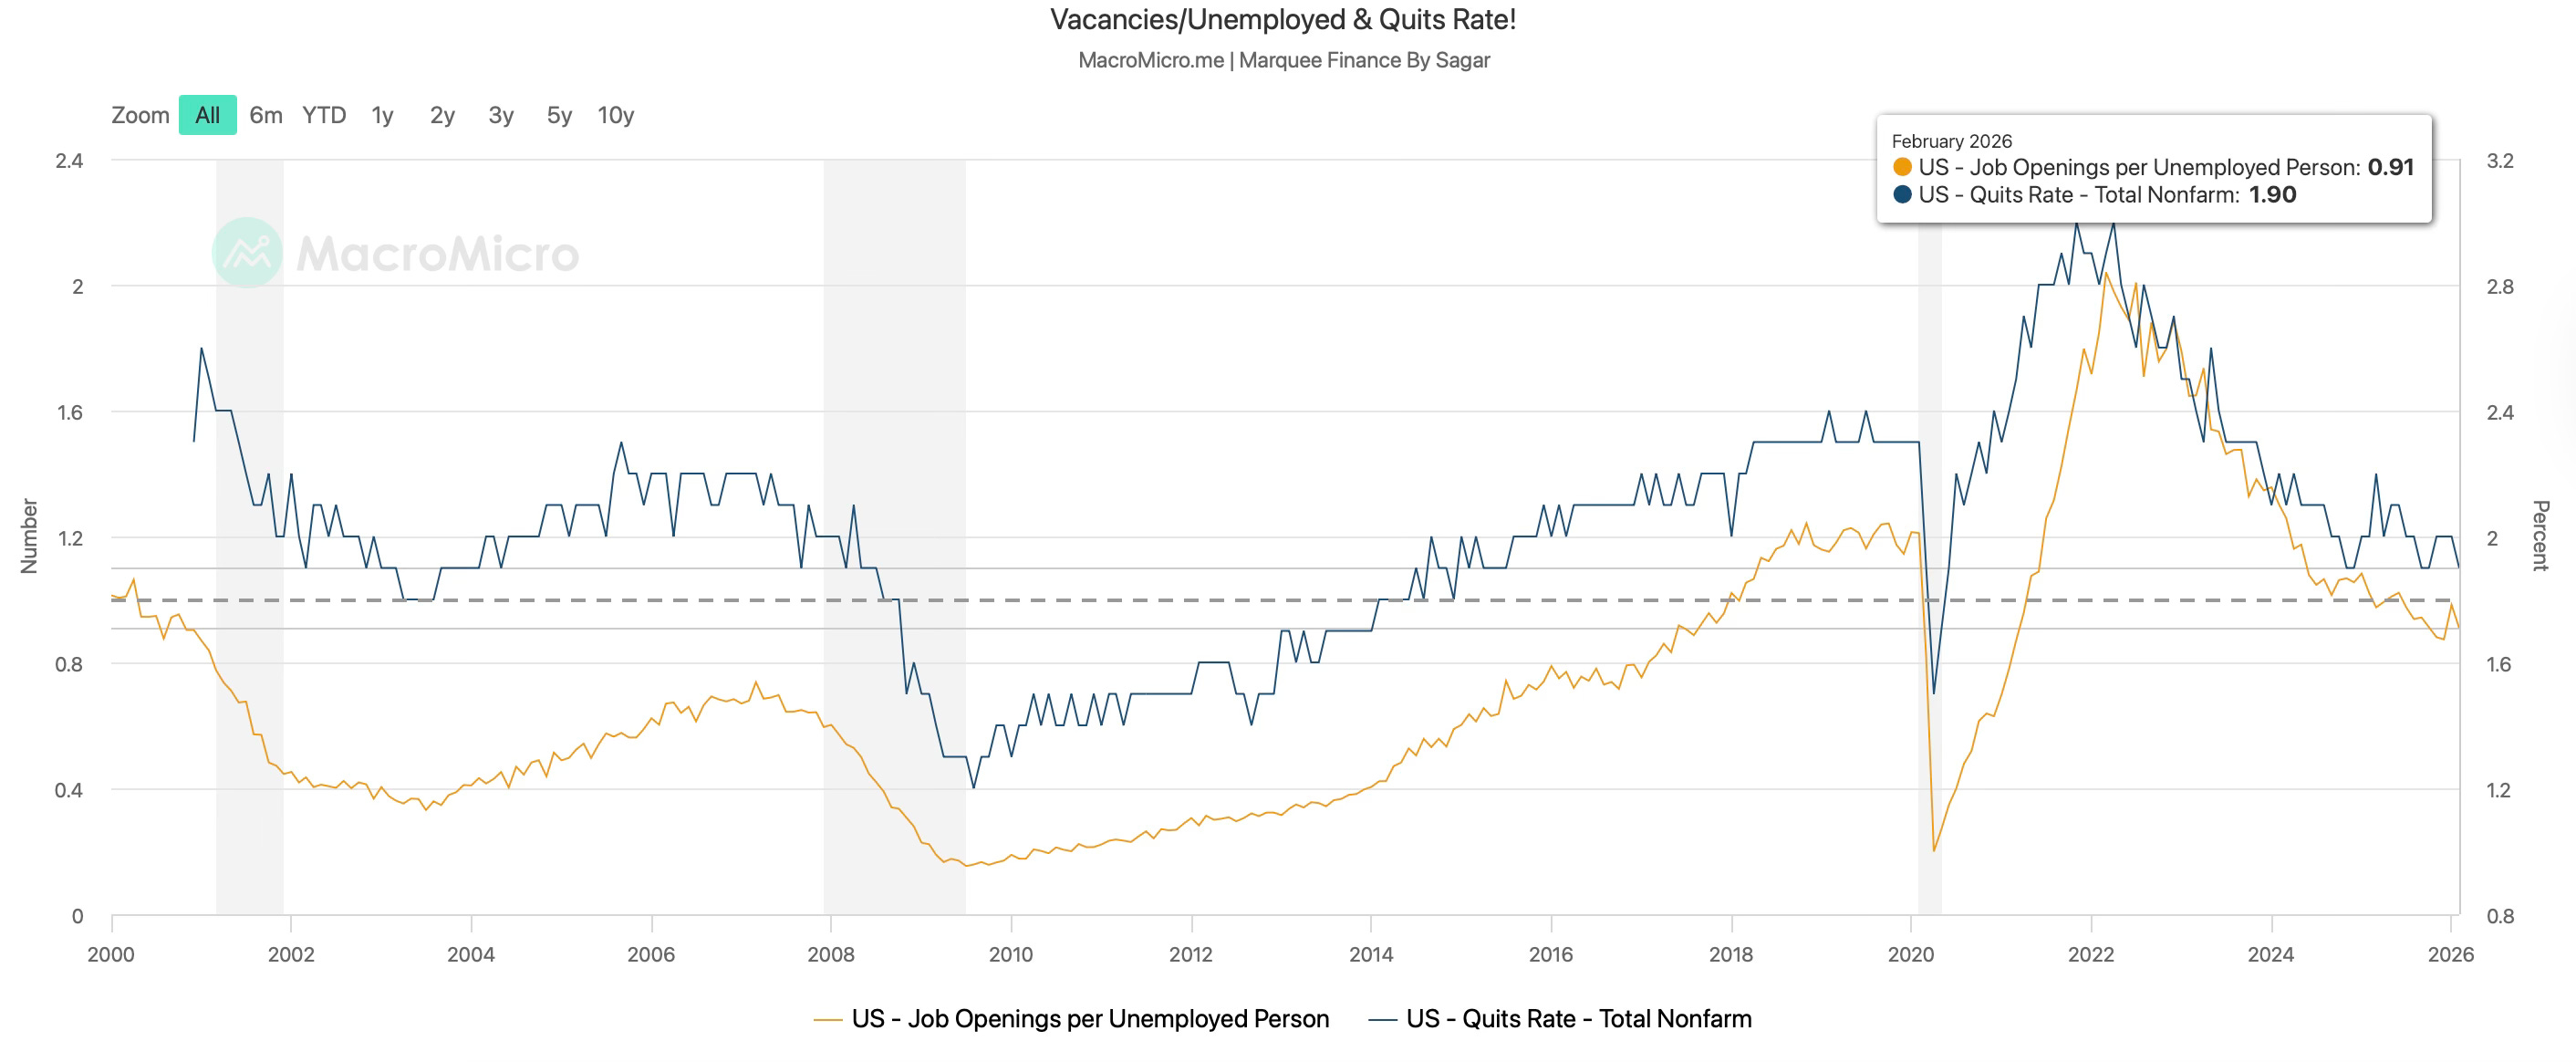
JOLTS-1: JOLTS job openings came in at 6.946MM v/s expected 6.750MM. However, the devil lies in the details. JayPo’s favourite labour market indicator, Vacancies/Unemployed, fell again below 1 to 0.91, indicating weakness in the labour market. Furthermore, the quits rate fell to a cycle low of 1.9%.
JOLTS-2: While Quit Rates fell to the cycle lows, the Hires Rate plunged to 3.1%, the lowest in six years. Furthermore, the layoff rate jumped again to 1.1%, though it remains below the cycle highs. The low-hire, low-fire environment may turn into low-hire, high-fire in the coming months if the energy crisis is prolonged and the tech layoffs rise.