
Peak Hawkishness?

Those who have been in markets for the last two decades know that liquidity and central bank policy are the biggest drivers of the financial markets.
Although there can be periods of dislocation and broken correlations, markets in the medium- to long-term are mean-reverting (long-time readers know that we are big believers in mean reversion).
Markets have perceived Warsh as uber-hawkish since his first FOMC meeting last month. While there were sufficient reasons for the Fed to be hawkish, we now believe that certain inflationary pressures have eased.
However, because Warsh has not provided any forward guidance, there is an opportunity.
We will discuss this in detail later.
For the American friends reading the newsletter, Happy 4th of July, everyone.
As the US celebrates its 250th Independence Day, Iran is mourning the death of Ali Khomeini with a week-long holiday in Iran.
We believe there has been significant progress in the talks, as representatives from both countries met in Doha this week.
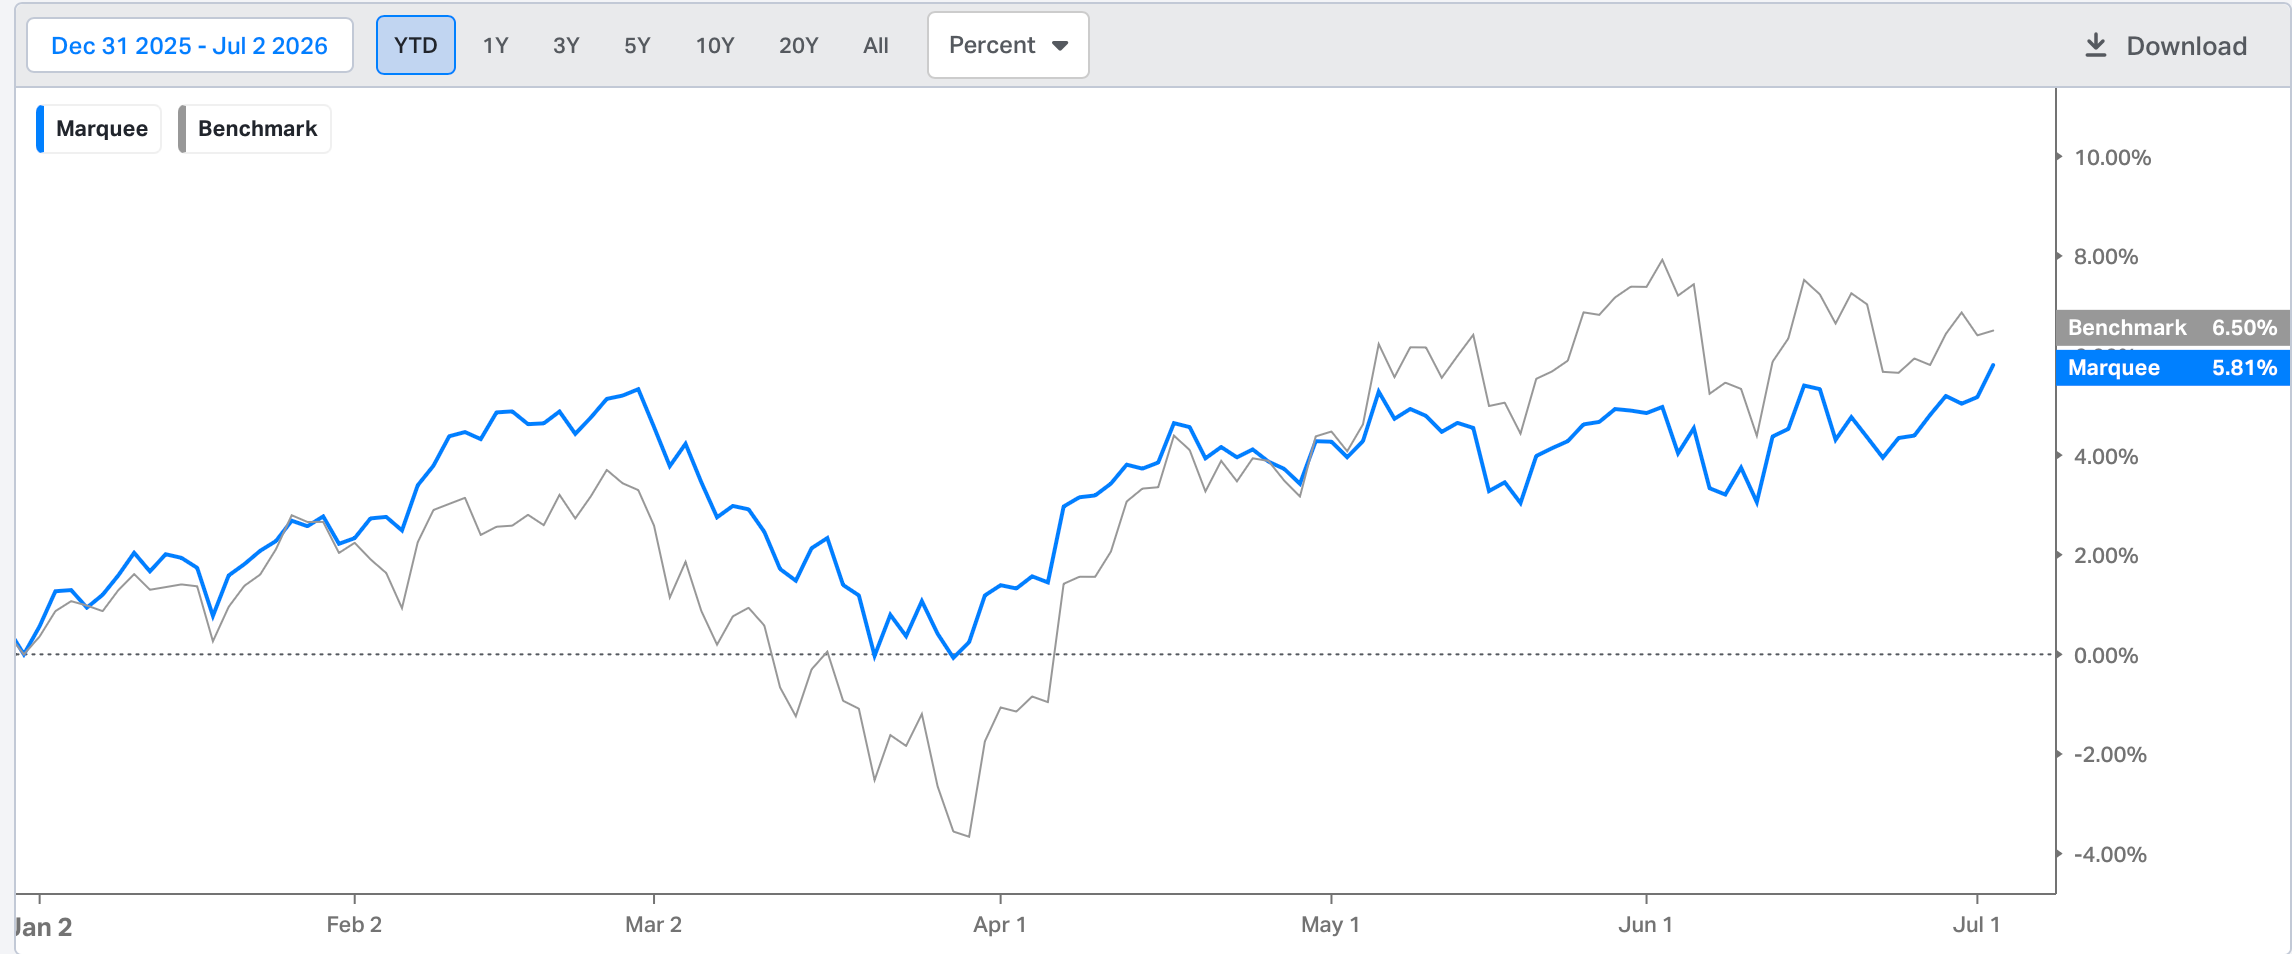
We have been optimistic that our PF would outperform the benchmark over the last month.
We are now at YTD highs, and the underperformance has been reduced to less than 70 bps (the peak underperformance was 250 bps).
Let us take a deep dive into the macro universe and comprehend the cross-asset moves.
US/Equities/Bonds/Dollar/Gold/Oil!
Our favourite indicator for tracking the cyclical economy is the ISM Manufacturing Index.
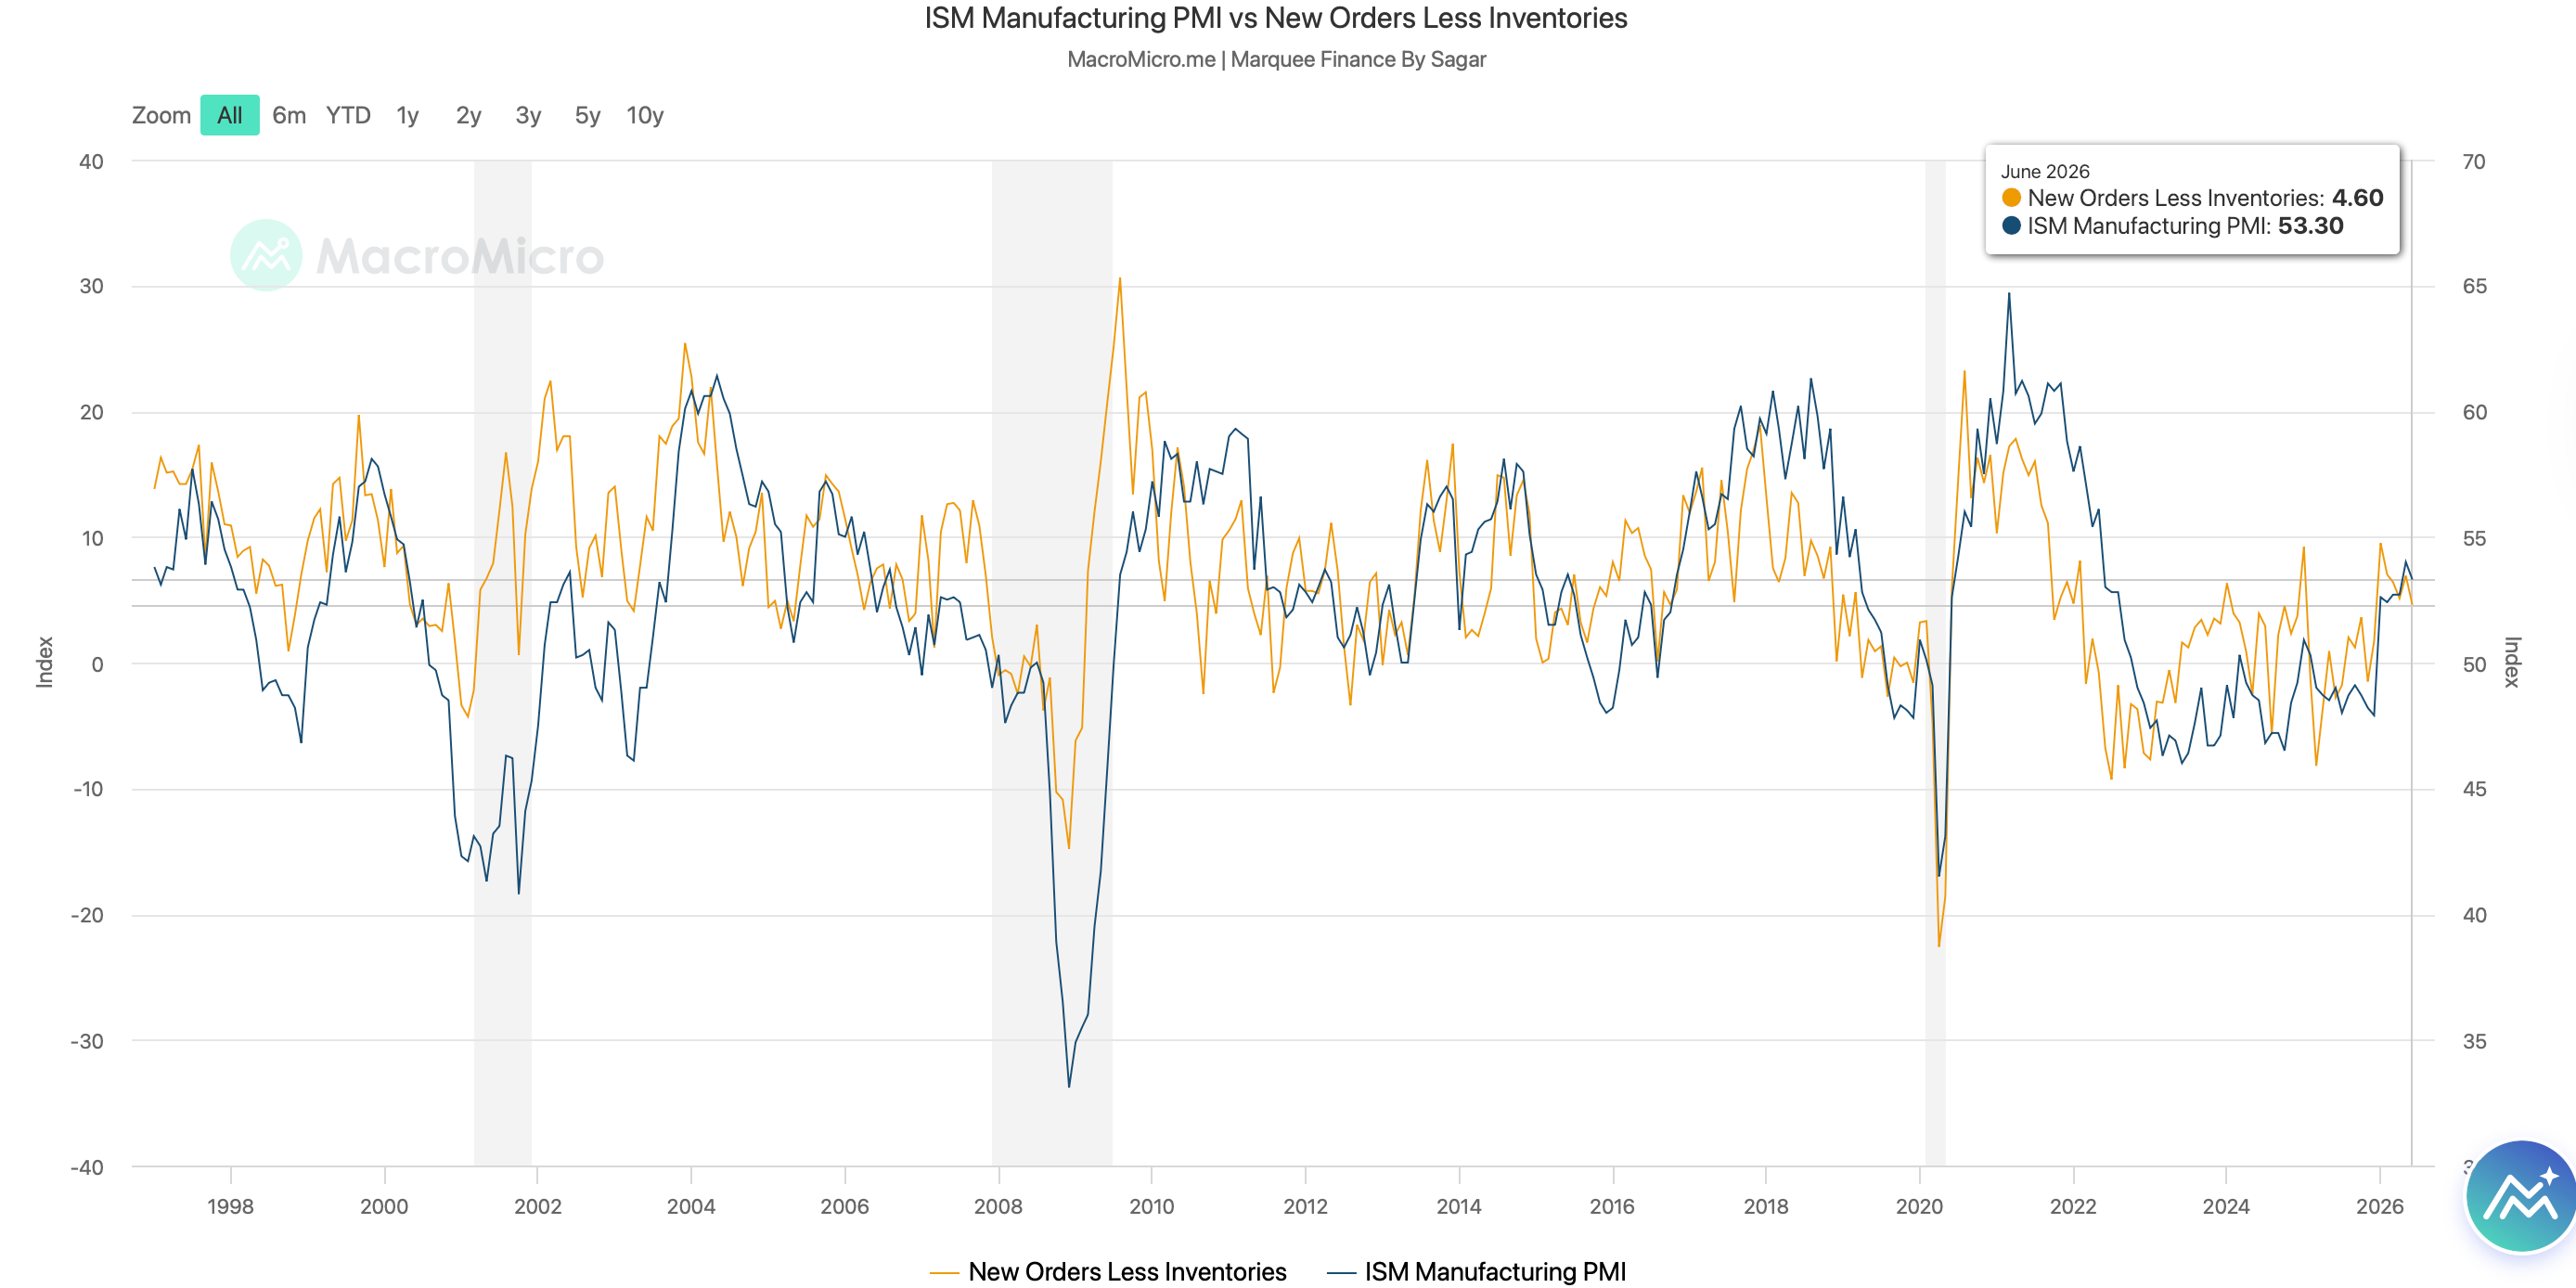
ISM Manufacturing PMI came in at 53.3 vs the expected 53.9.
Overall, it was a stable report with some green shoots.
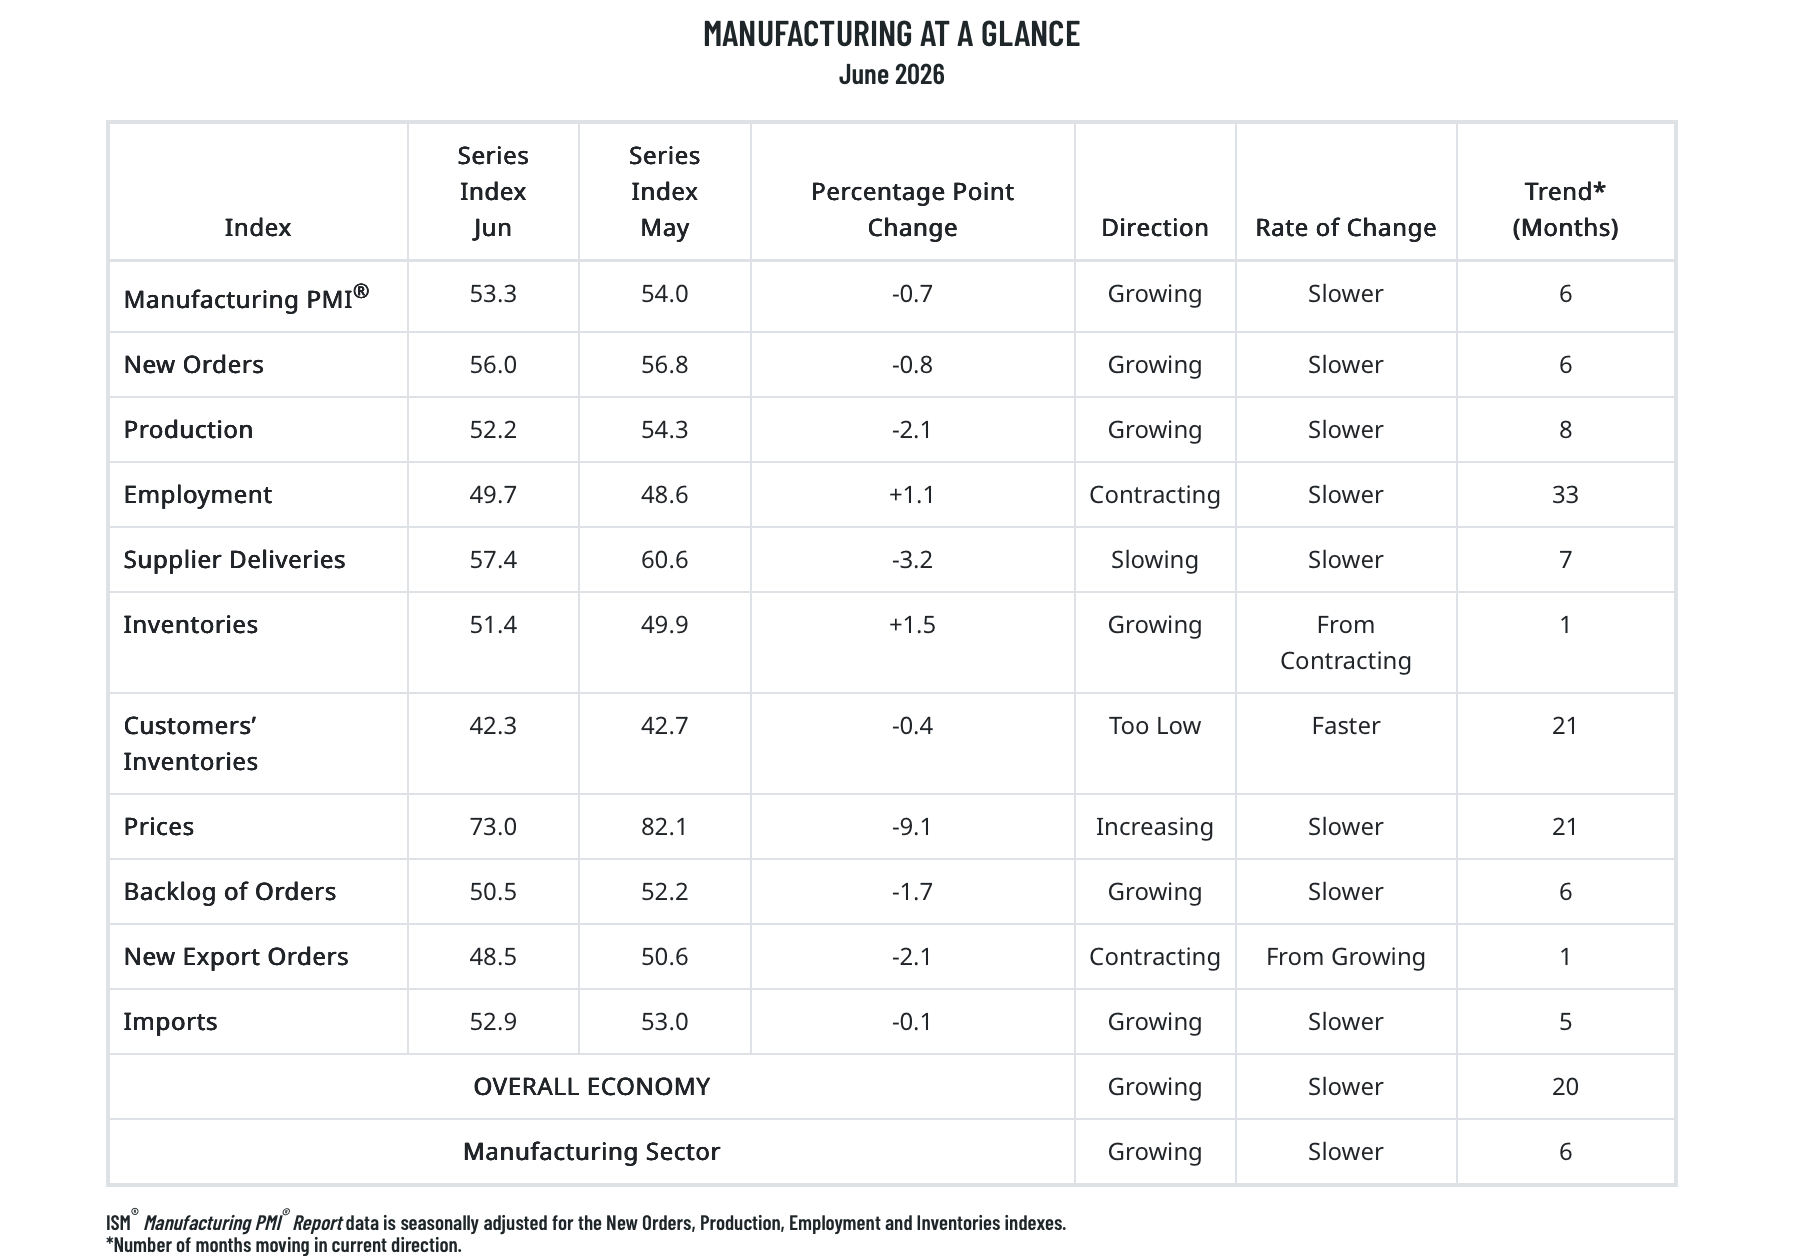
While the prices eased off significantly (73 v/s 82.1 in May), the Employment component is finally on the verge of crossing 50 (expansionary territory) after 33 long months.
In contrast, New Orders Less Inventories, a metric we monitor closely, declined from its recent highs, indicating that the ISM Manufacturing PMI may stay near current levels in the upcoming months.
We also received a significant number of data points to gauge labour market activity.
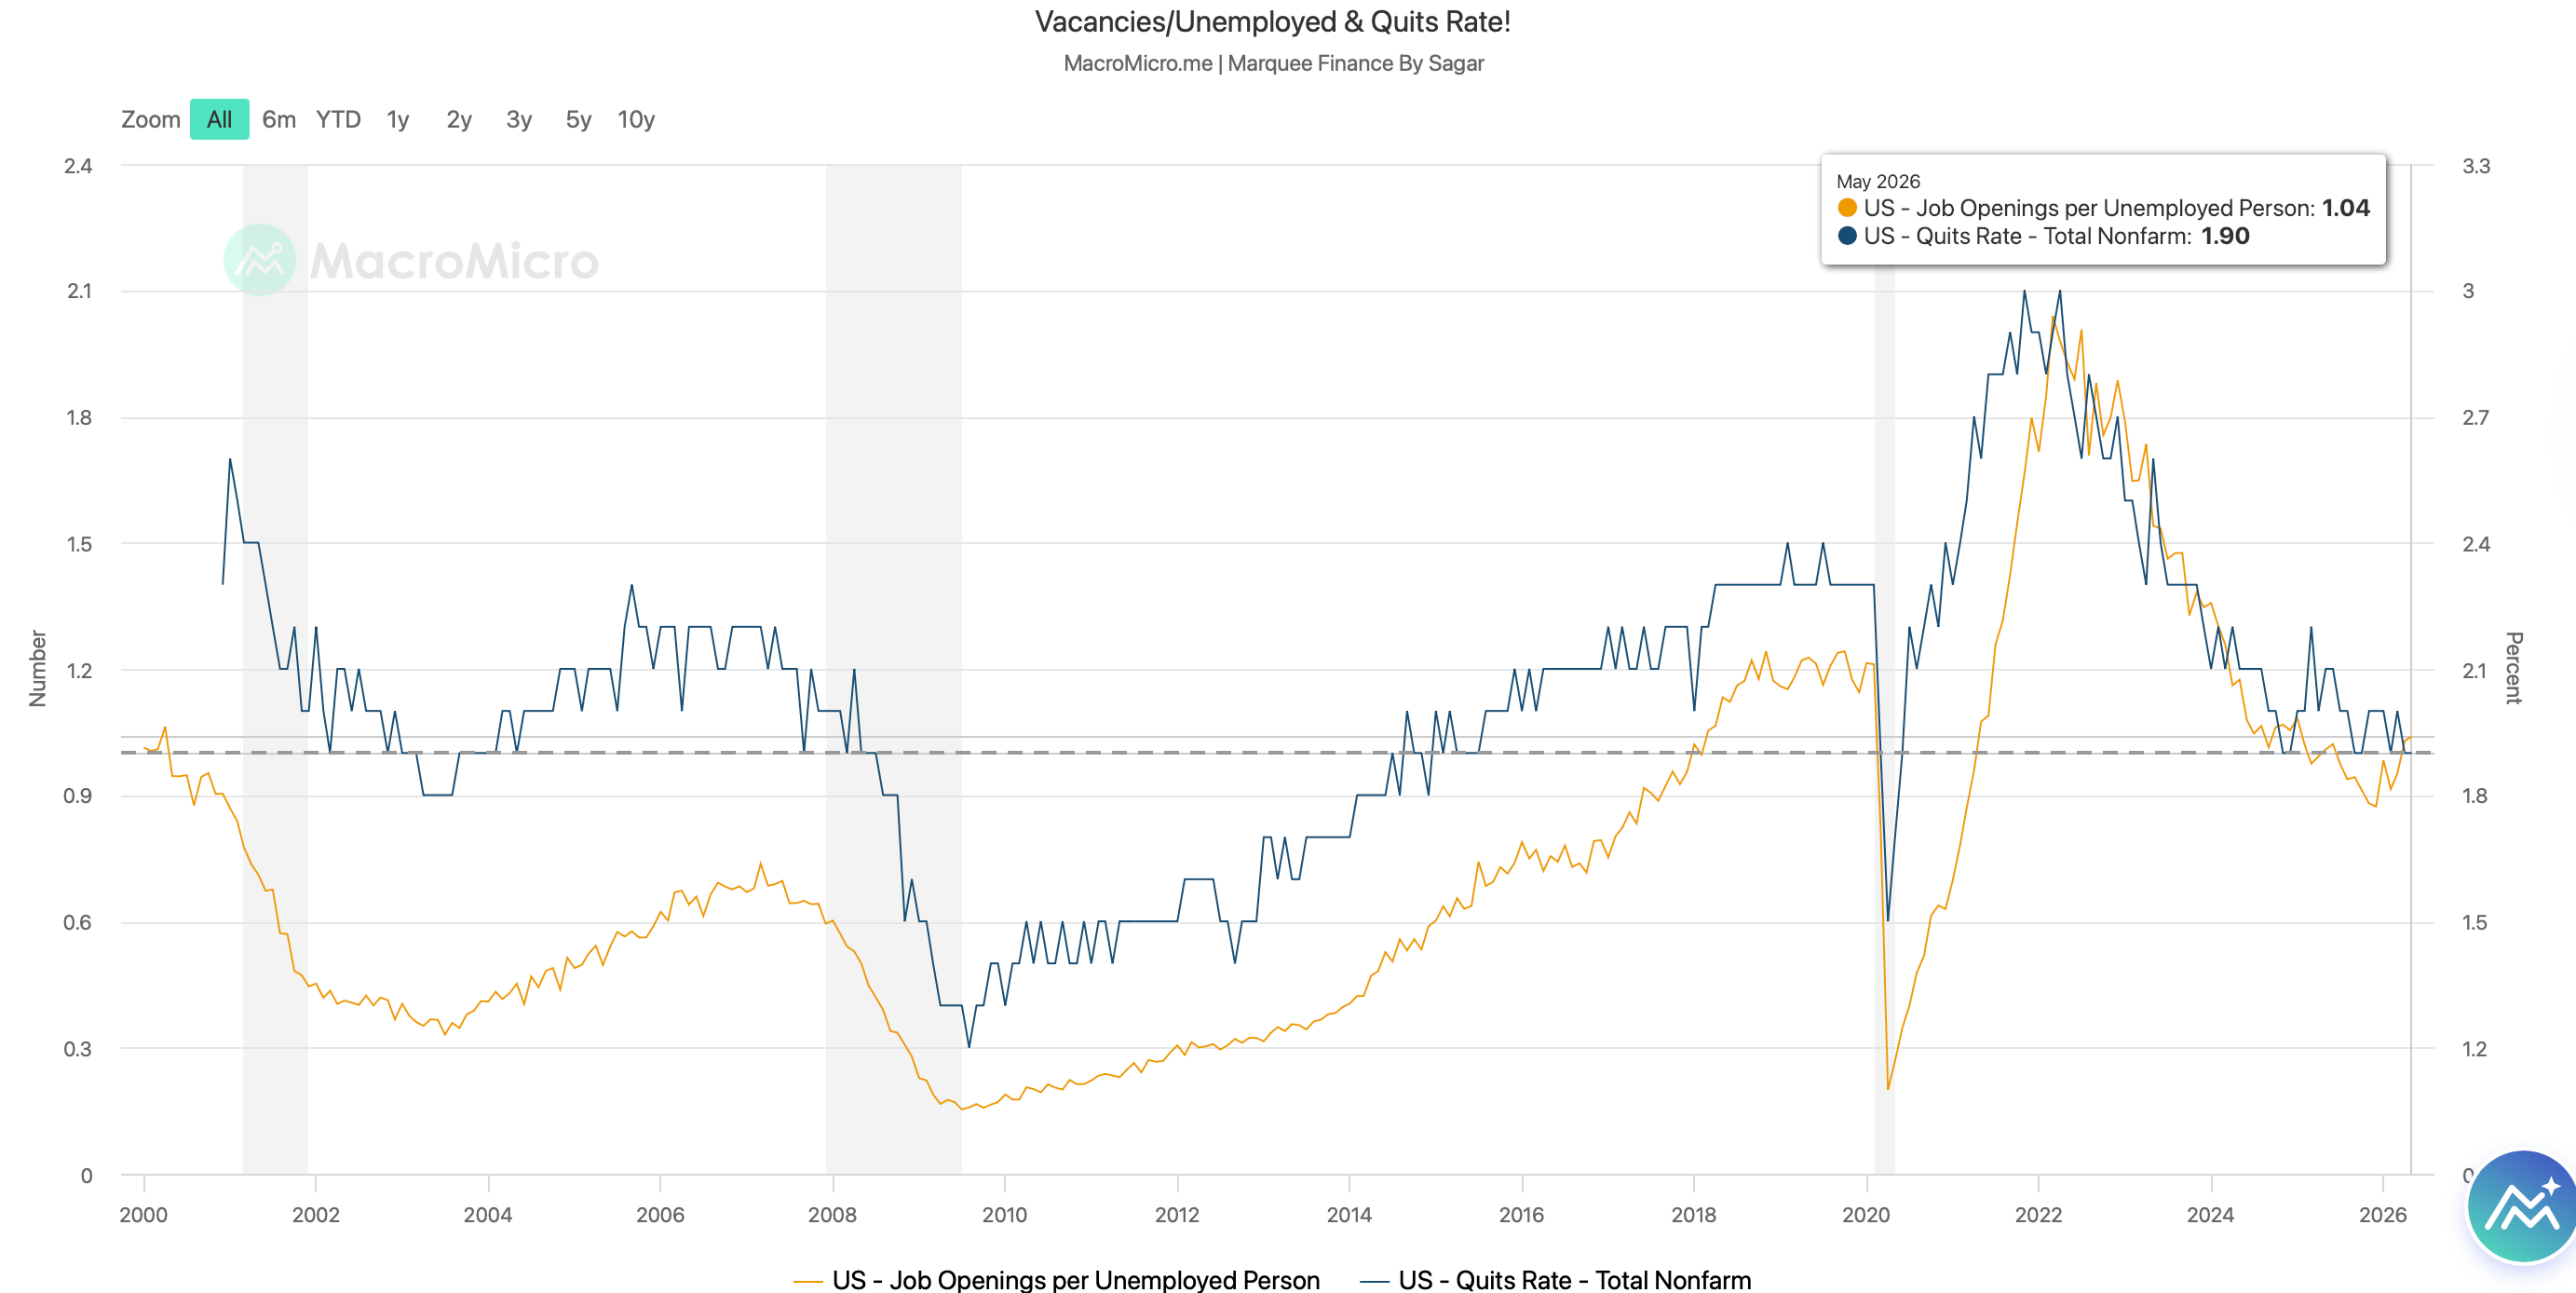
JOLTS-1: The Fed’s preferred measure for tracking labour market activity has been the Vacancies/Unemployed Ratio. The ratio bottomed out late last year (<1), which also marked an inflexion point in equity market internals. The ratio is now 1.04, indicating more vacancies than unemployed people.
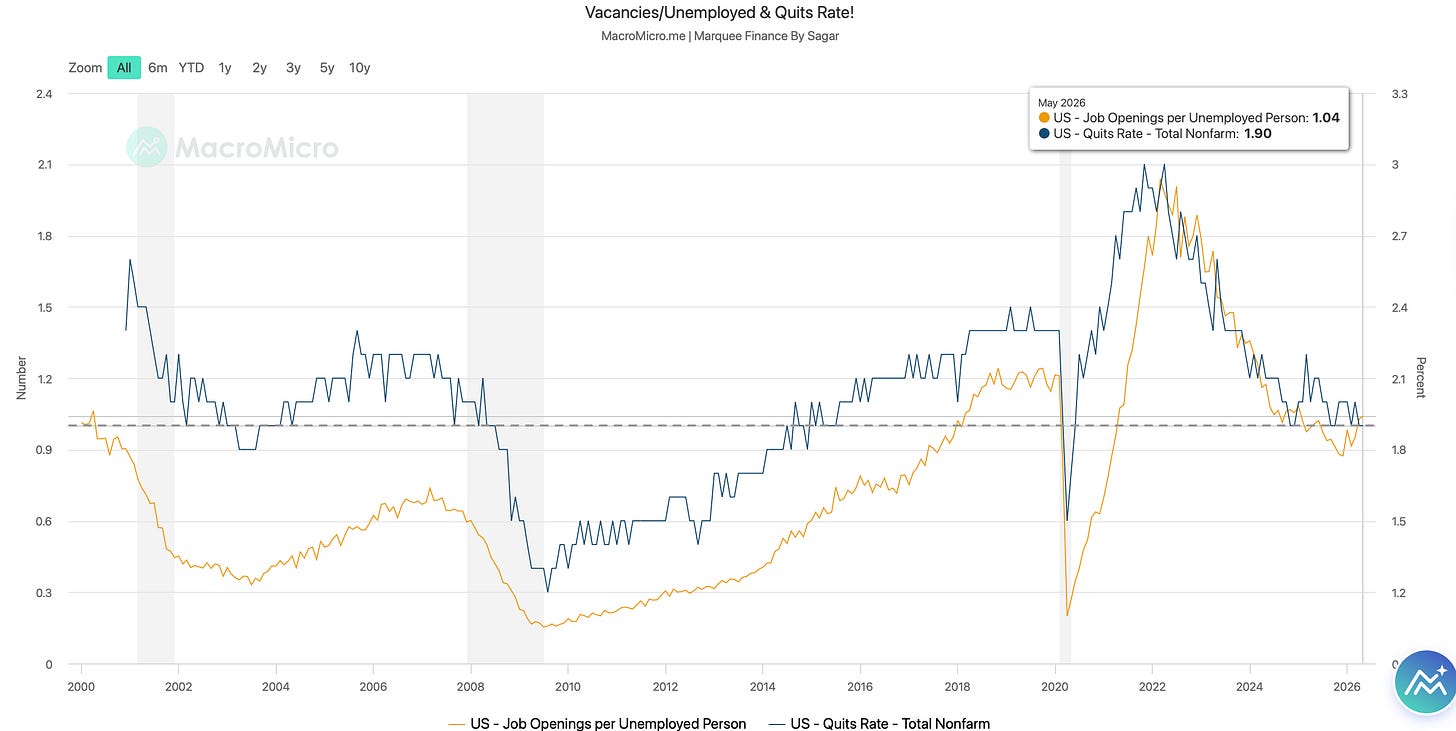
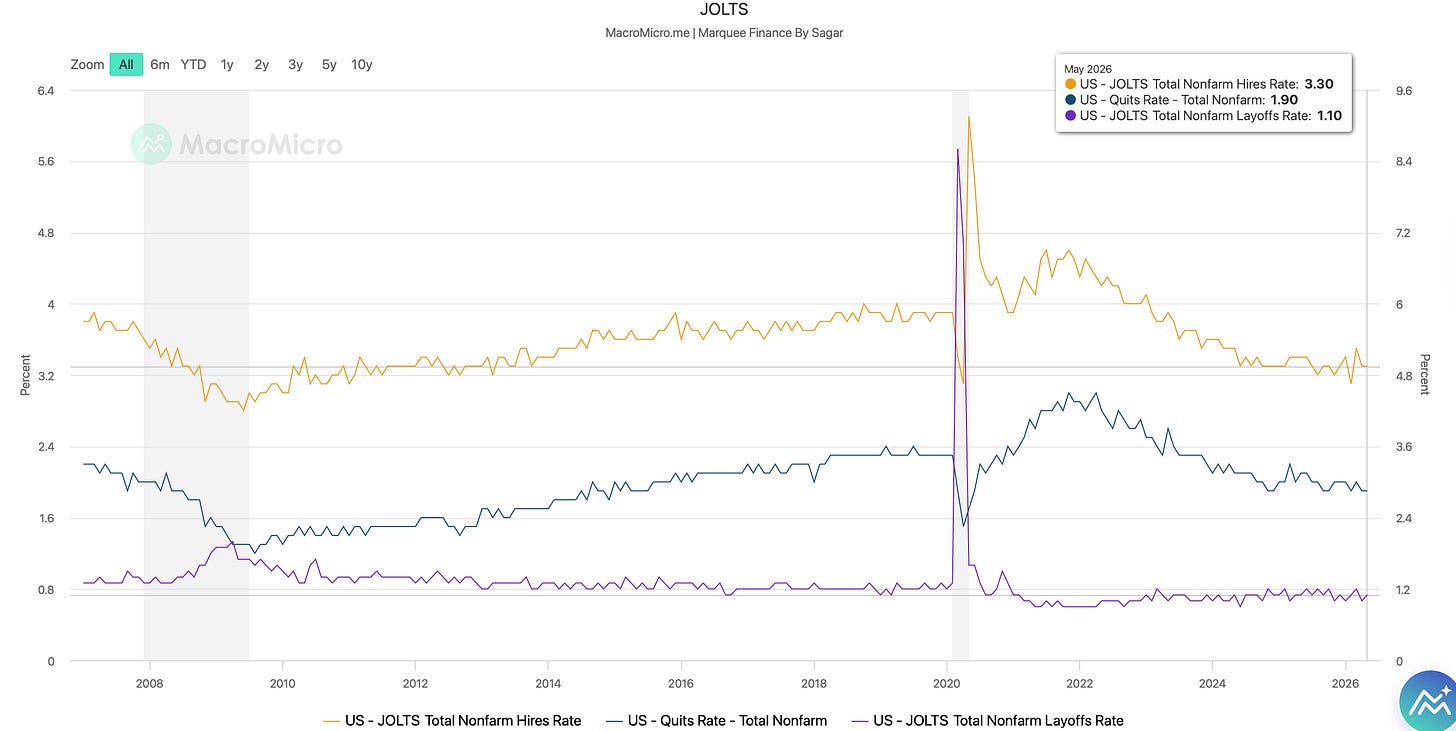
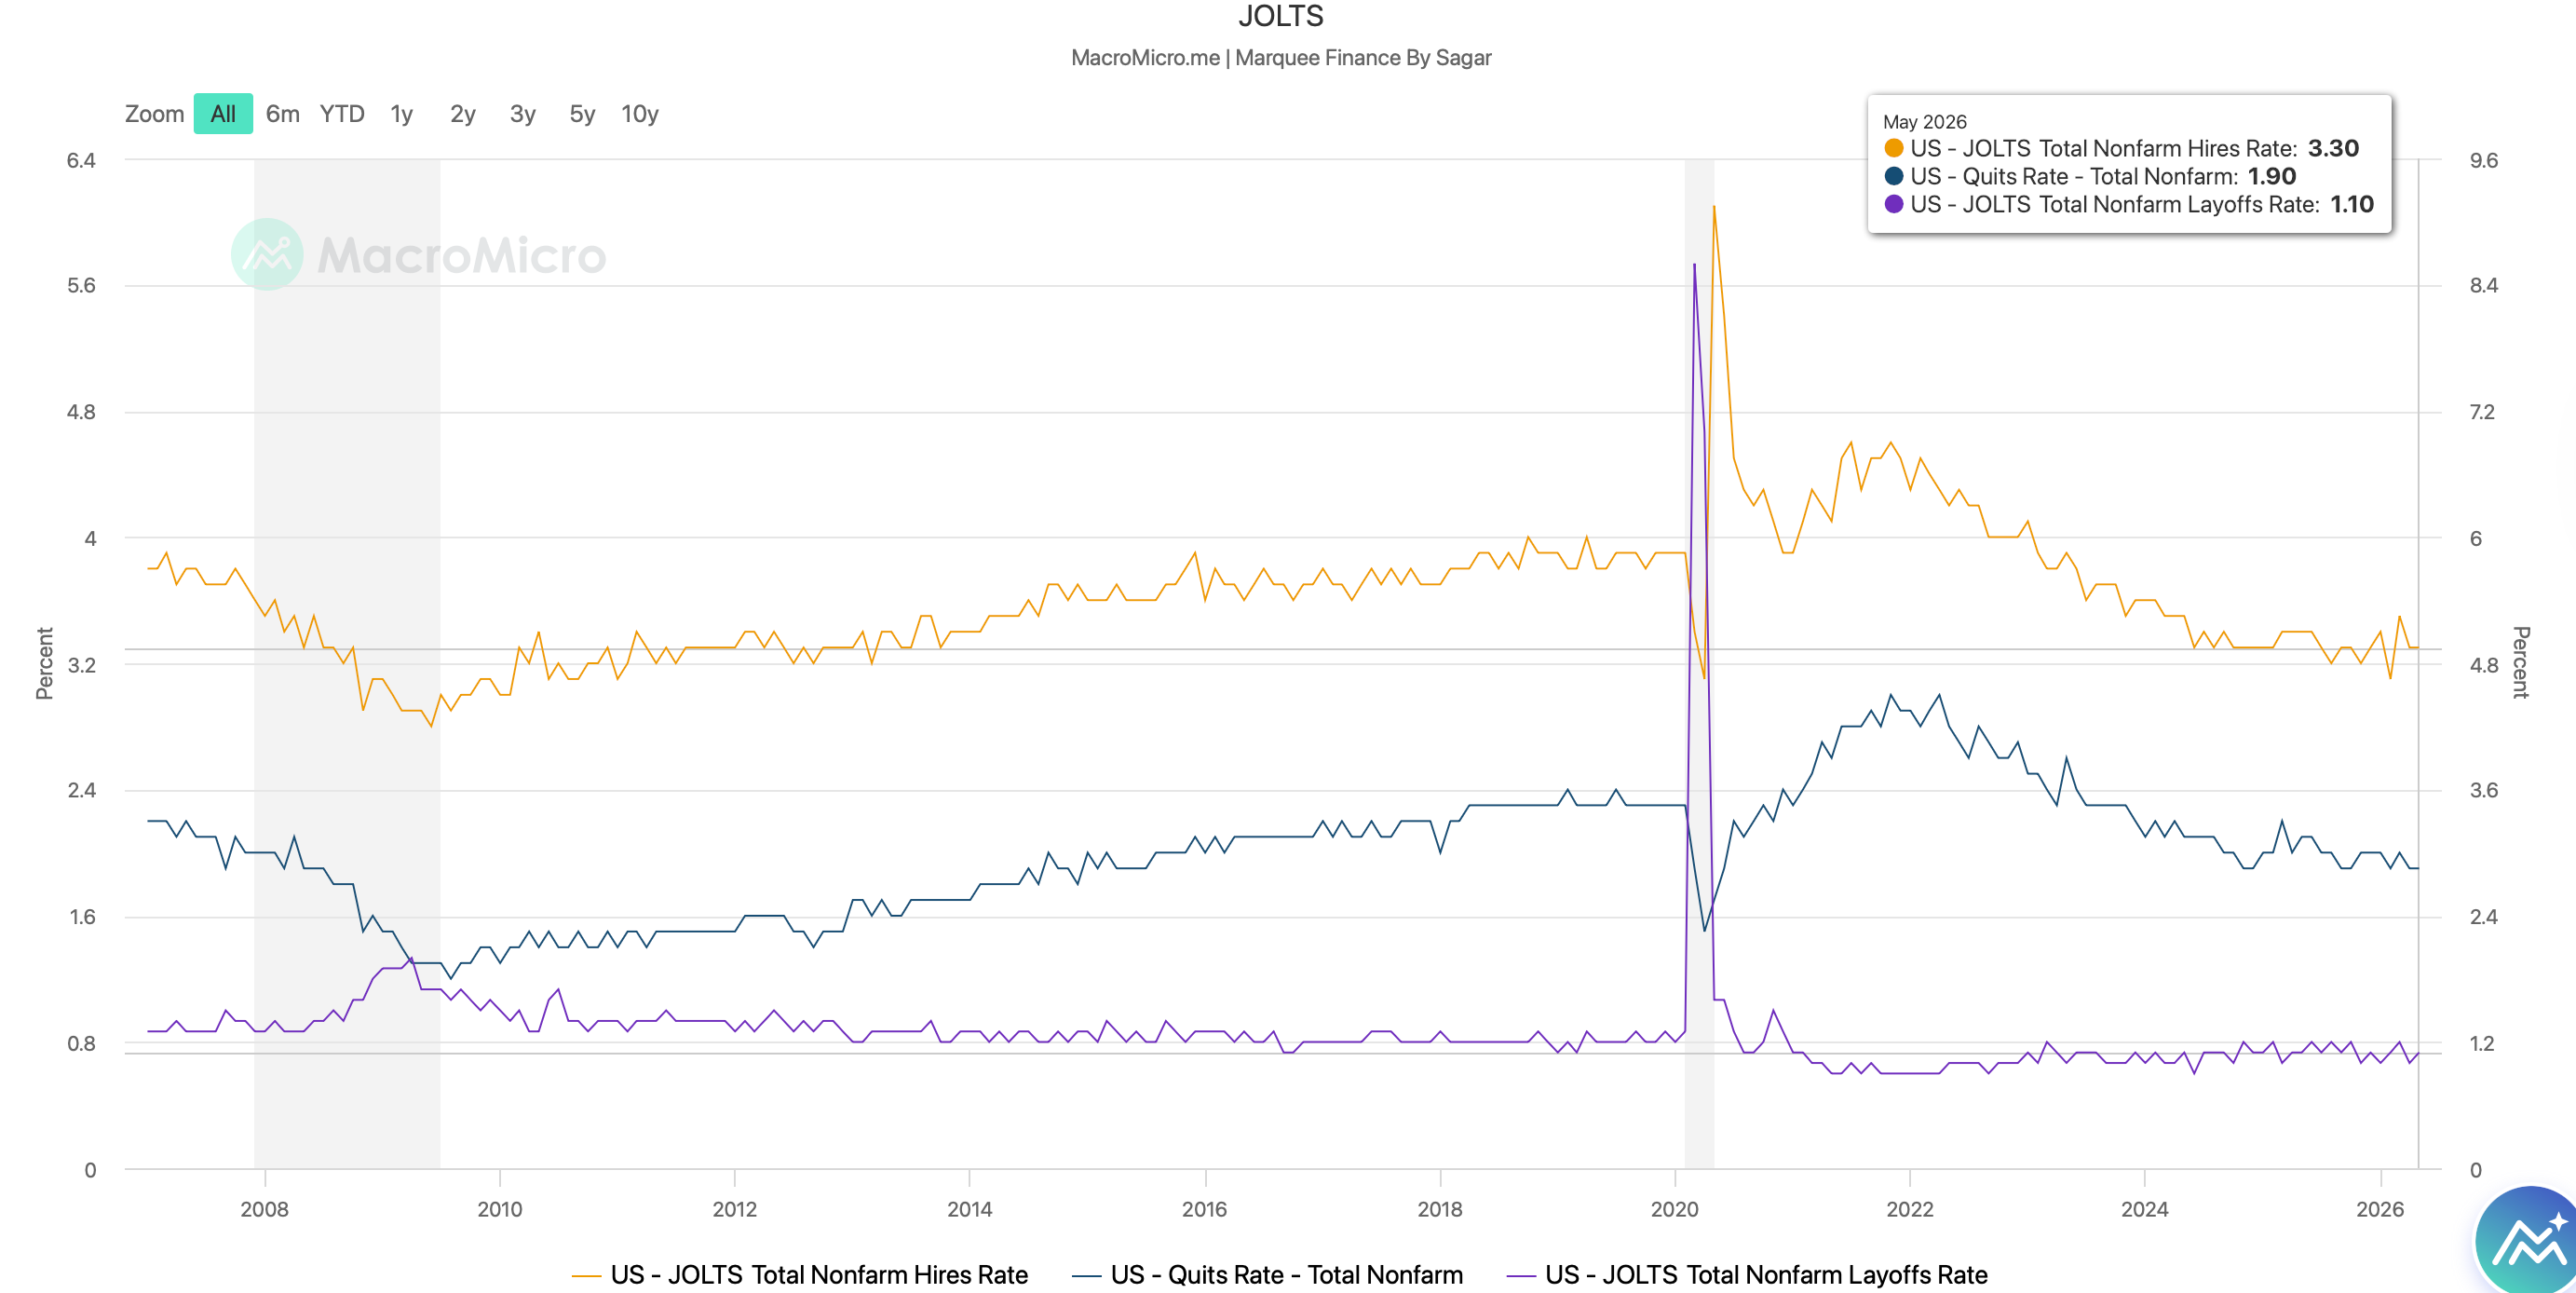
JOLTS-2: While the Quit Rate and Hire Rate have remained stable at 1.9% and 3.3%, respectively, the Layoff Rate saw a small 10 bps uptick. Nevertheless, we remain in a No-Hire, No-Fire labour market.
Before we proceed to the highlight of the week, we believe that the labour market is undergoing a structural change due to multiple factors: