

Last year, we explicitly mentioned that the rising debt at hyperscalers will be the pain point of 2026, as the market's concern will grow exponentially due to rising depreciation costs and the hyperscalers' ability to generate sufficient profits to justify the gigantic capex.
Last week, credit markets cracked as the IG market has been bombarded with hyperscaler debt issuance since the beginning of the year.
Spreads have been blowing out as debt markets push companies to slow capex.
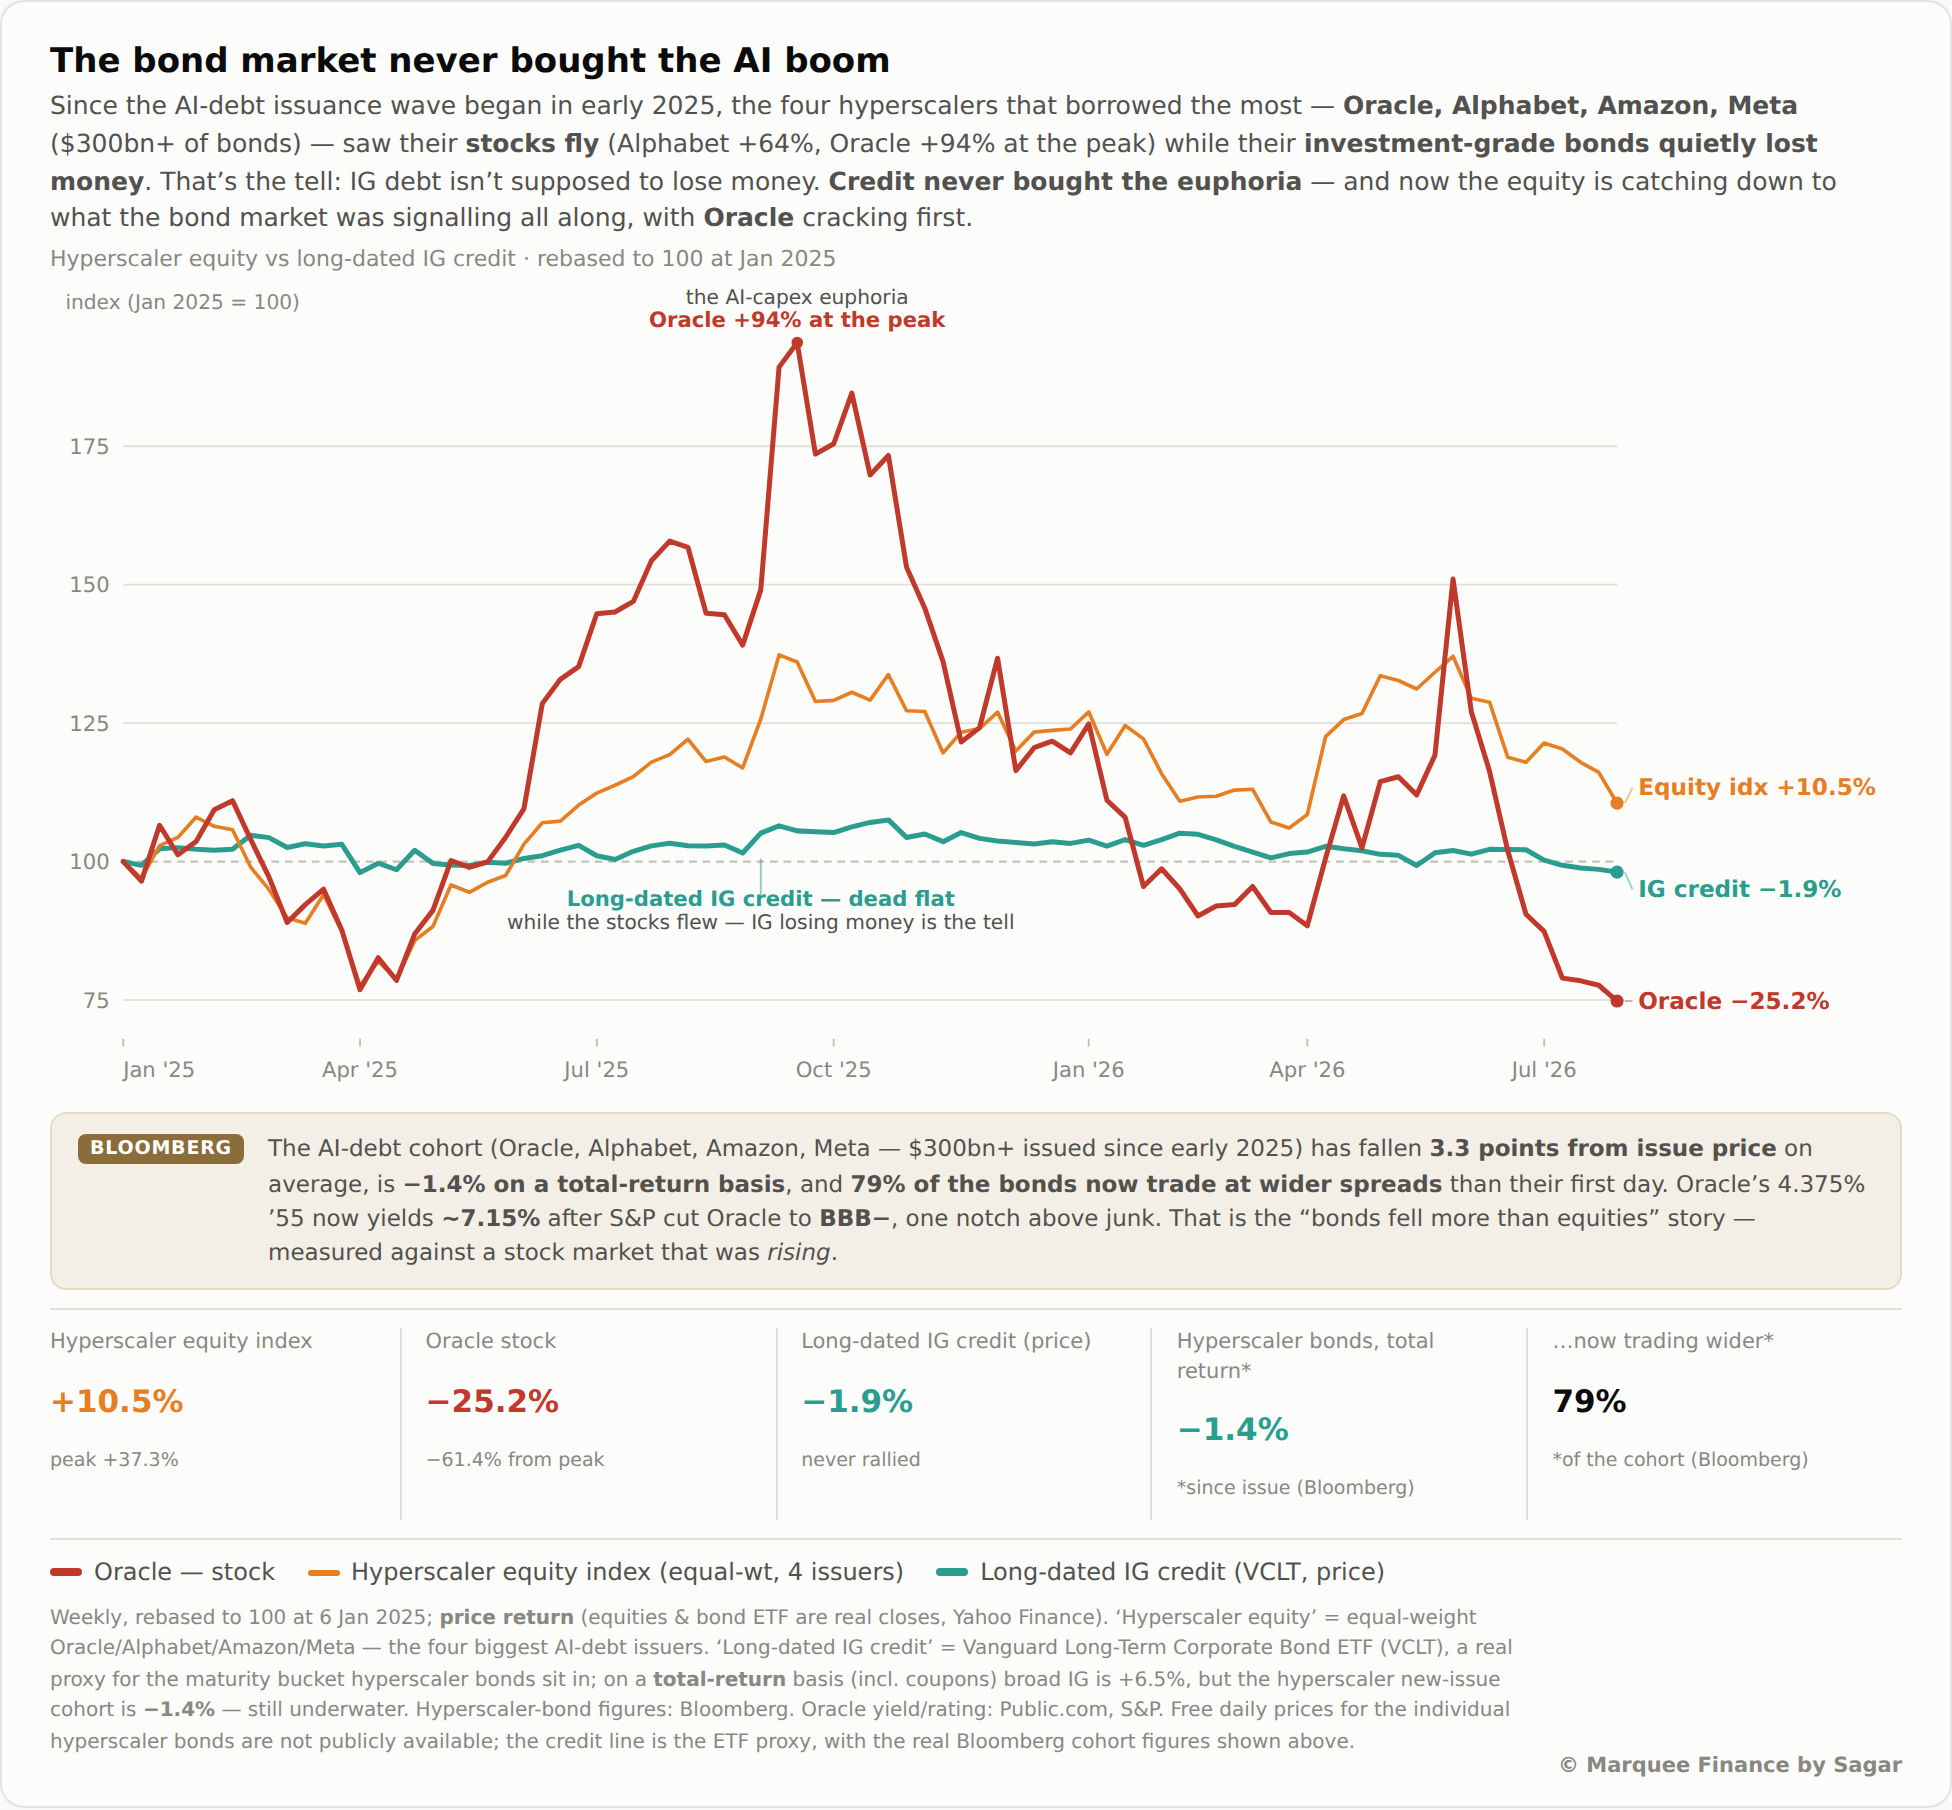
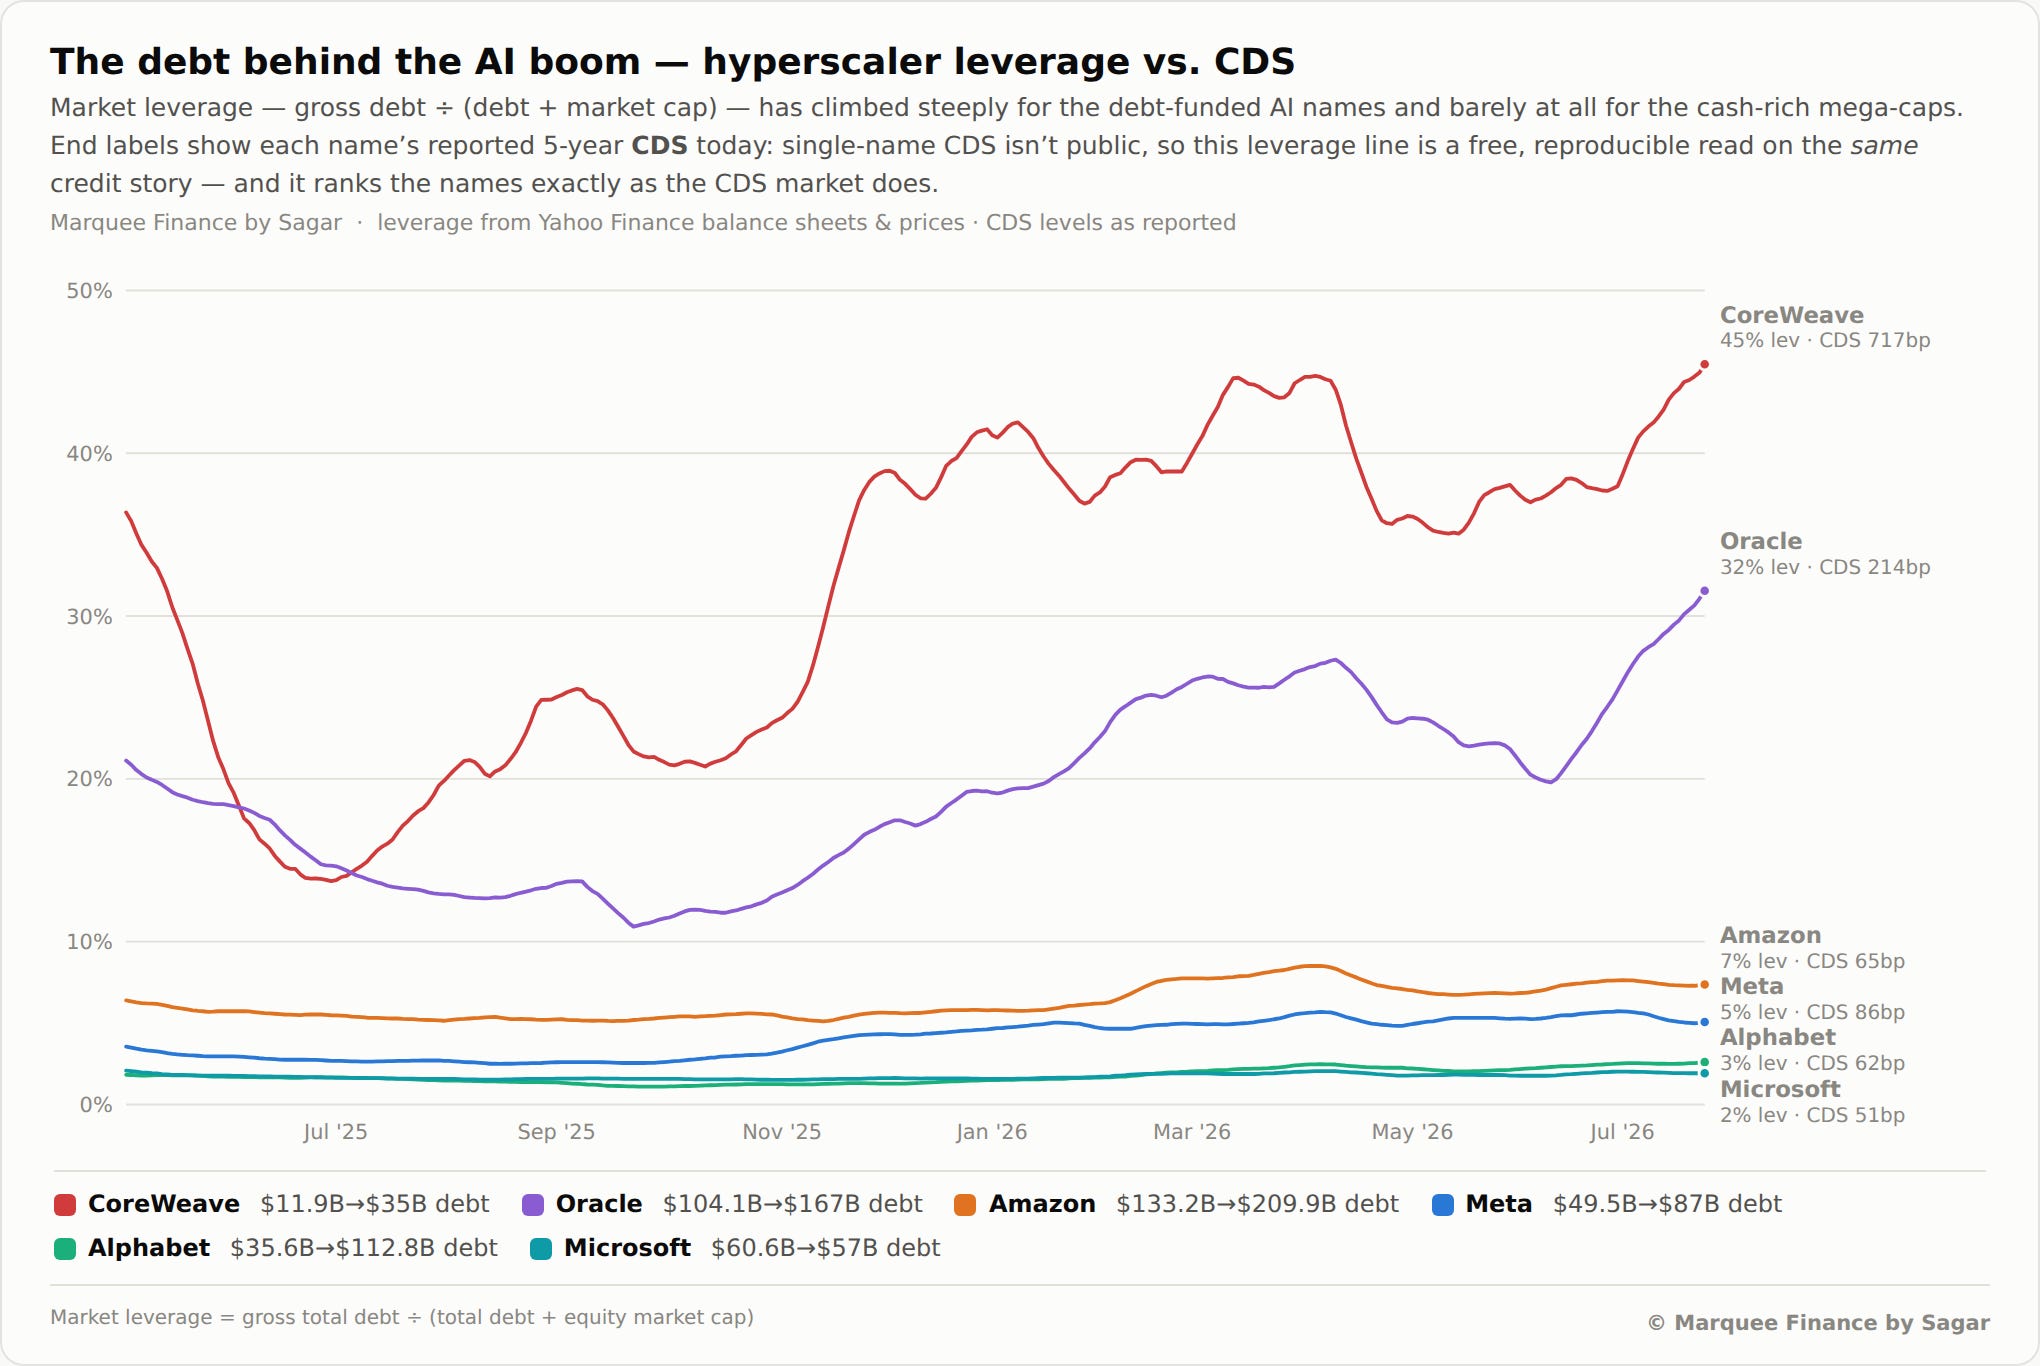
Furthermore, the Credit Default Swaps (CDS) on the most indebted companies in the tech space, ORCL and CRWV, have reached multi-year highs.
Furthermore, in the last fortnight or so, we have seen the large hyperscalers' CDS also rising, indicating that markets are now genuinely worried about the ROICs (especially after Chinese open-source models).
We believe that last week’s Hugging Face hacking incident, and the introduction of a new AI “Kill Switch” bill, indicate that we need a “worldwide” regulatory framework for a safe and secure development of AI.
We will not be surprised if G20 countries make a joint announcement in this regard in the near future.
We are announcing a price increase for our subscription plans, driven by significant new features and upcoming updates. Starting August 15th, the monthly plan will increase from $ 29.99 to $ 39.99, and the annual plan will increase from $ 299.99 to $ 399.
Existing subscribers will “NOT” see any changes and will remain on their current plans.
Since 1st January, the trade book stats are as follows:
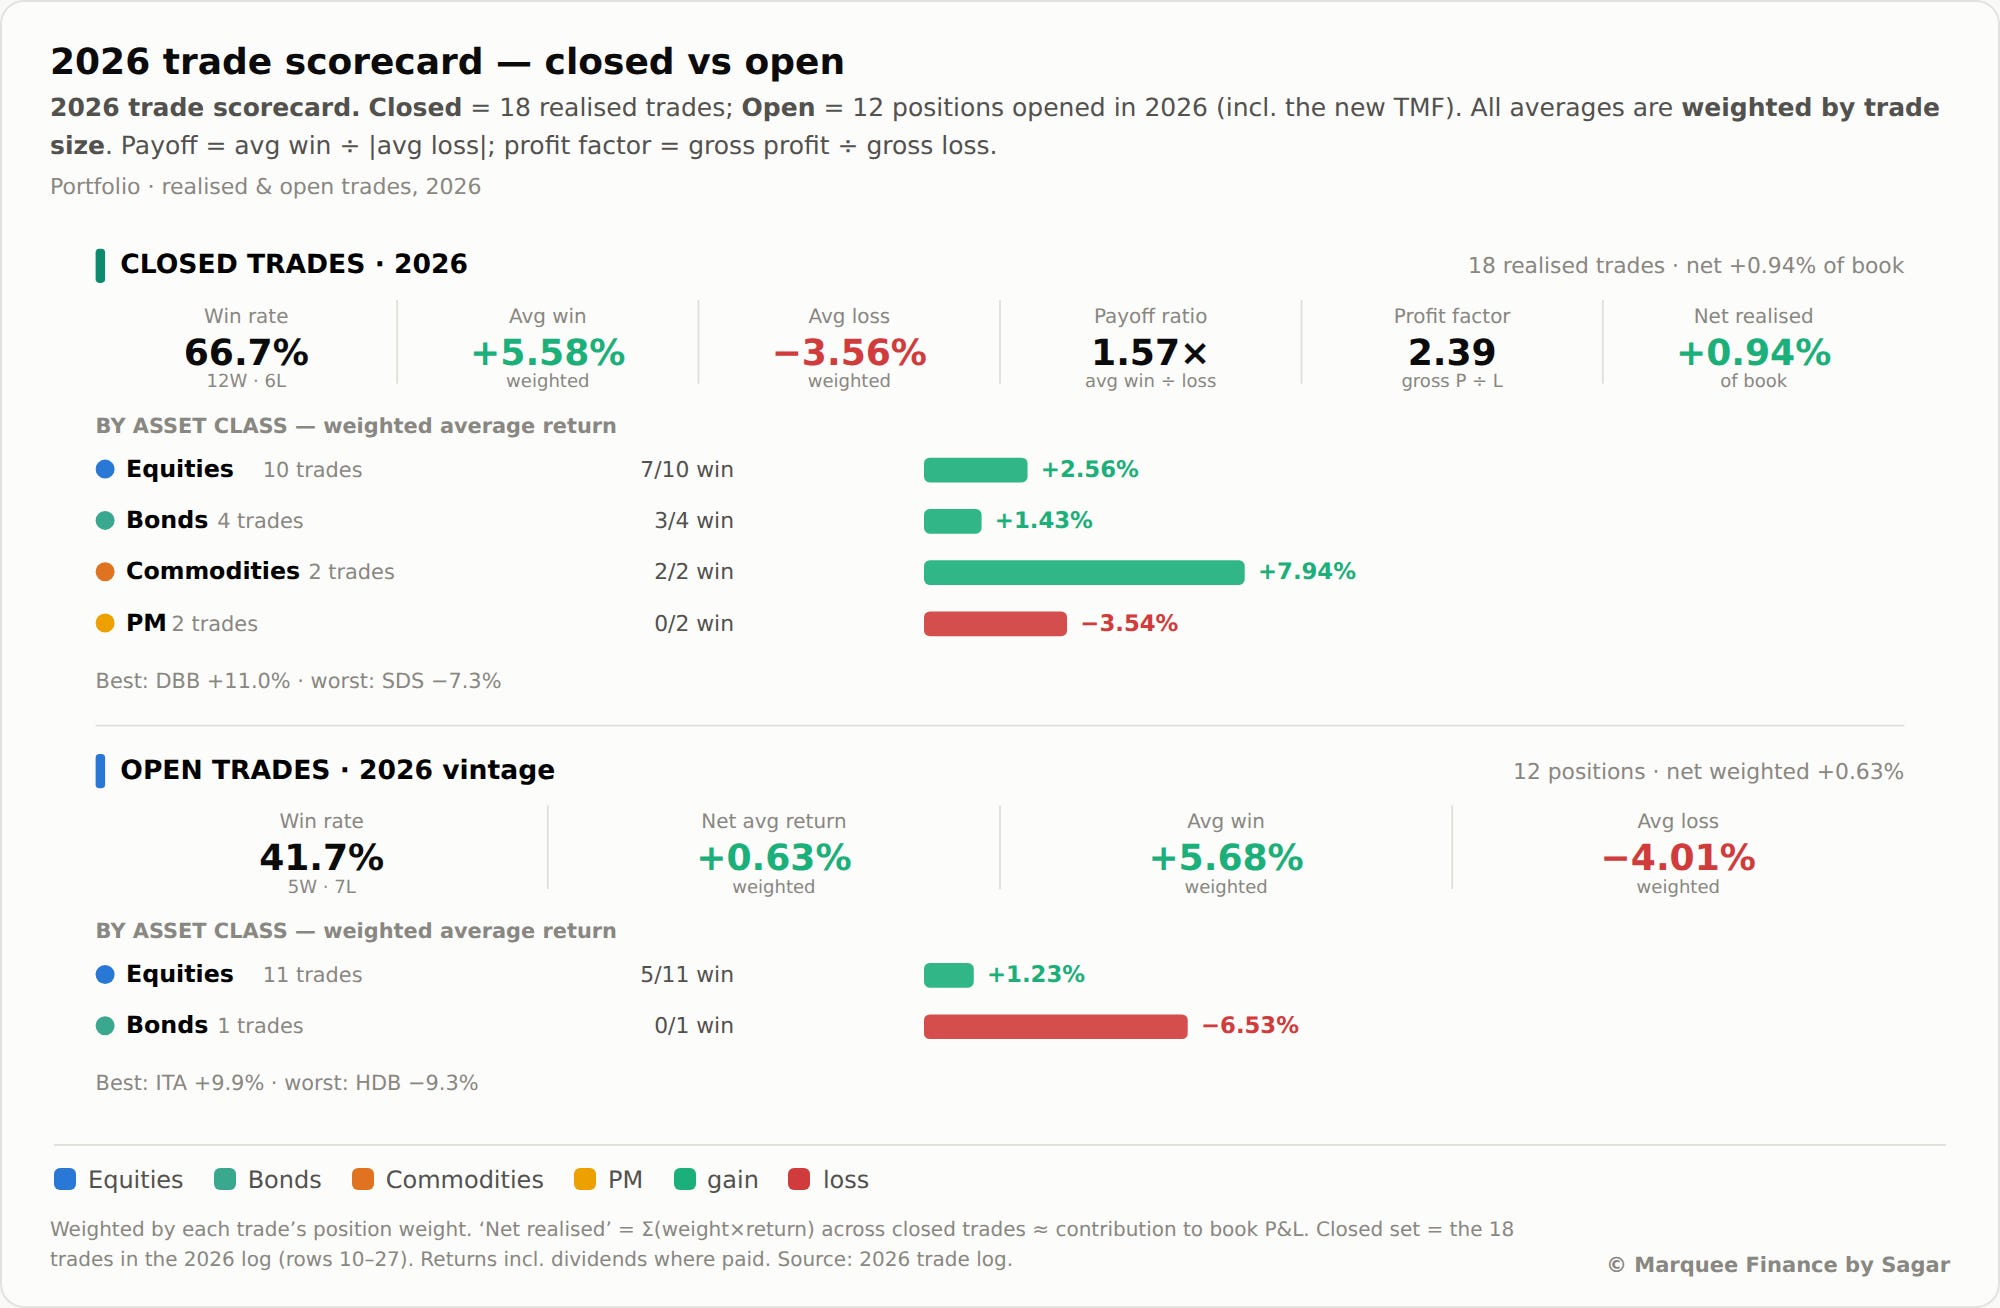
We took only 30 trades (18 closed, the rest open) due to extremely volatile news-driven markets.
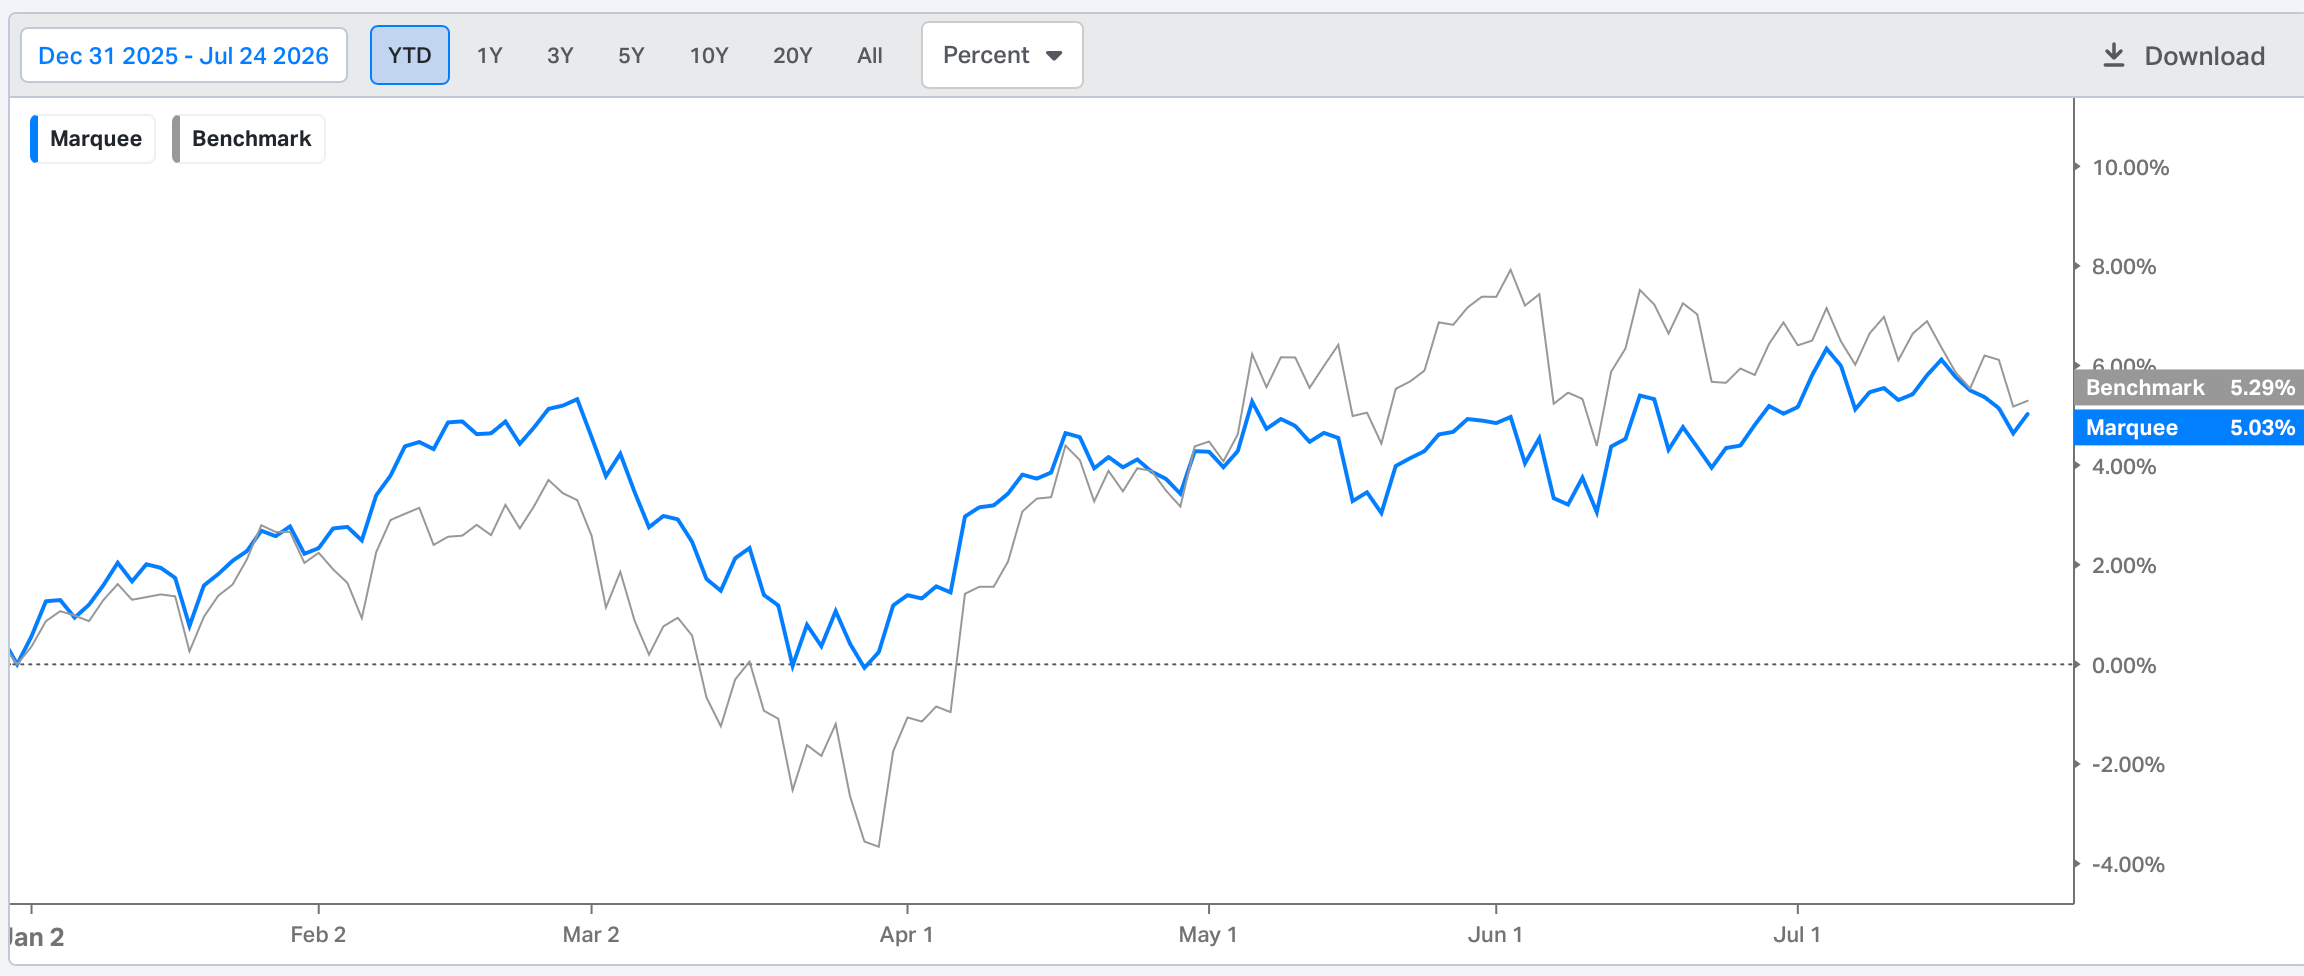
The PF is up 5.03% YTD against 5.29% for the benchmark.
Let’s take a deep dive into the macro universe and analyse the cross-asset markets.
Macro!
We have been working hard to fine-tune the US macro dashboard, and we have been successful.
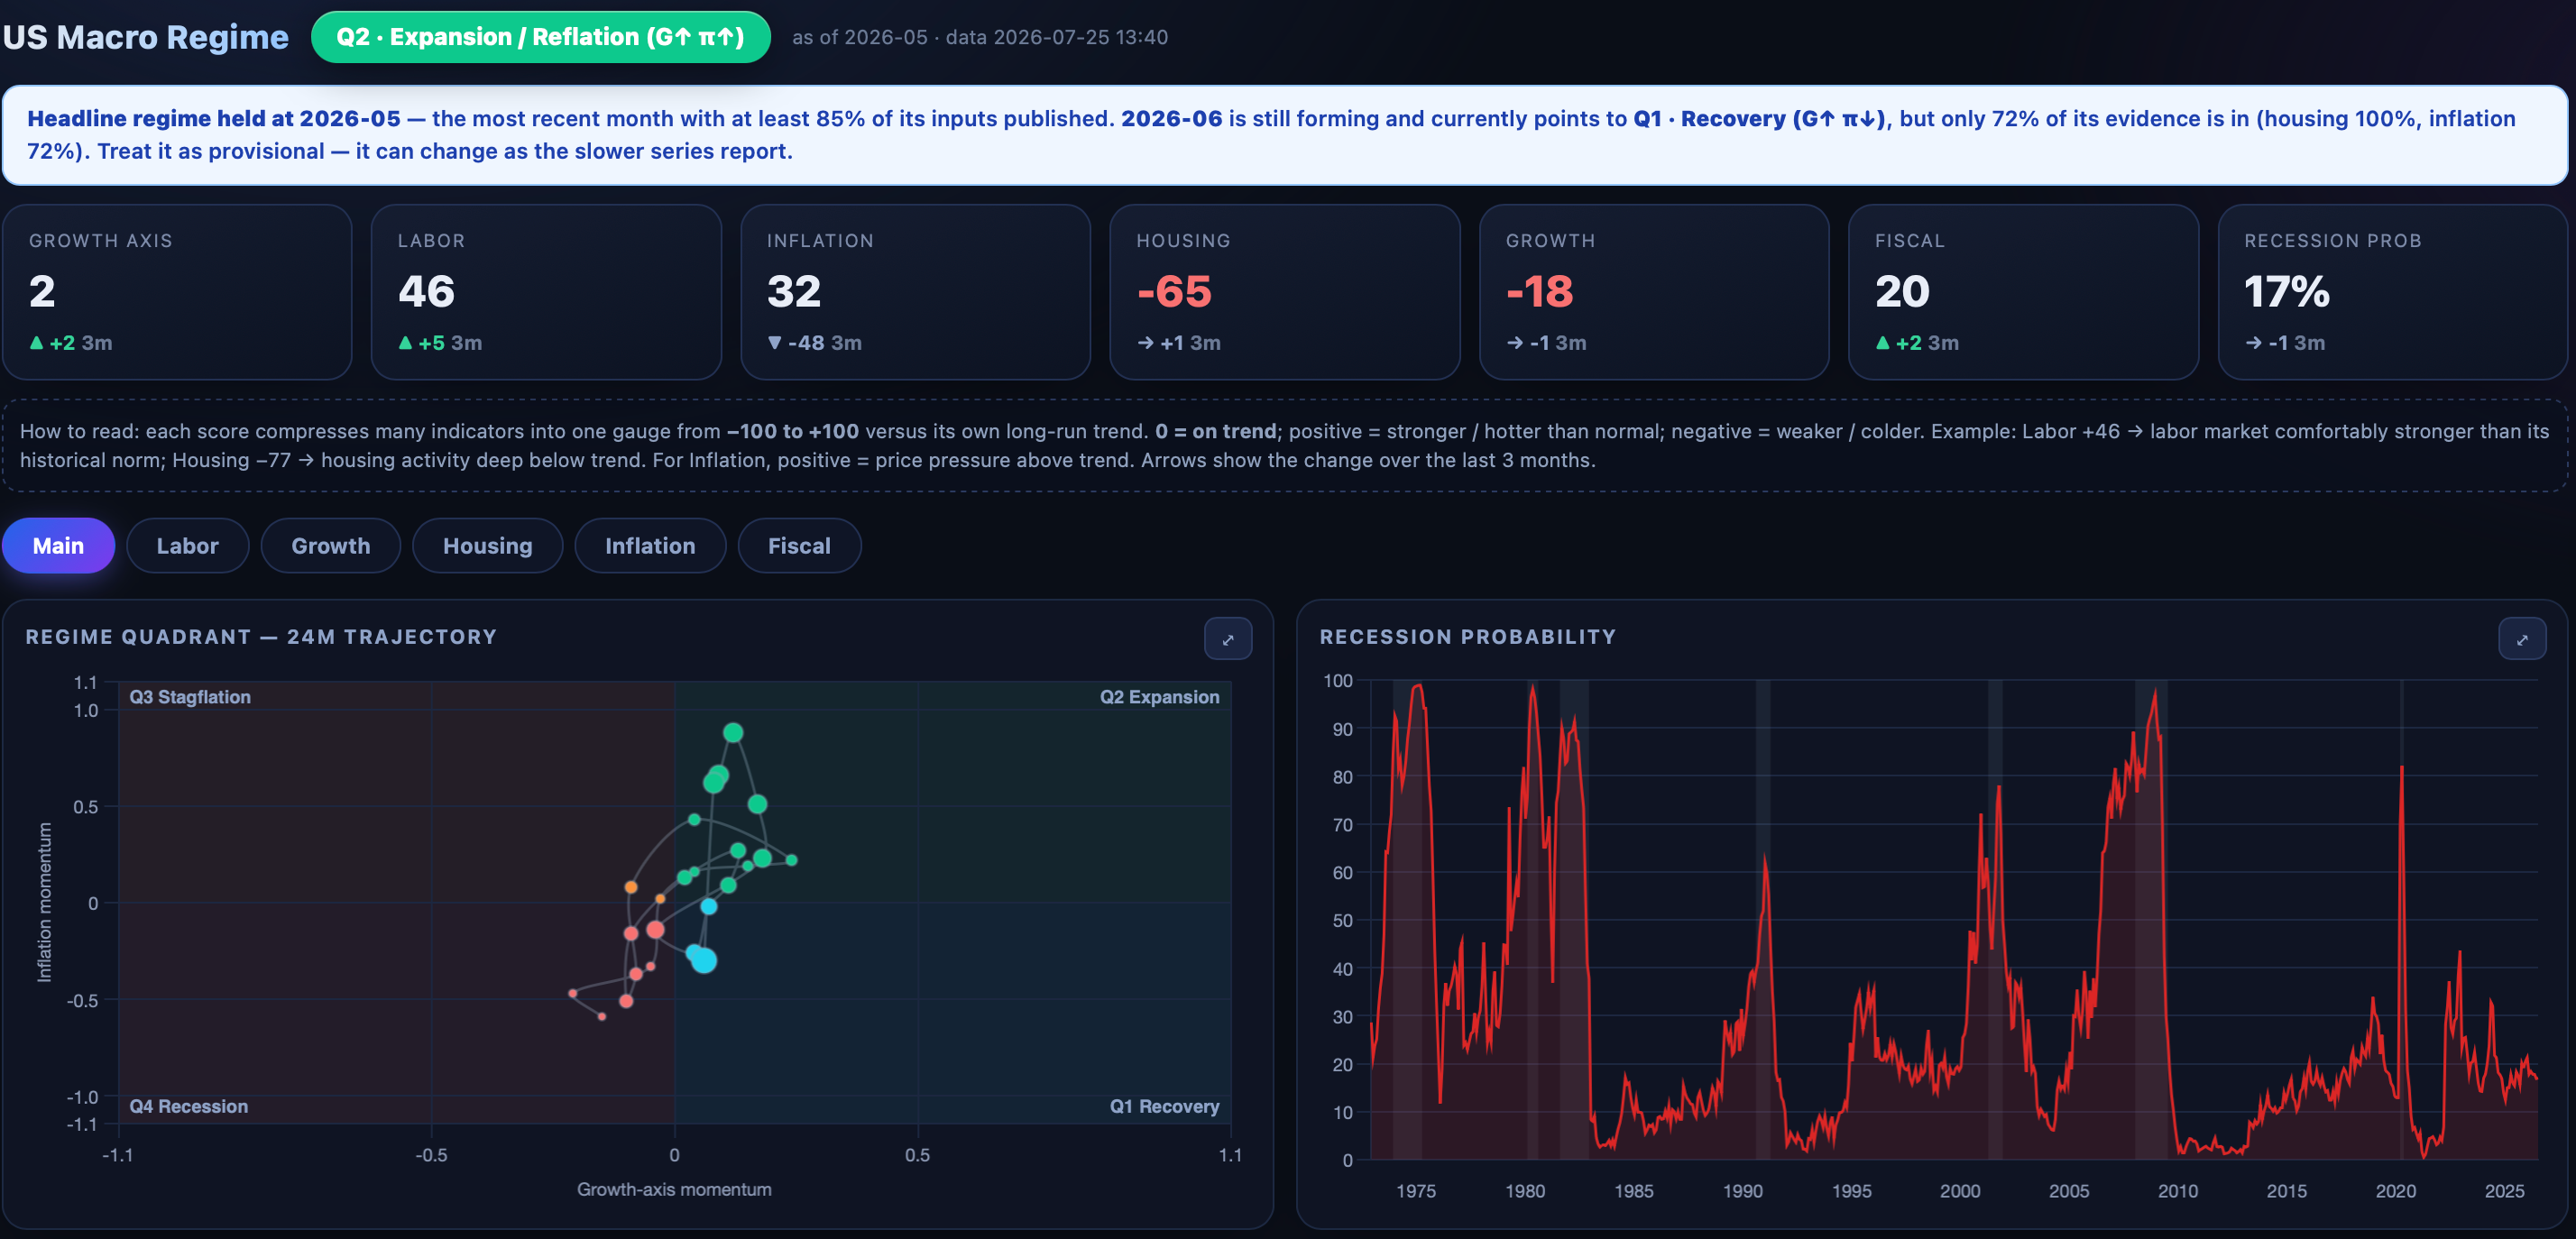
We also have real-time data factored into the dashboards; as a result, we have been witnessing some volatility, which has now been taken care of.
The recession gauge is fairly stable/low at 17%. The labour market is strong, while inflation has peaked.
We are in Quad 2, which is nothing but the “Goldilocks” scenario.
On the flip side, inflation has been falling faster than growth is fading.
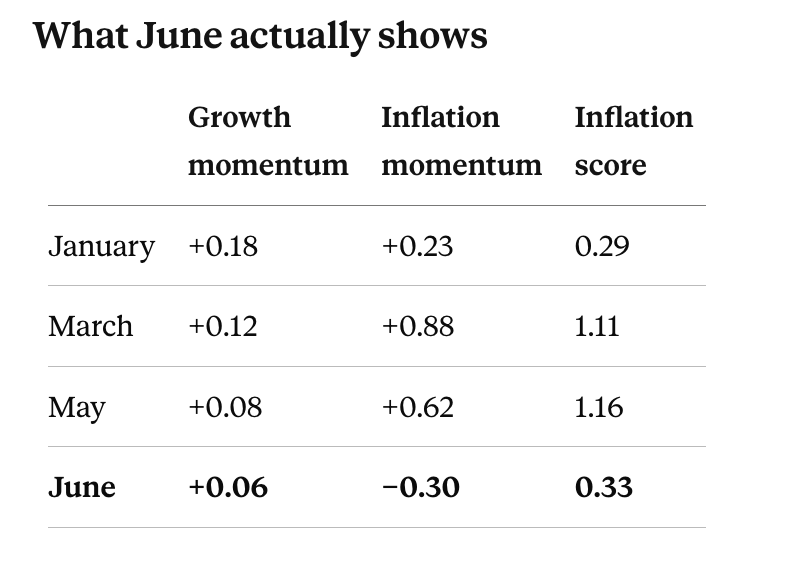
Note that these figures might change after next week’s PCE and GDP reports, but the trend remains the same unless we get a further rise in crude prices.
We have been writing for the past few months that ZEW will mean-revert, as it has in previous episodes of geopolitical turmoil.
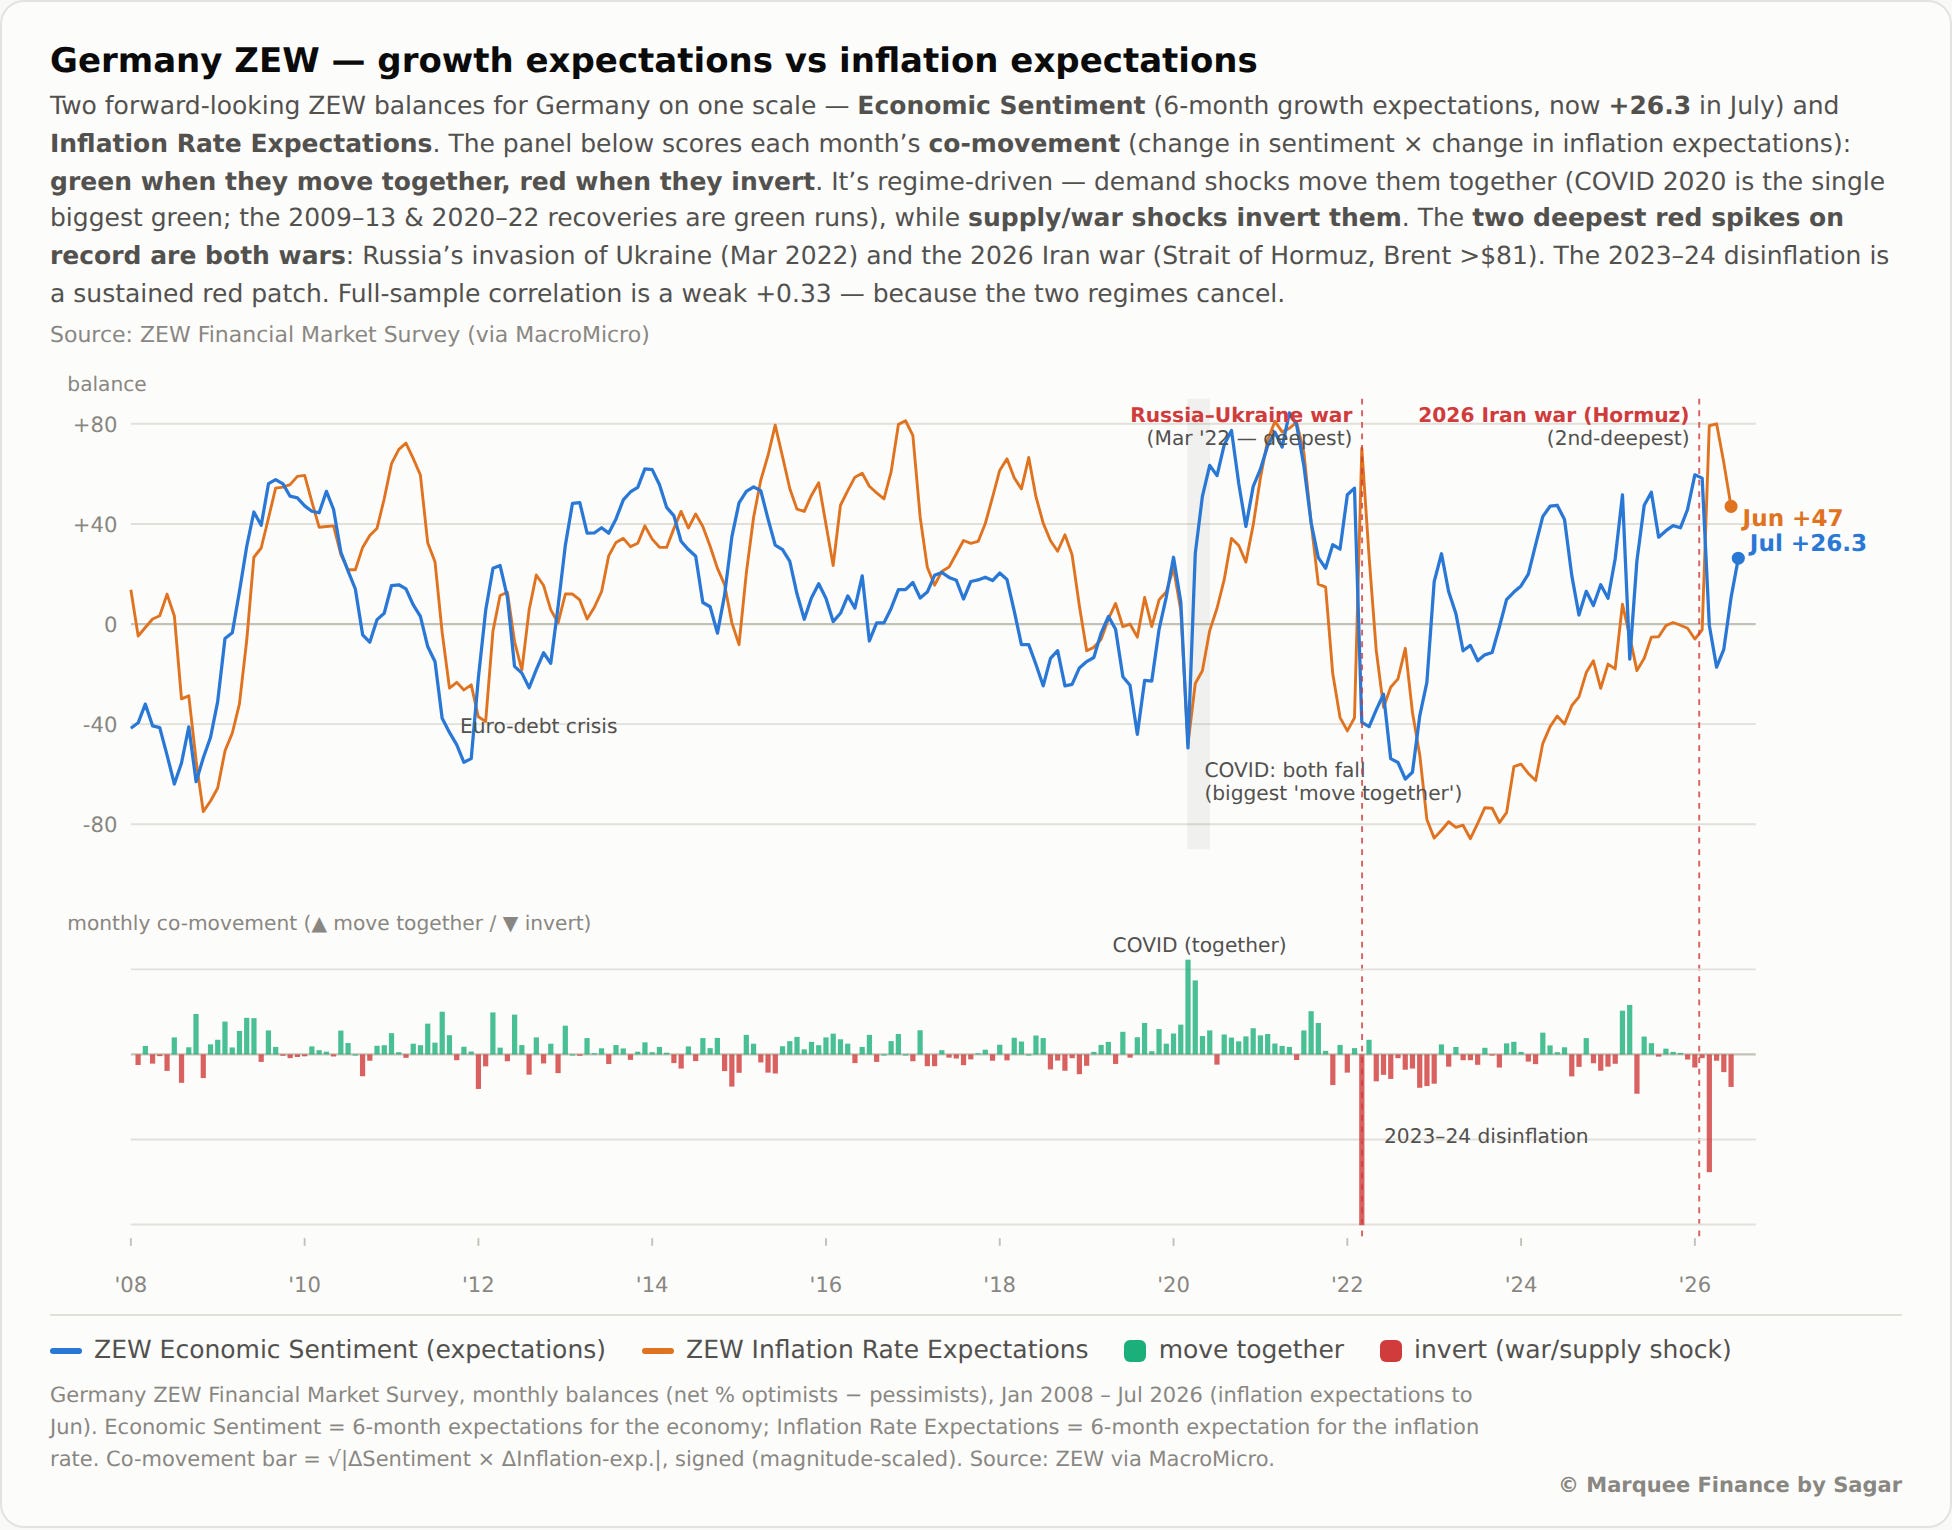
We expect the German “manufacturing” activity to pick up if there is no further escalation in the Middle East.
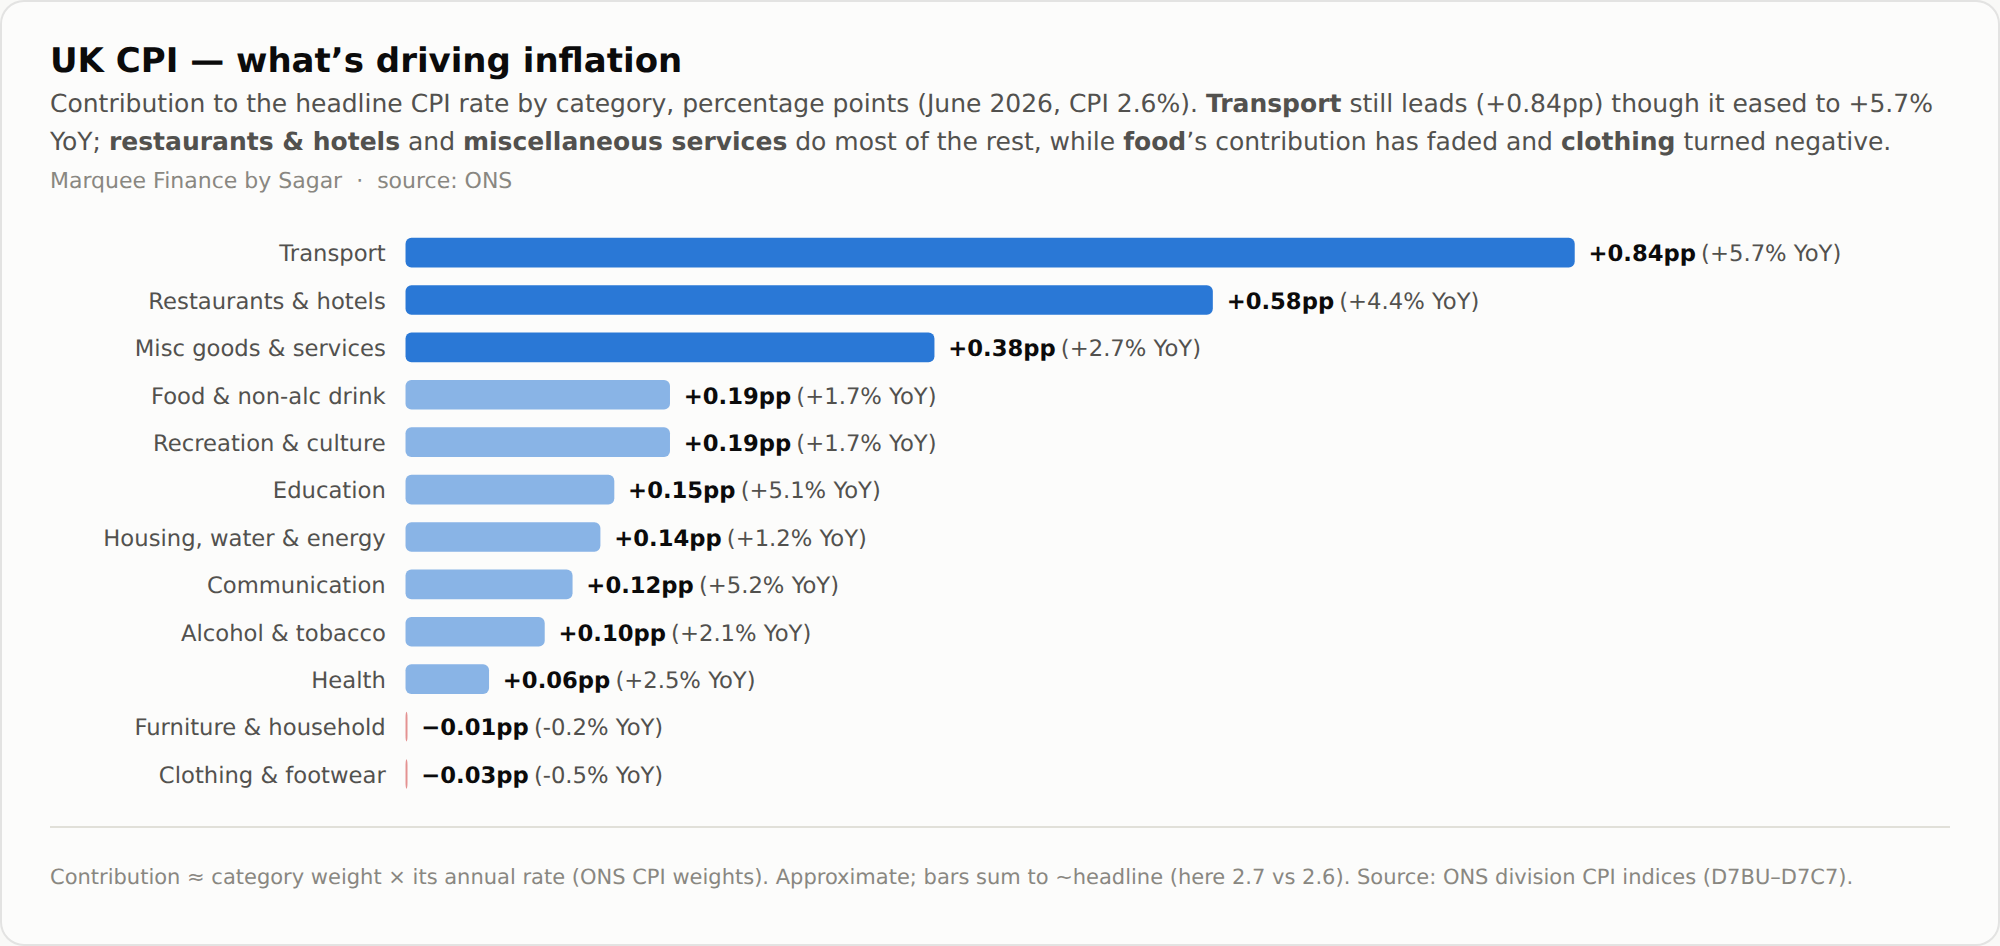
The UK Headline CPI came in at 2.6%, a 15-month low (10 bps lower than estimates).
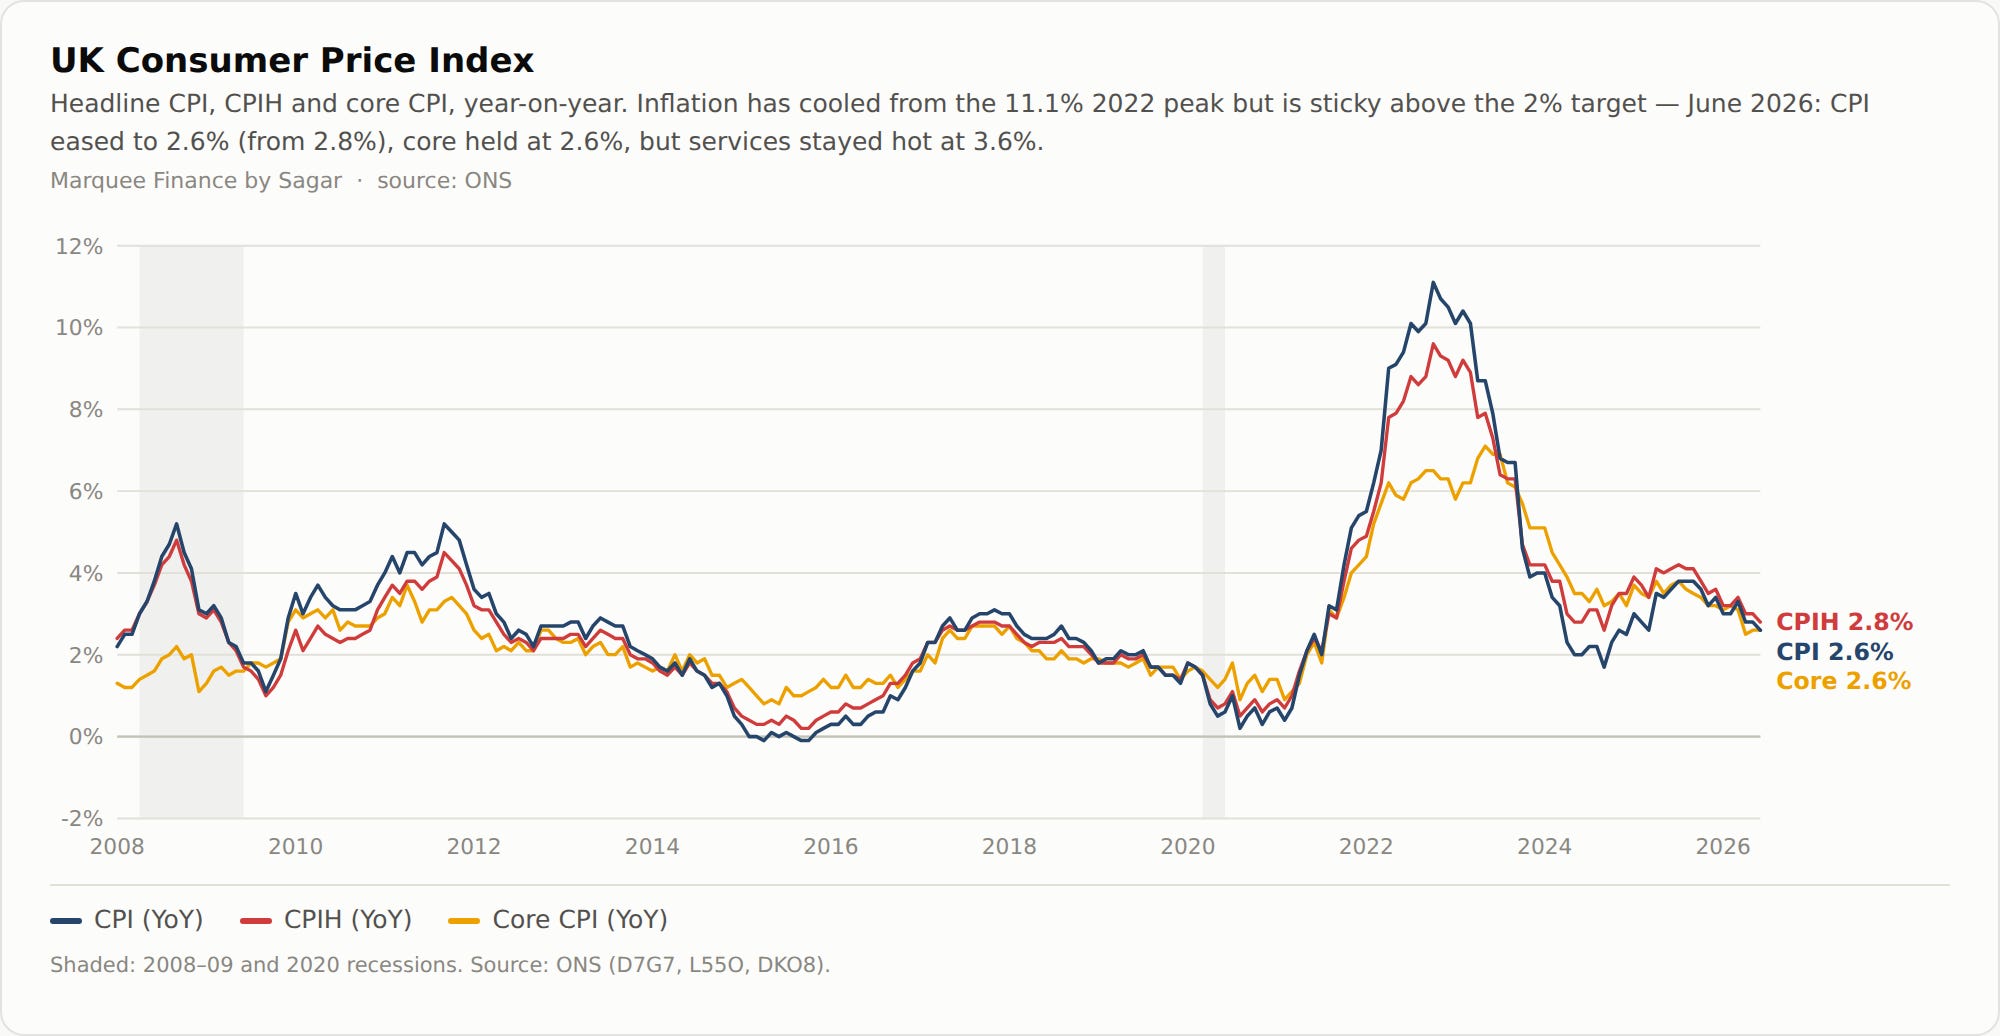
While the Core CPI also came in at 2.6% YoY, Services CPI was sticky at 3.6% YoY.
There was softness in MoM numbers in Petrol, Diesel and Clothing.
However, when we look at the YoY data, Transport still leads while Clothing was subdued due to higher discounts and food was dragged down by chocolate prices.
We also got the UK’s labour market data.
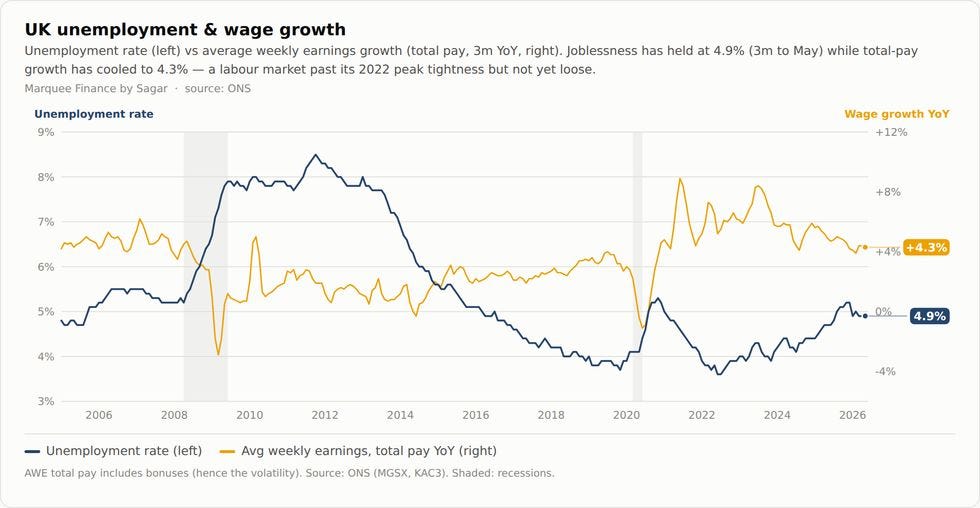
After significant deterioration in the labour market last year, there are signs of stabilisation in the UK’s labour market.
The Unemployment Rate came in at 4.9%, a tad below estimates (5%) and wage growth came in at 4.3% (signs of bottoming out).
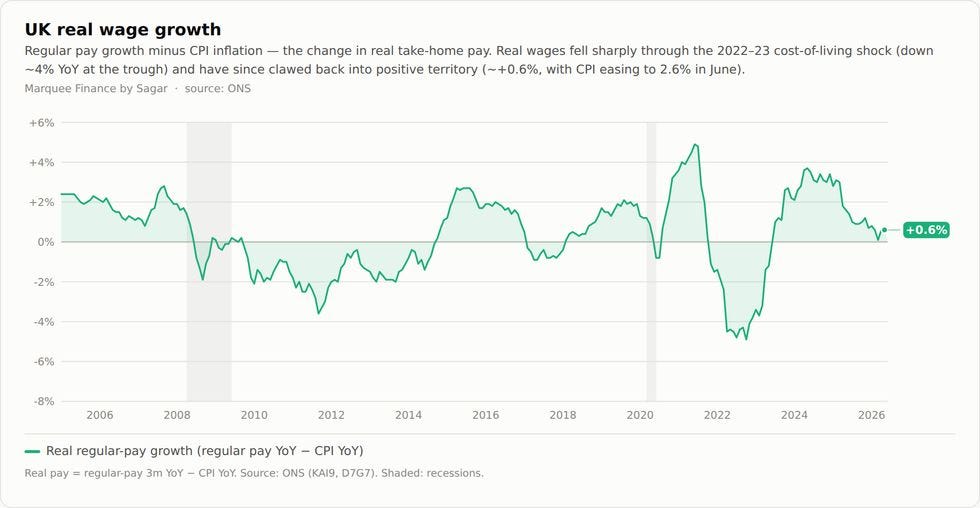
What we closely track is the real wage growth (adjusted for inflation), which is holding out but is on the verge of turning negative.
In 2022, negative wage growth didn’t create havoc because consumers were flush with the excess savings from the pandemic, but today, negative wage growth, if it transpires, will be a drag on consumption and will lead to a recession in the UK.
We also got the Claimant Count and Vacancy ratio.
Both indicators were stable after the drastic move last year.
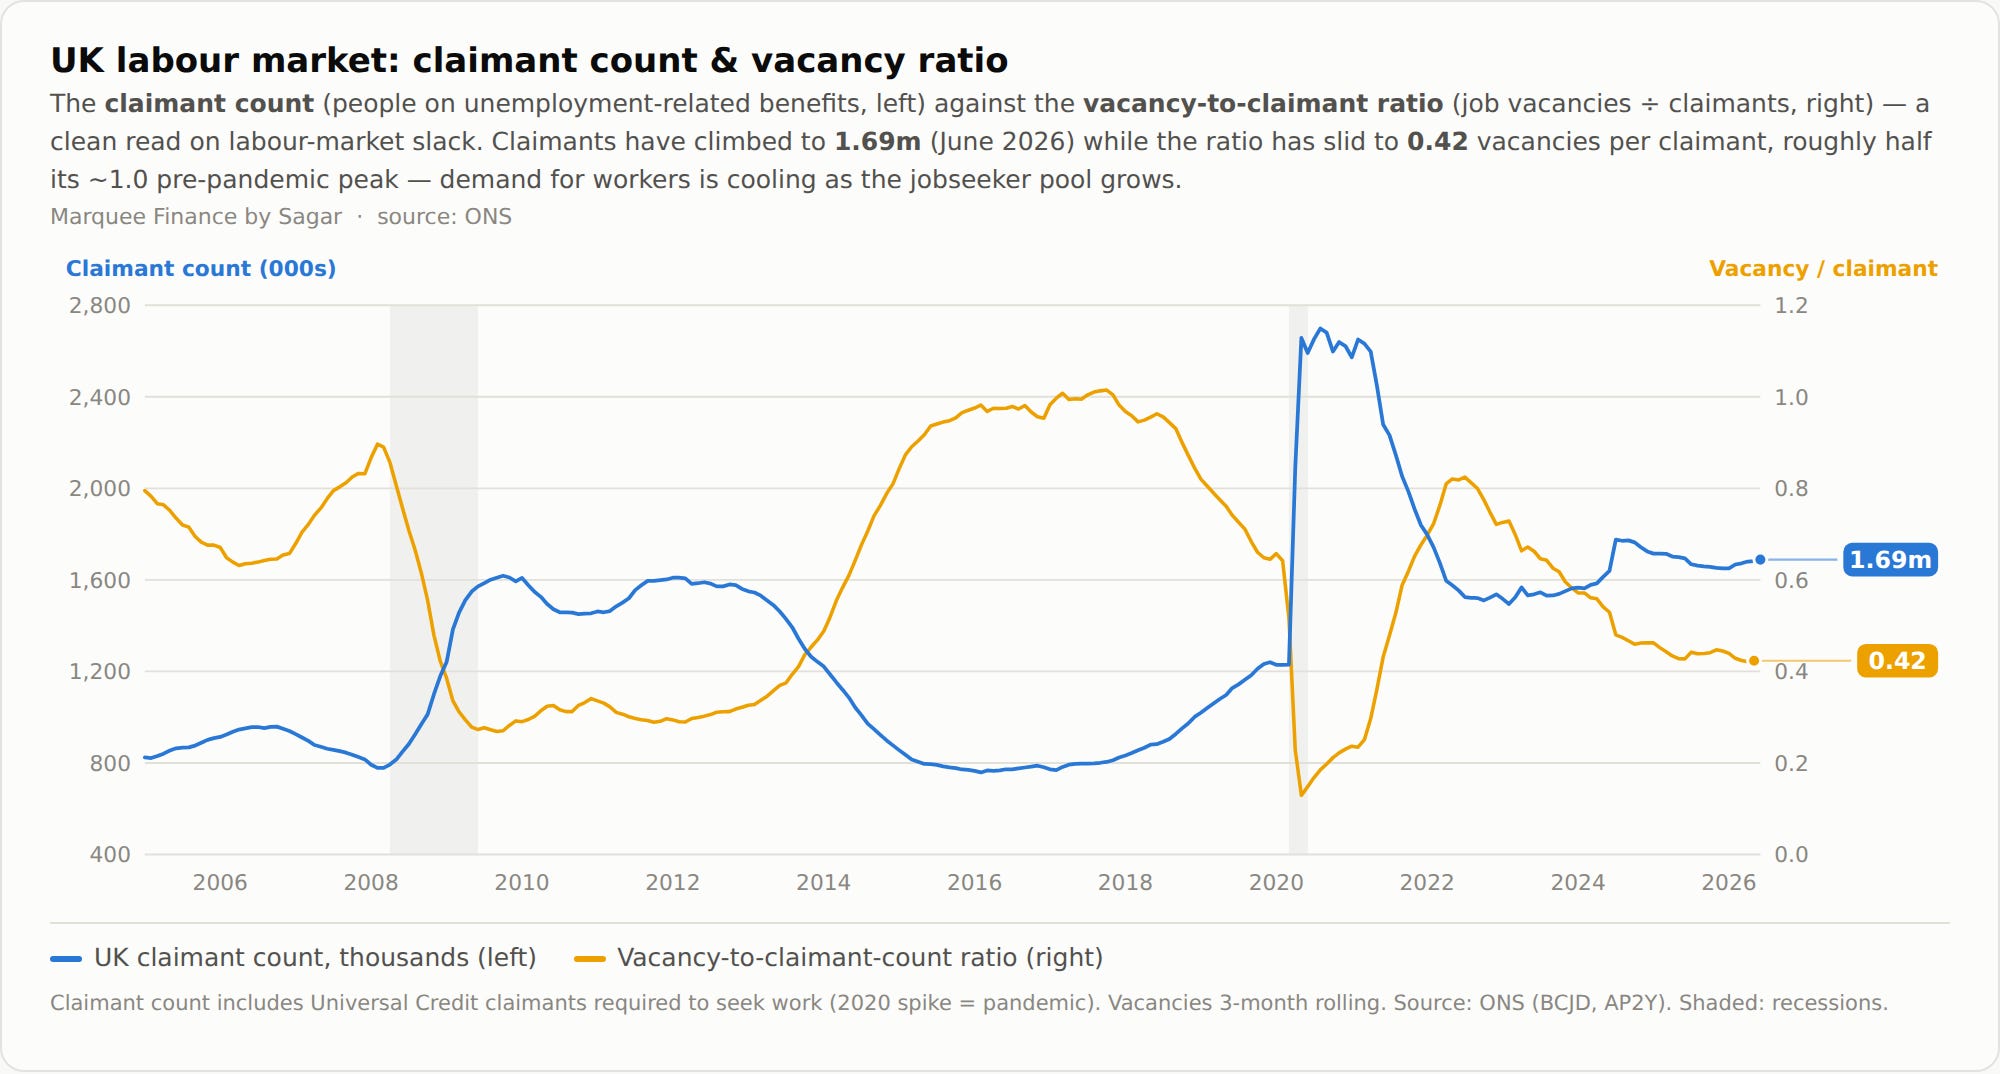
There are no signs of concern yet, but we will keep a close track of the indicators to gauge the health of the UK’s labour market.
Our Japan Macro Dashboard is also ready.
The land of the rising sun is witnessing strong growth momentum led by the AI boom (buoyant exports) and resilient domestic consumption.
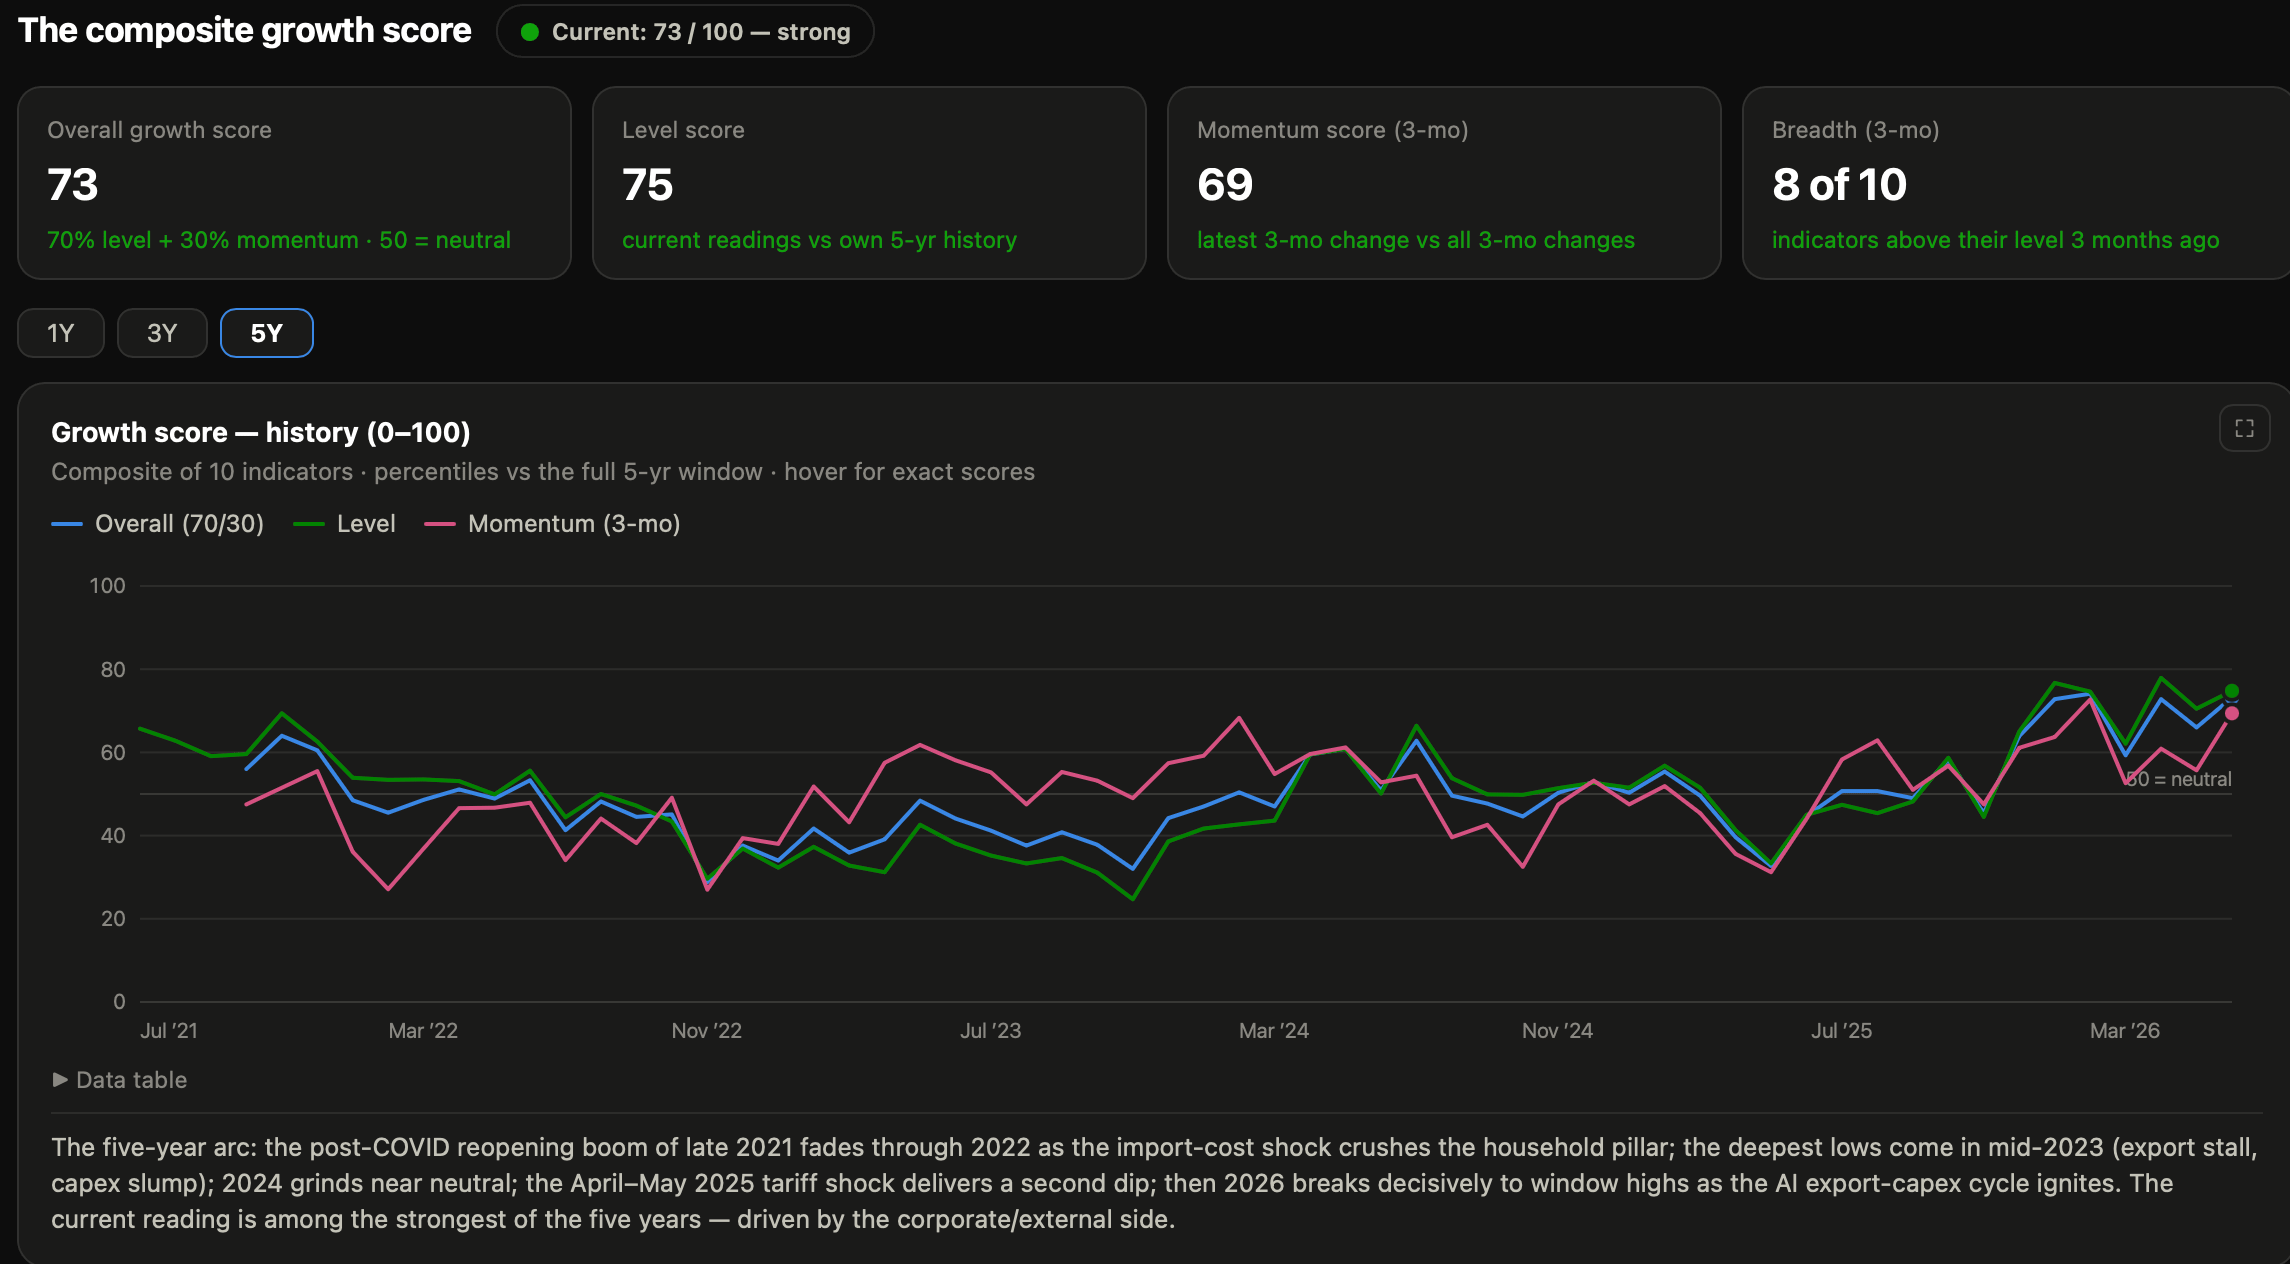
Furthermore, loose fiscal policy and negative real rates (despite BOJ hikes) are supporting the economy.
Equities!
We have built the proprietary US Greed and Fear, aka the Equity Sentiment Index.
It is a bit different from your traditional CNN Greed and Fear index and other indices, as it doesn’t switch frequently to the extreme greed and fear readings.
It takes into account 7 inputs, and as per the latest figure, we are below the median, and the reading is neutral.
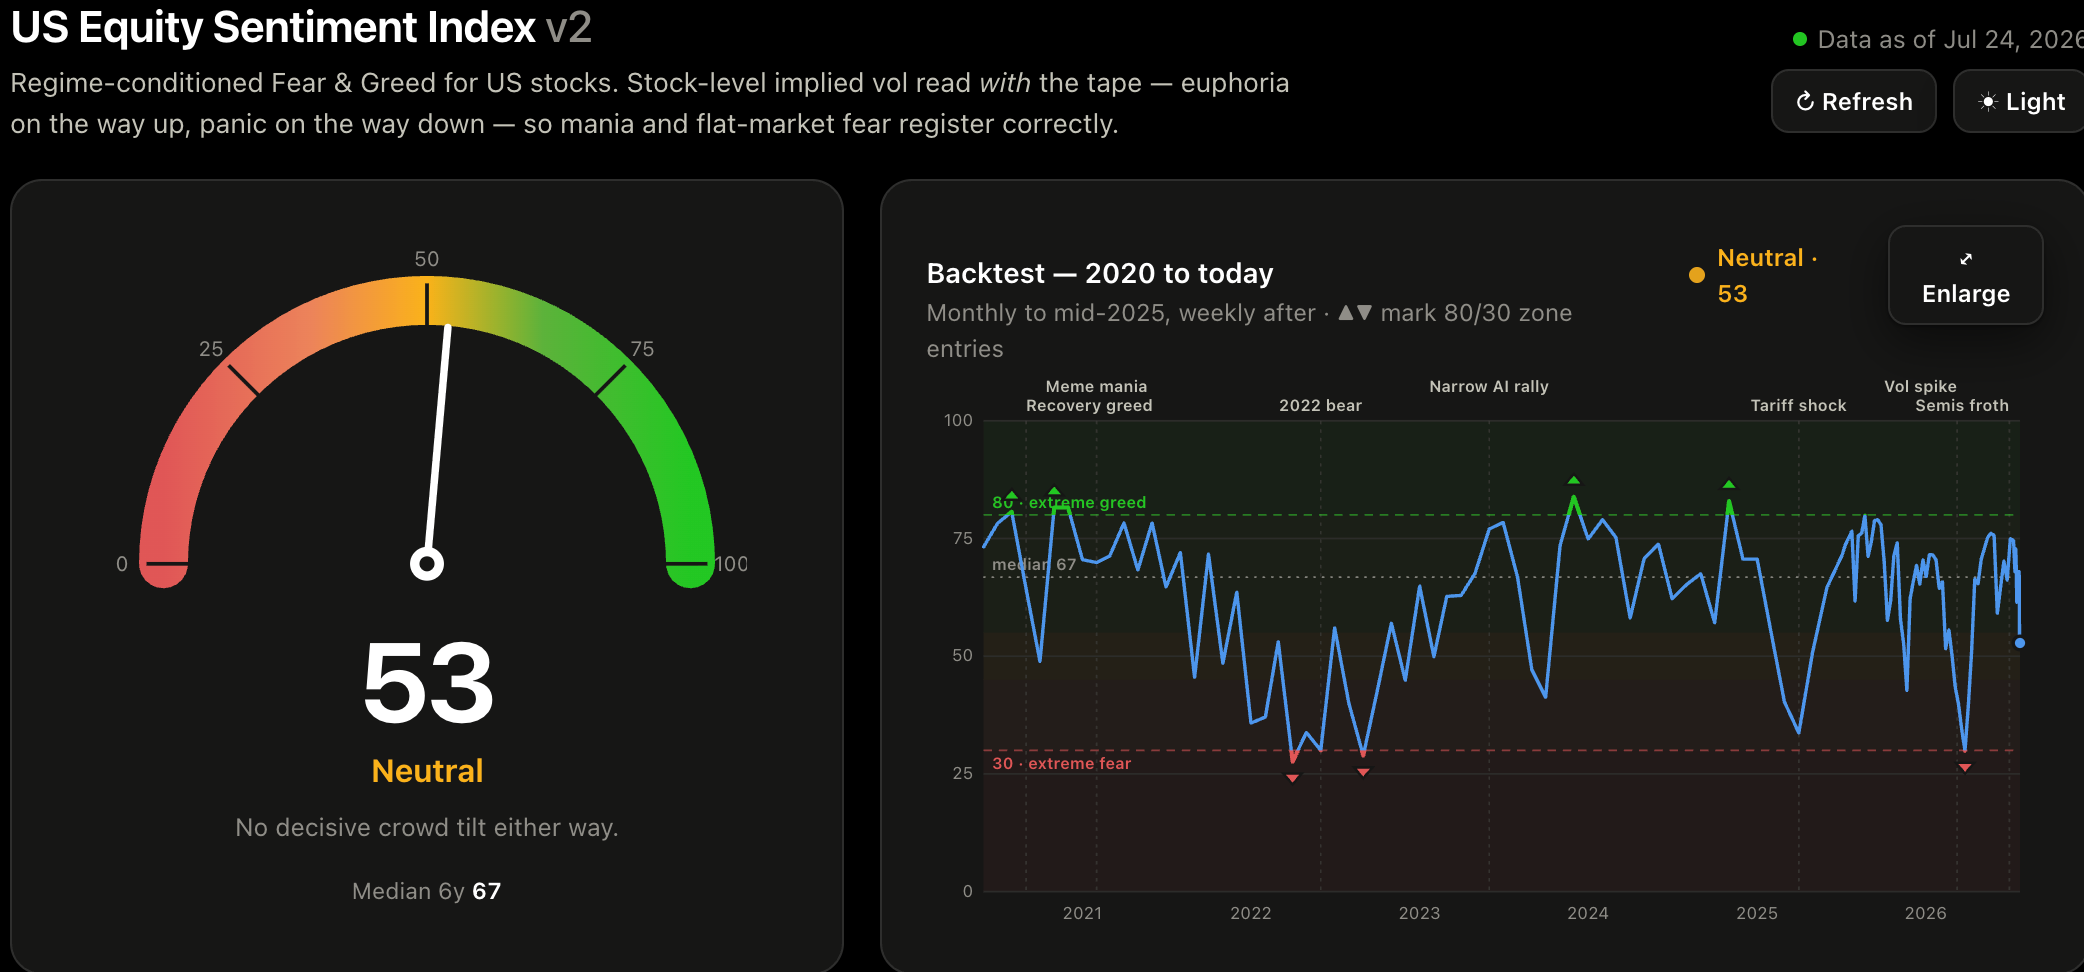
We are still not in the “fear zone,” but we are now not in the greed/euphoric zone due to the momentum meltdown in the last few weeks.
While value (IVE) has been up 2.5% since 1st July, the MTUM/SPY is down 6%.
Even small-caps have outperformed the growth factor.
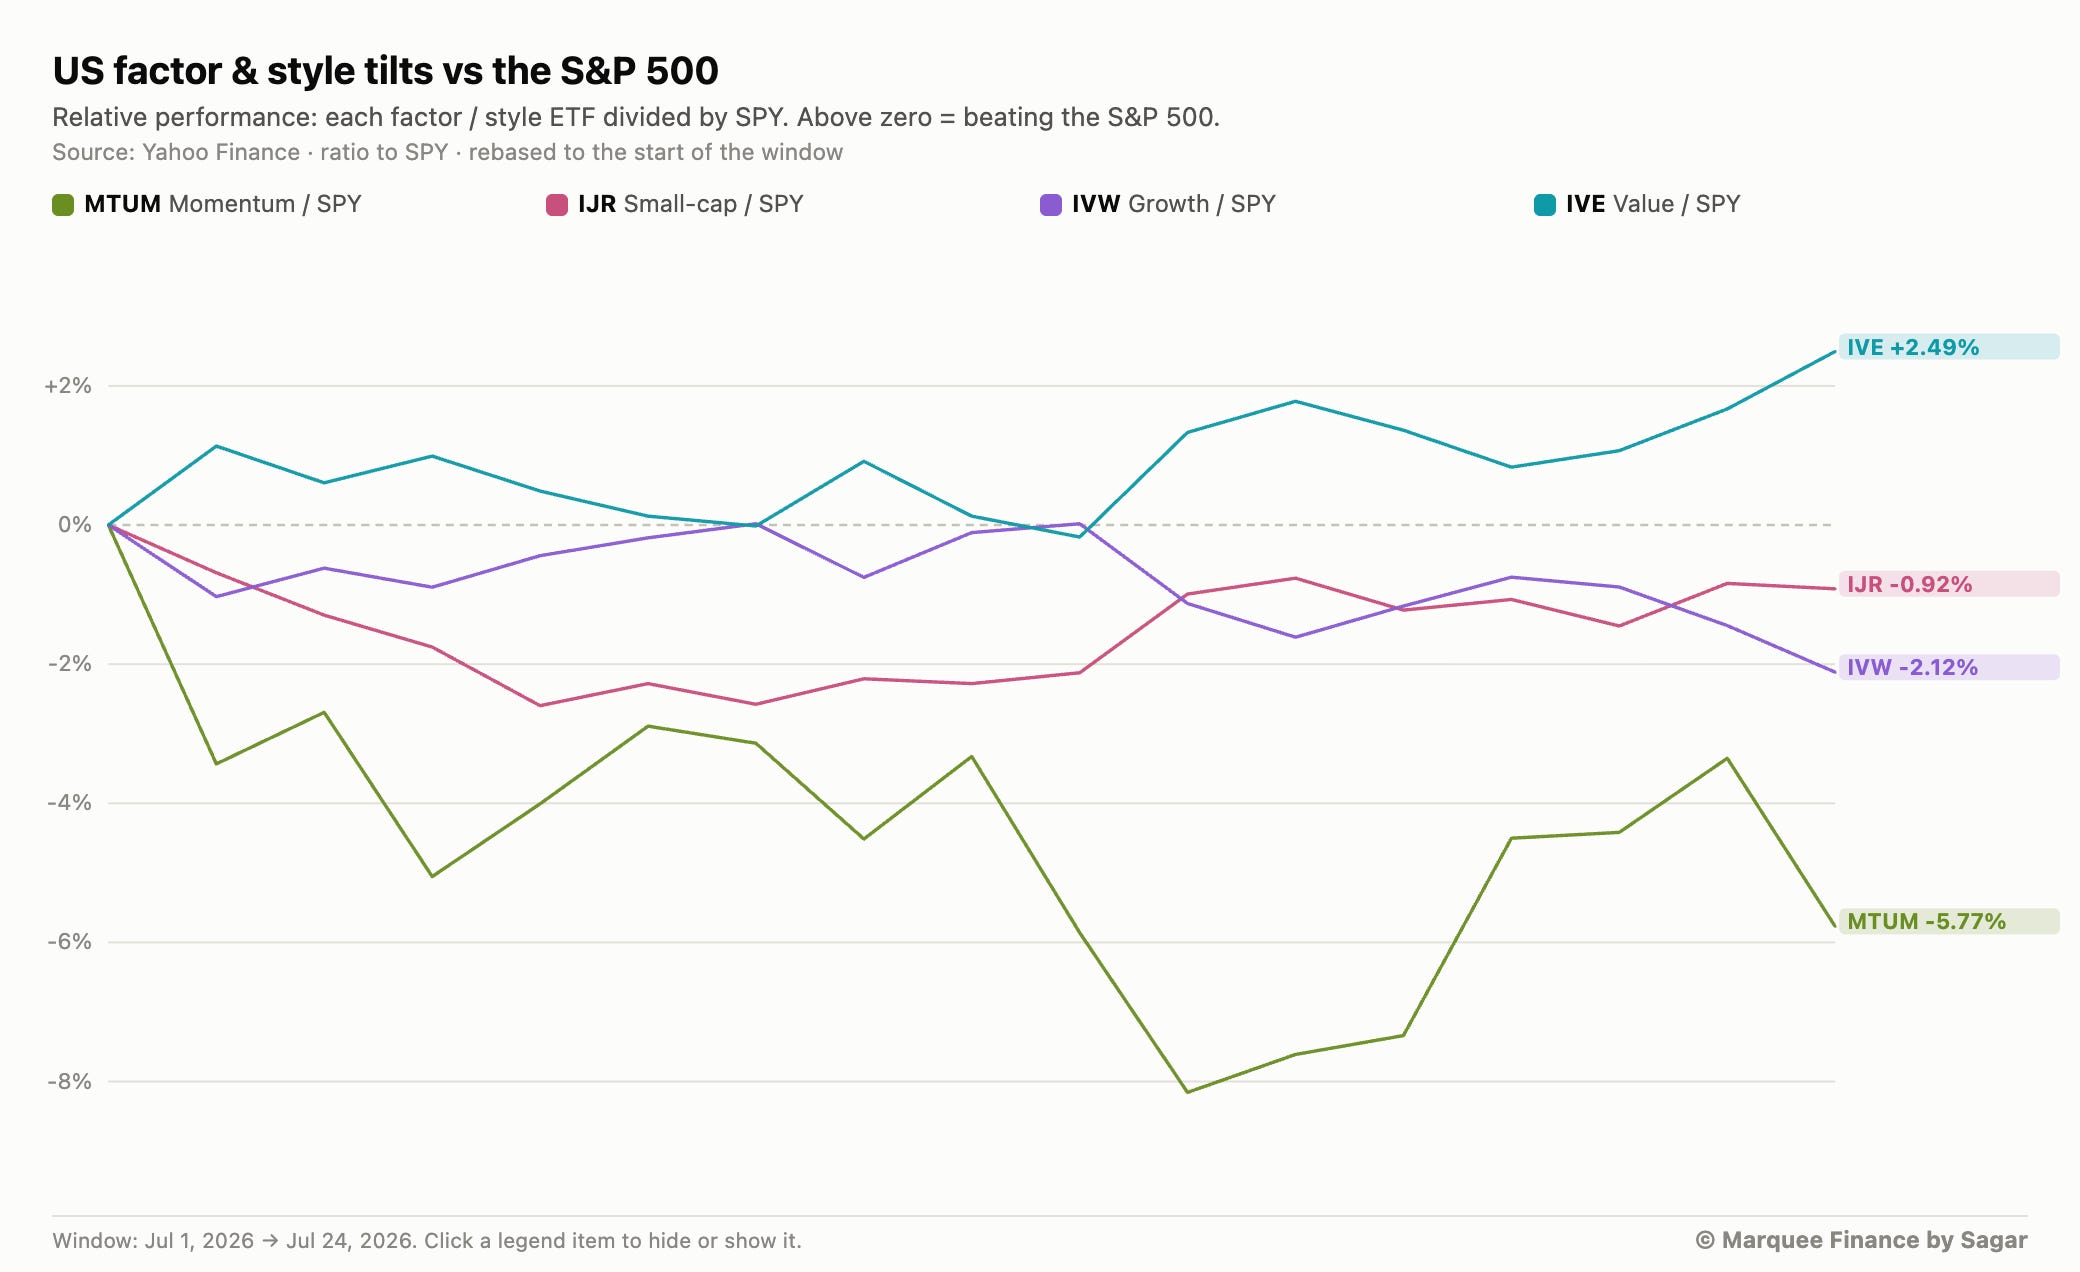
It has been absolute carnage out there, especially for the leveraged retail crowd.
Everybody has been long the semiconductor trade, which is now on the verge of entering a bear market.
Unsurprisingly, the current market setup is remarkably similar to 2022 when the tech bear market created opportunities in other sectors.
We are positioned to maximise this opportunity.
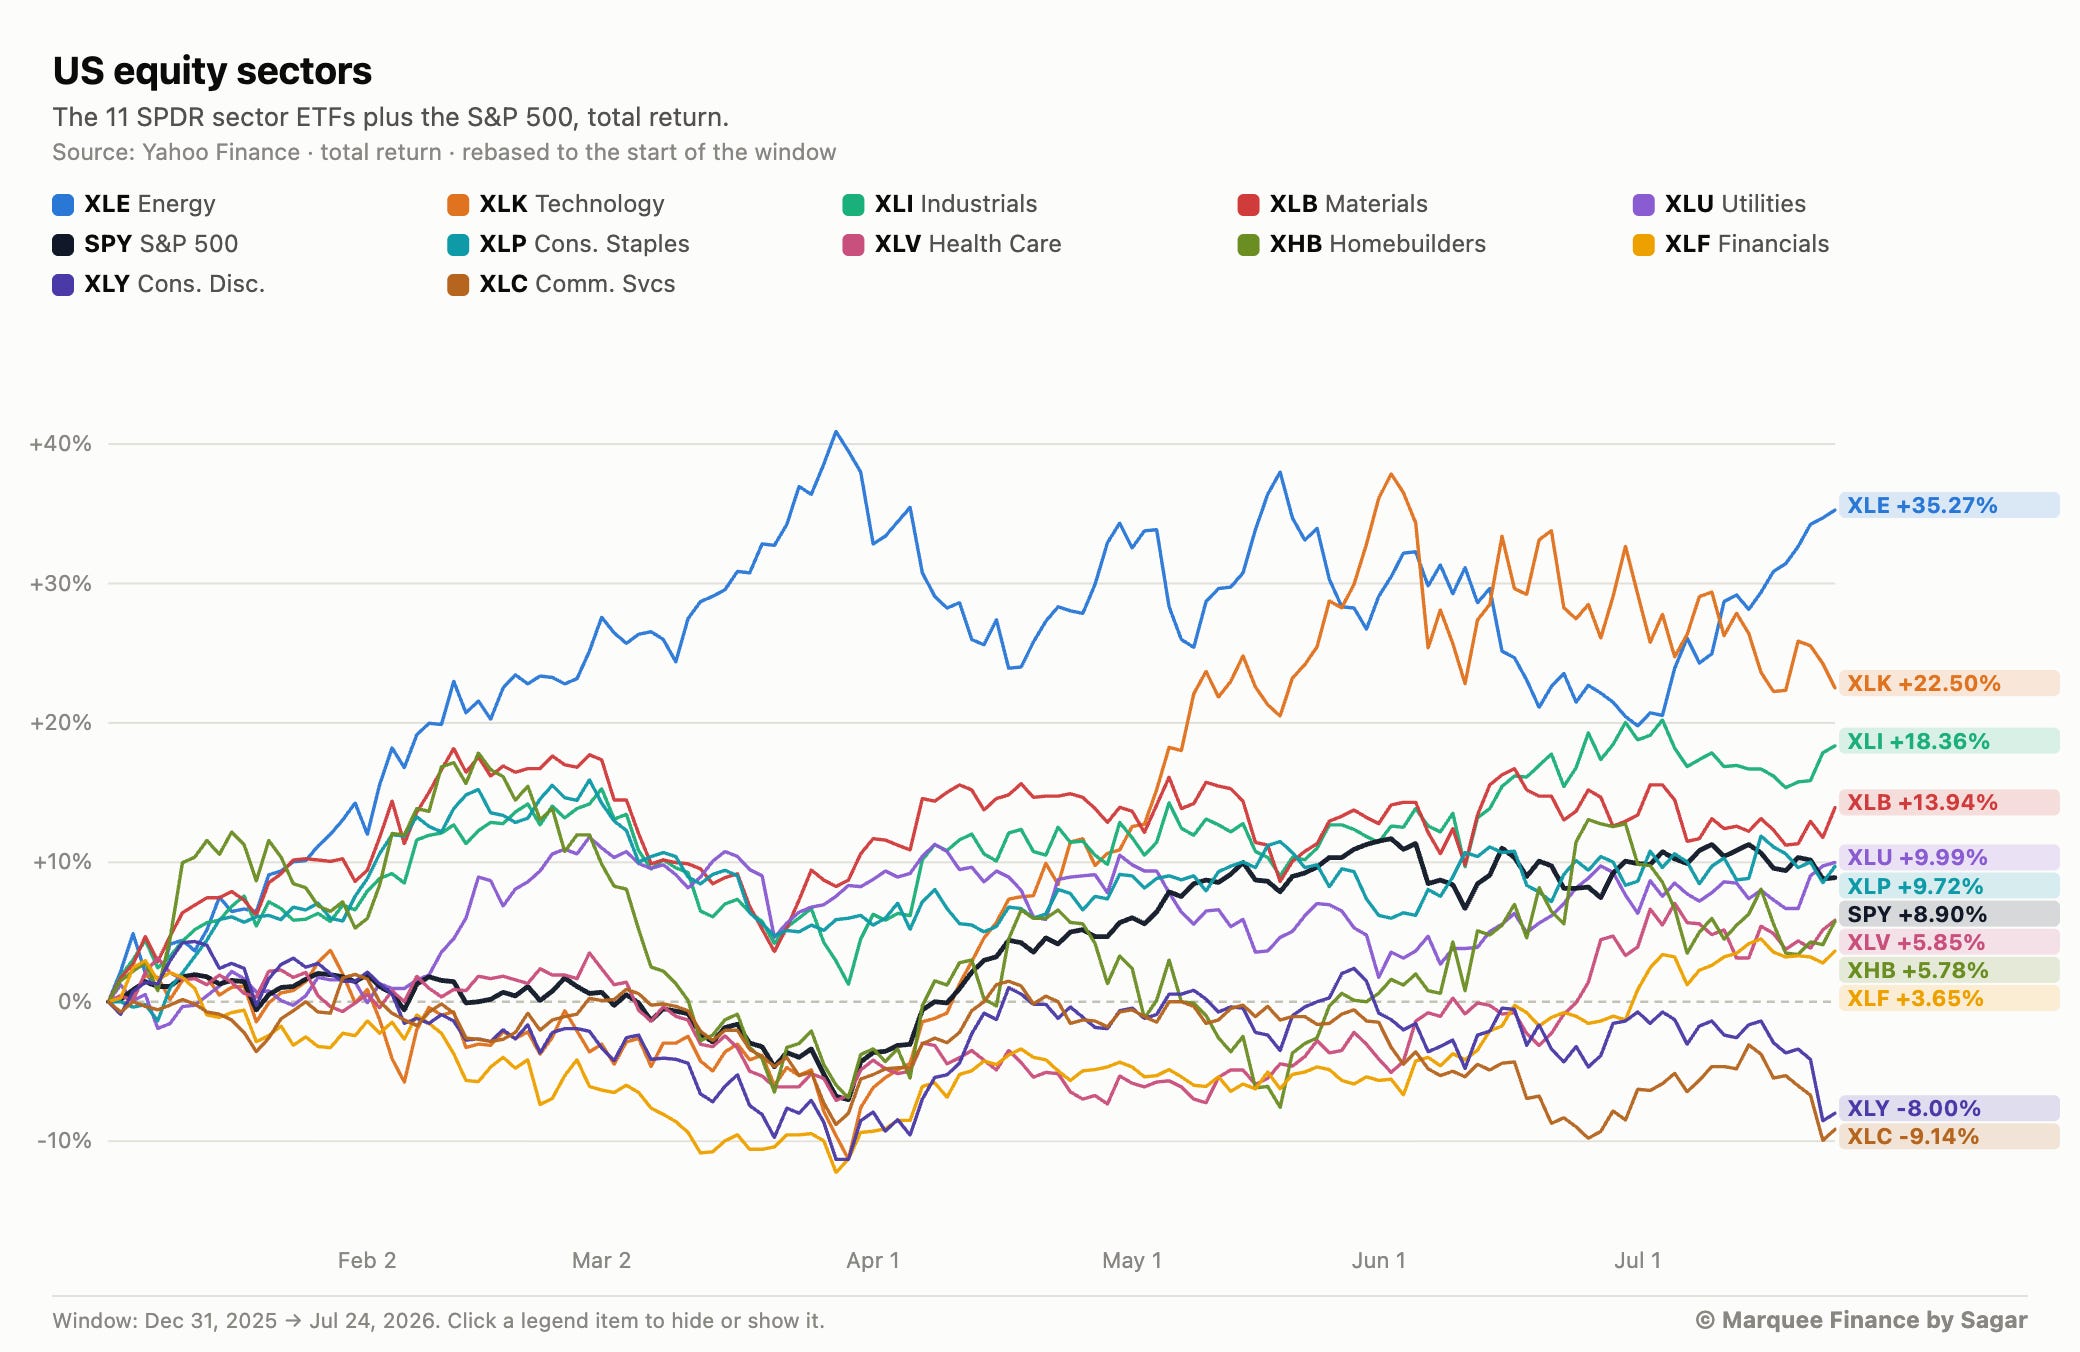
XLE, XLI and XLB have been the top performers (excluding XLK as it was all semis there).
Our positioning as of today is as follows: