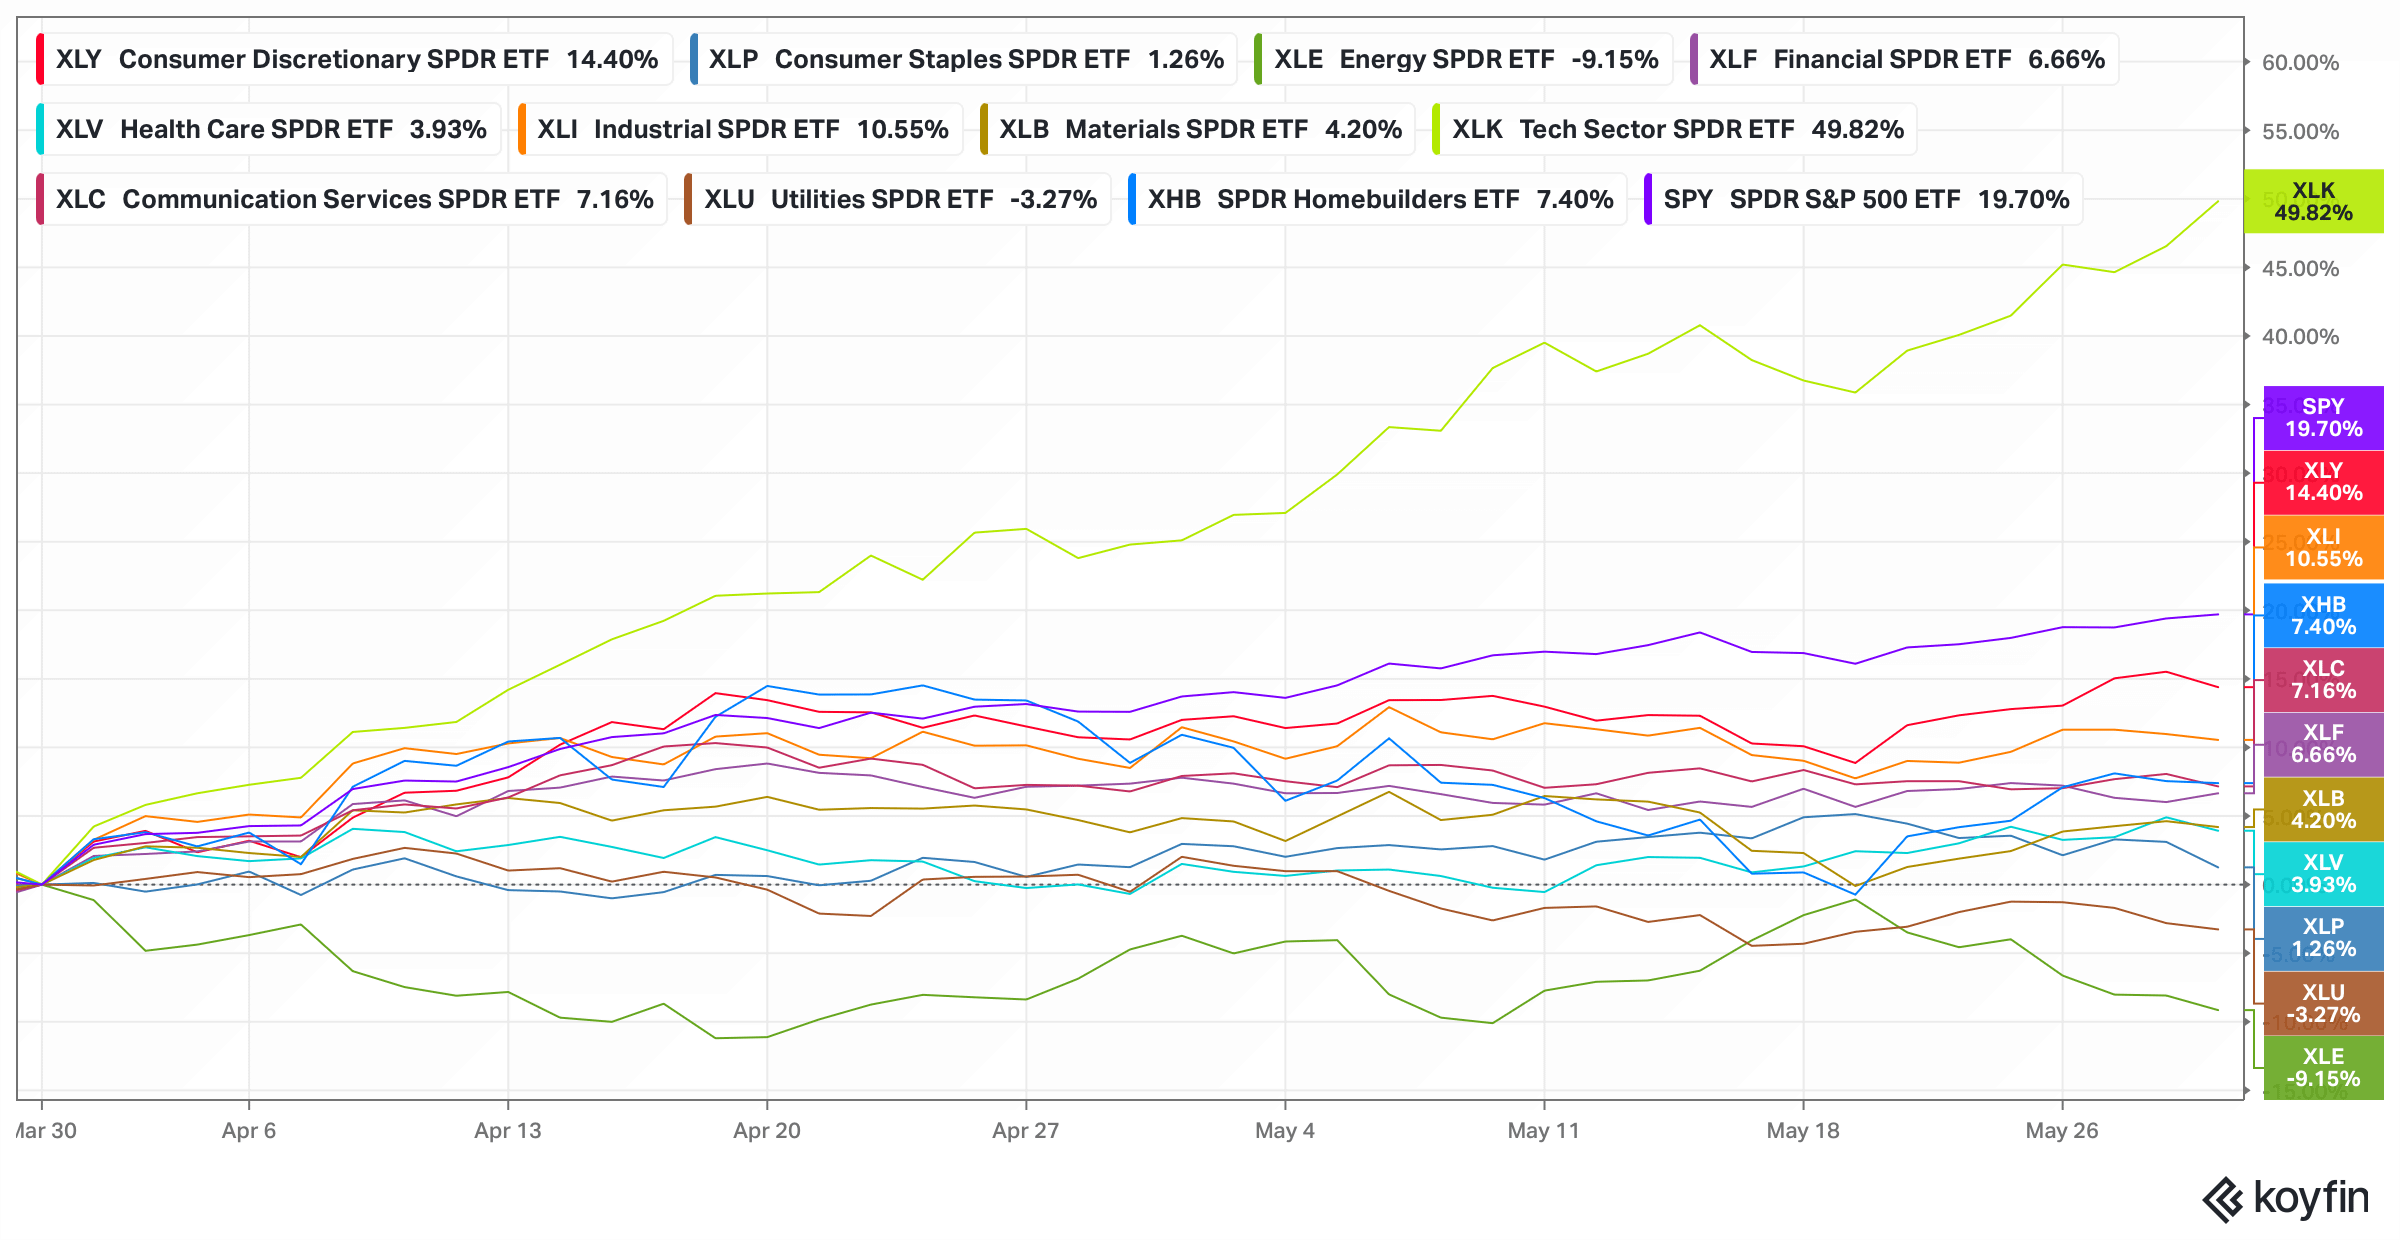
2026 is turning out to be a year of bubbles!
In January this year, we warned our paid subscribers about irrational exuberance in precious metals as the technicals became extremely overheated and sentiment euphoric.
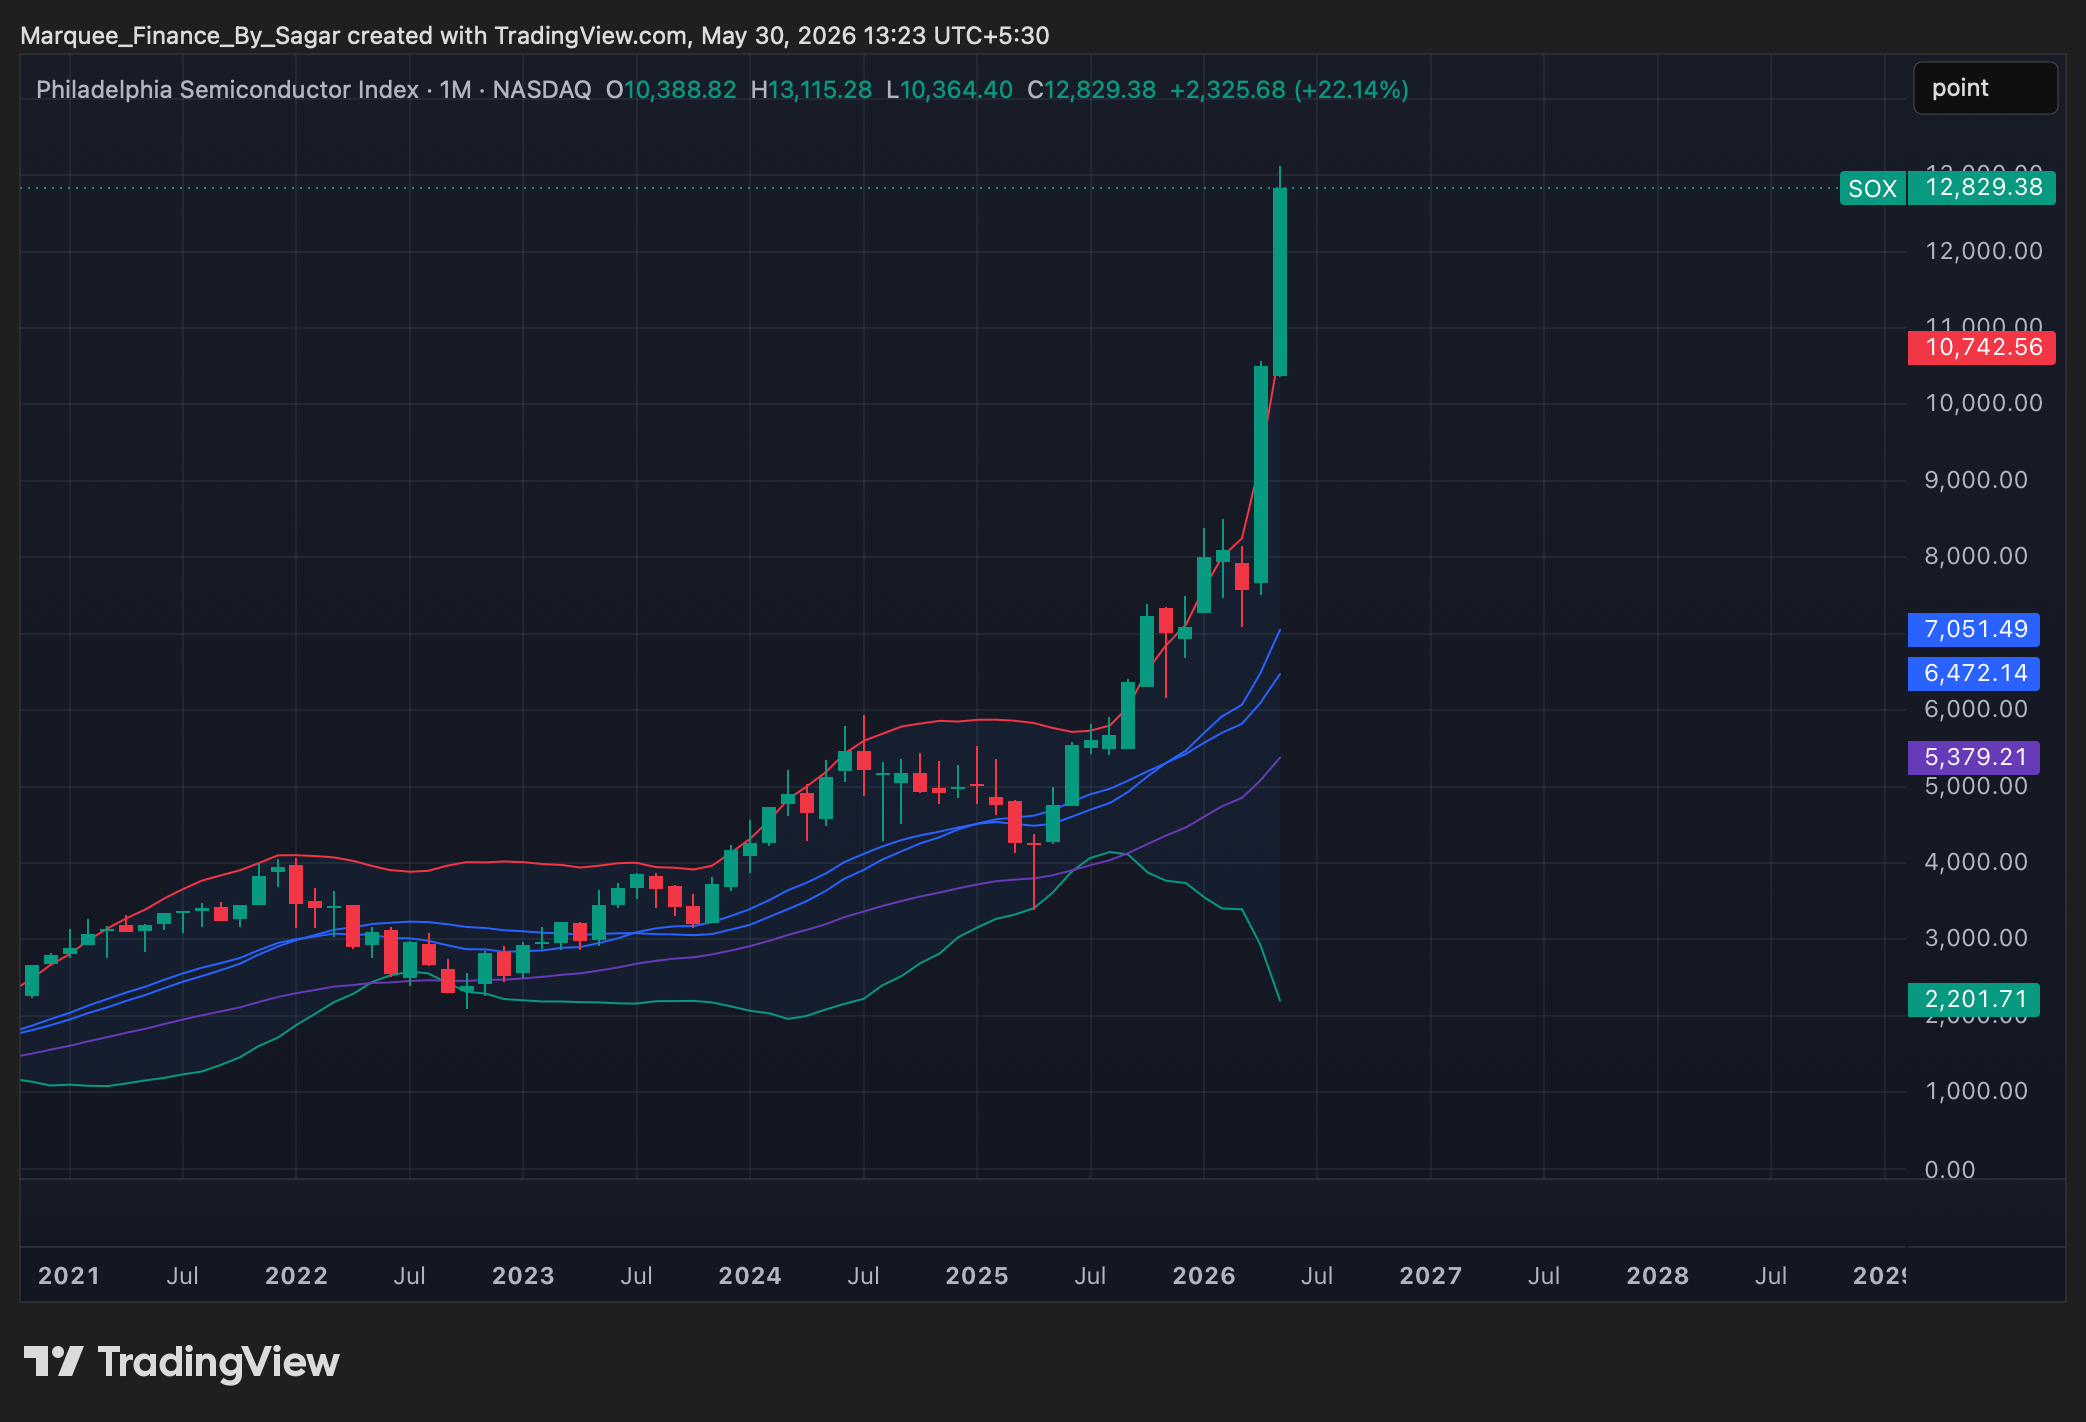
We are witnessing a similar phenomenon in the global chip/memory stocks.
The Philadelphia Semiconductor Index (SOX) is up by more than 85% since 30th March in a mind-boggling rally.
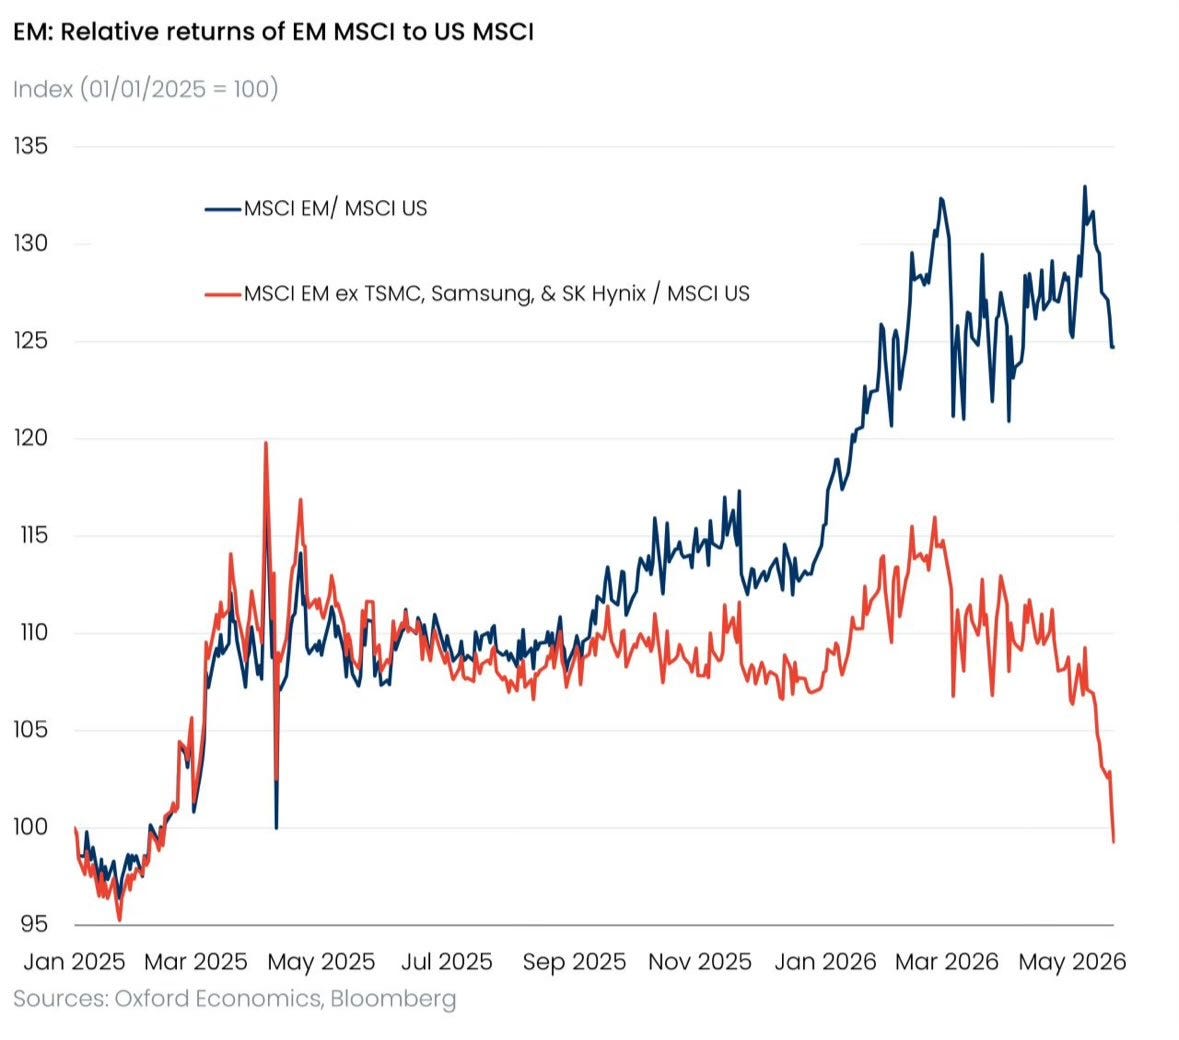
Furthermore, the three Asian stocks: TSMC, SK Hynix, and Samsung have led the EM indices higher, and the three chip stocks now form more than a quarter of the flagship EM ETF: EEM.
If we exclude the three giants (TSMC, Samsung & SK Hynix), the rest of the EM universe relative to MSCI US is now at levels we saw during the liberation day crash.
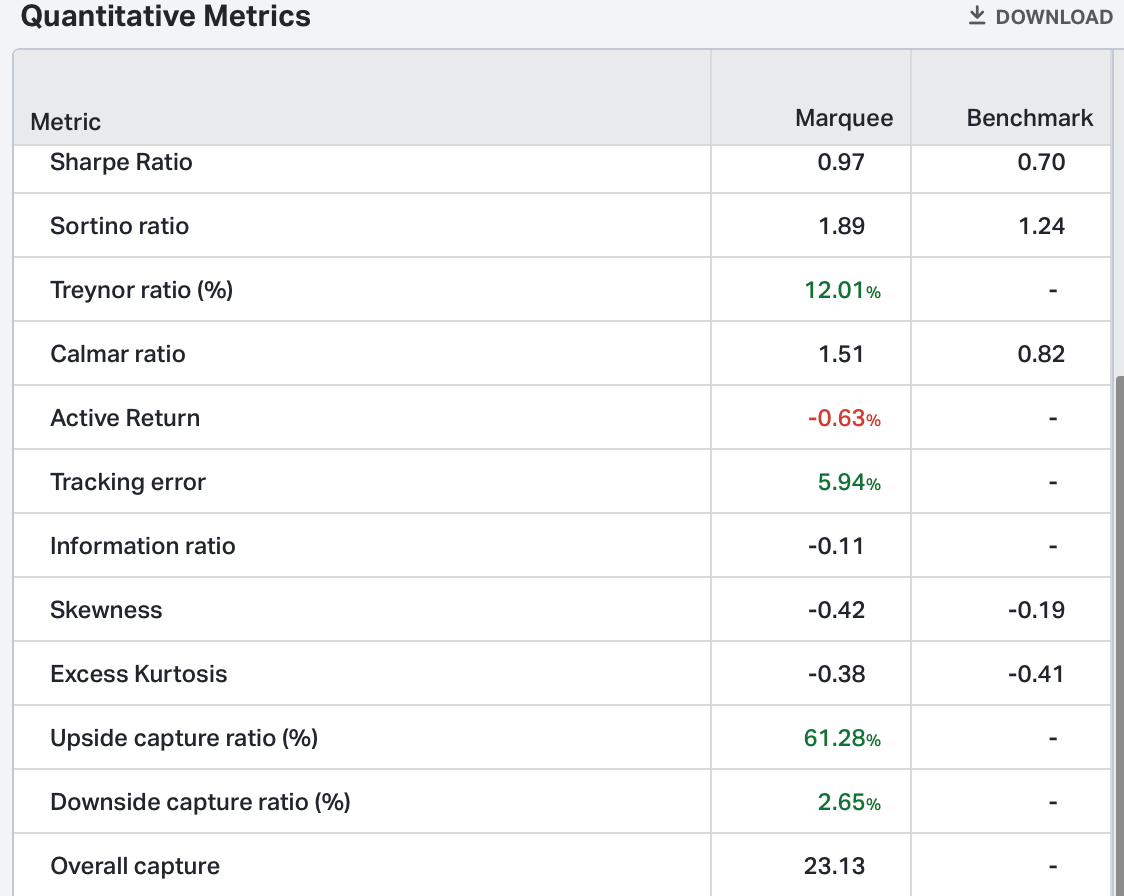
As a result, a diversified portfolio would have underperformed the benchmark YTD. Furthermore, even in the US, ex-Software and Semis, the last month has seen underperformance across sectors.
We are close to YTD highs with PF up 4.9%.
Indian and Chinese equities have been a major drag on the portfolio, while high cash levels have also hurt performance relative to the benchmark.
Due to last month's underperformance (266 bps), the PF has underperformed by 249 bps YTD.

We have consistently posted a superior Sharpe Ratio (>1.5) and Sorino Ratio (>2.5), but last month’s drag has led to a substantial decline.
We expect considerable improvement in the coming months as broader markets outperform and liquidity moves from AI/Semis/Memory/Chips to other parts of the market.
Let us take a deep dive into the macro universe and analyse the cross-asset price action.
Macro!
The Fed’s preferred inflation measure is the PCE.
PCE came in slightly below estimates, with the headline PCE at 0.4% MoM vs the expected 0.5% and the core PCE at 0.2% MoM v/s the expected 0.3%.
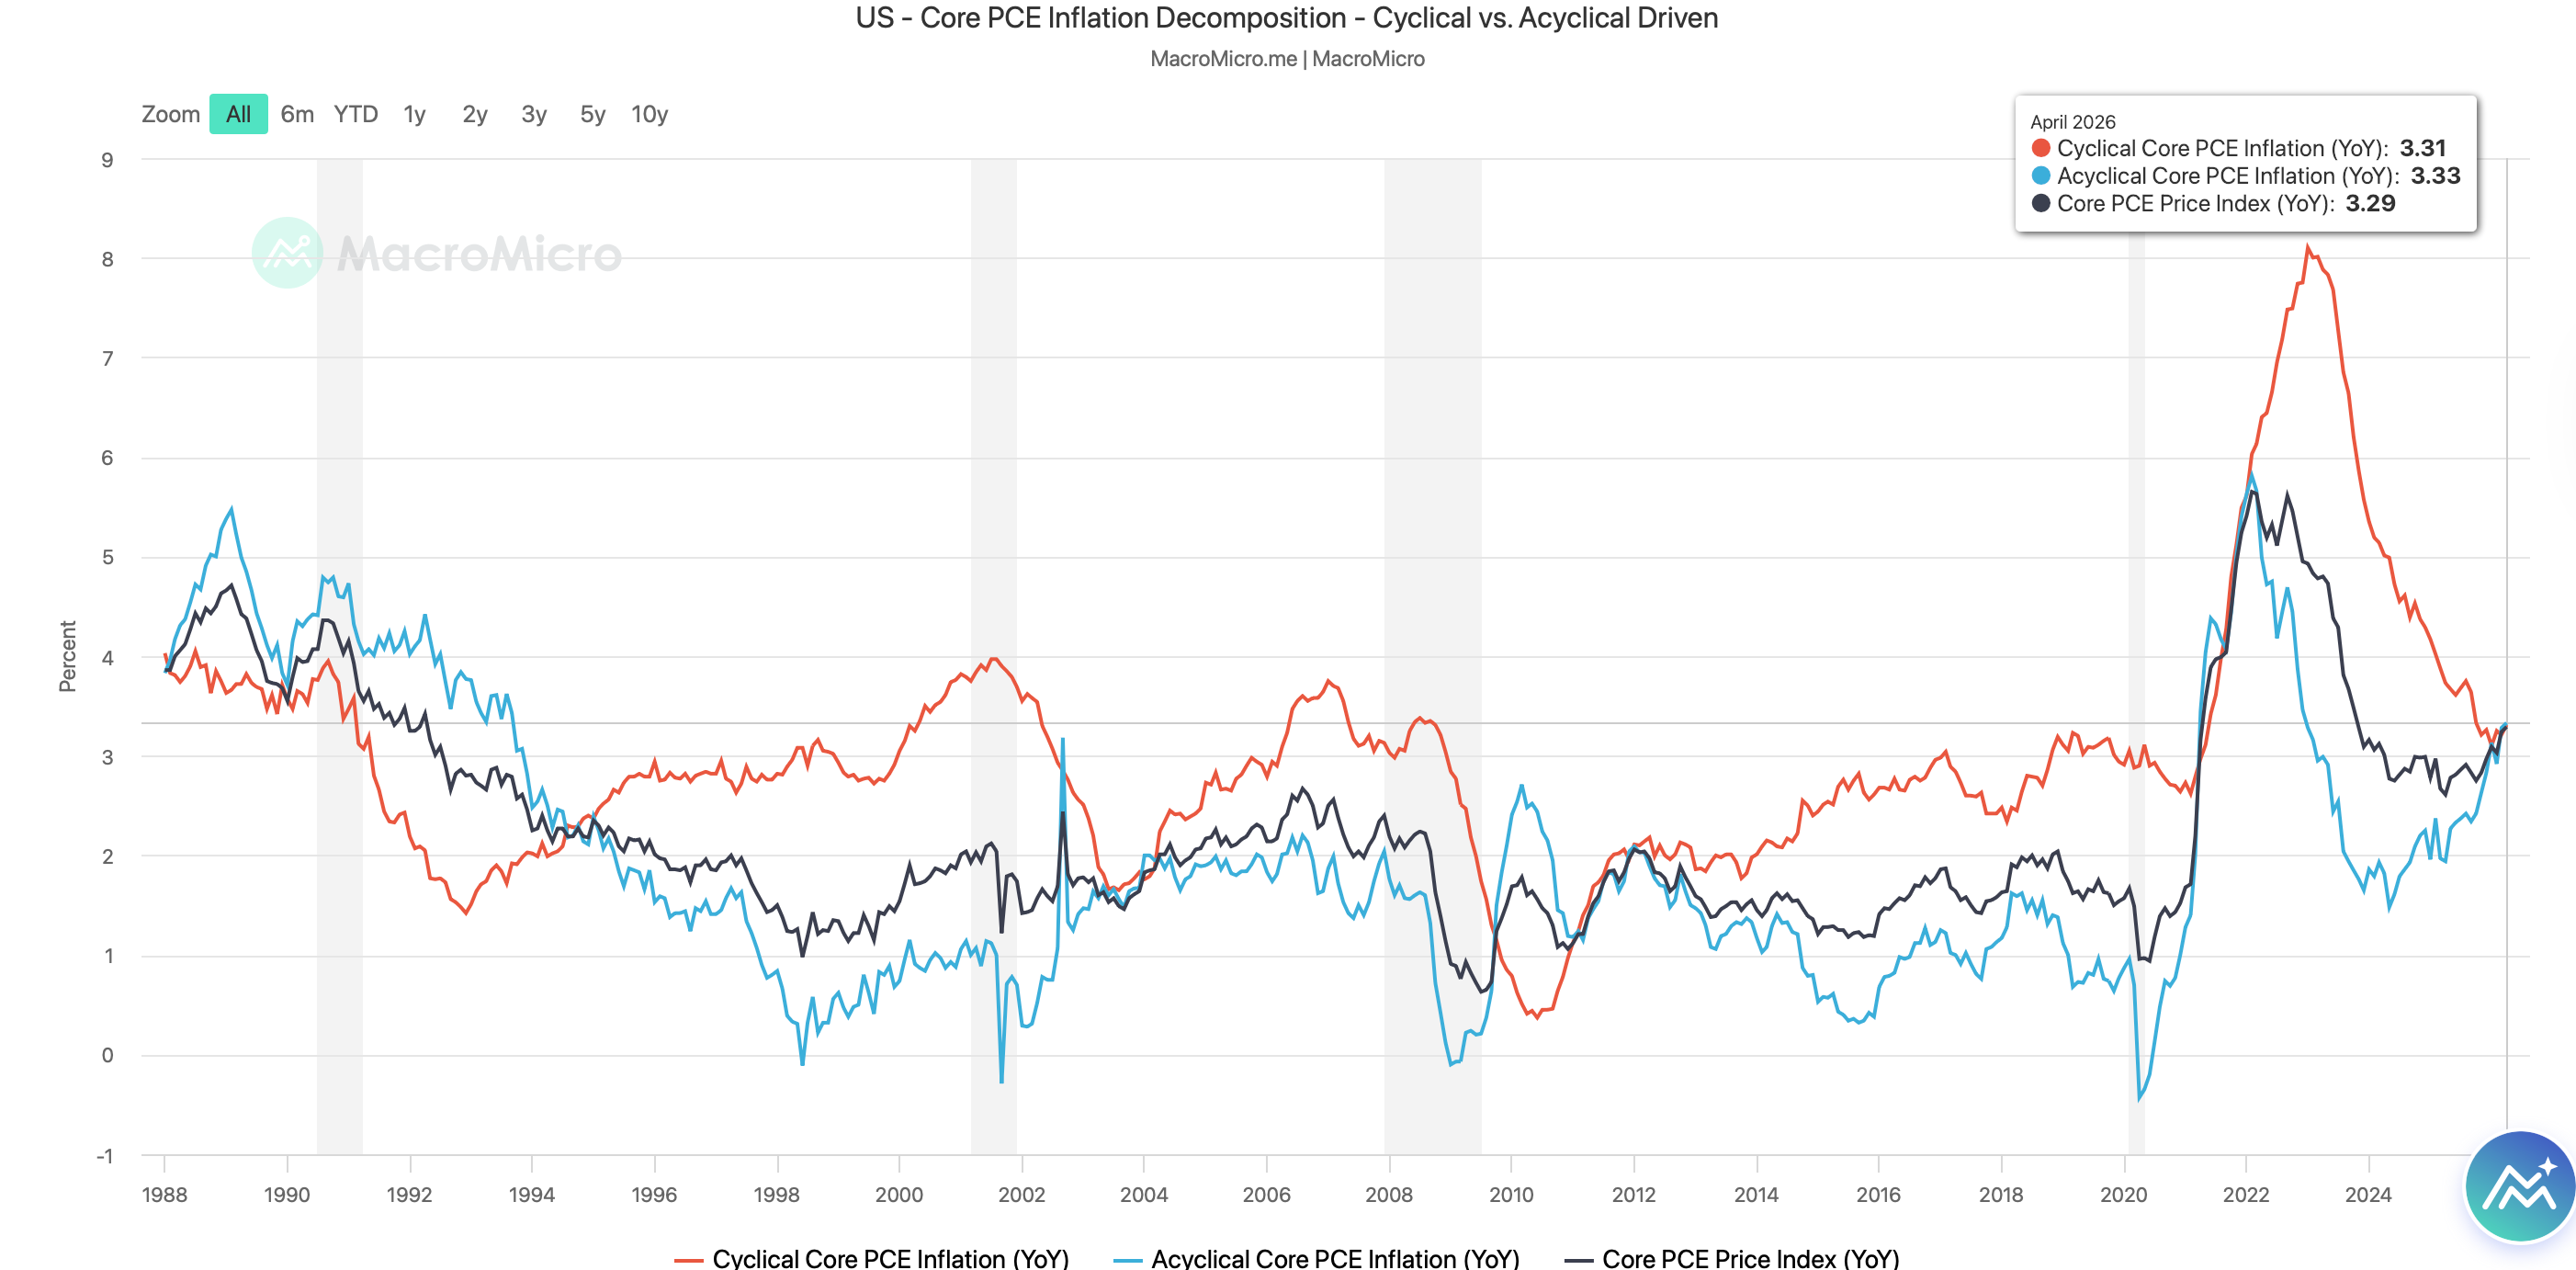
We can decompose the PCE into the Cyclical Core and the Acyclical Core PCE (depending on the item’s sensitivity to the business cycle).
Both the cyclical and acyclical PCE are in an uptrend, driven by higher commodity prices stemming from supply disruptions in the Middle East.
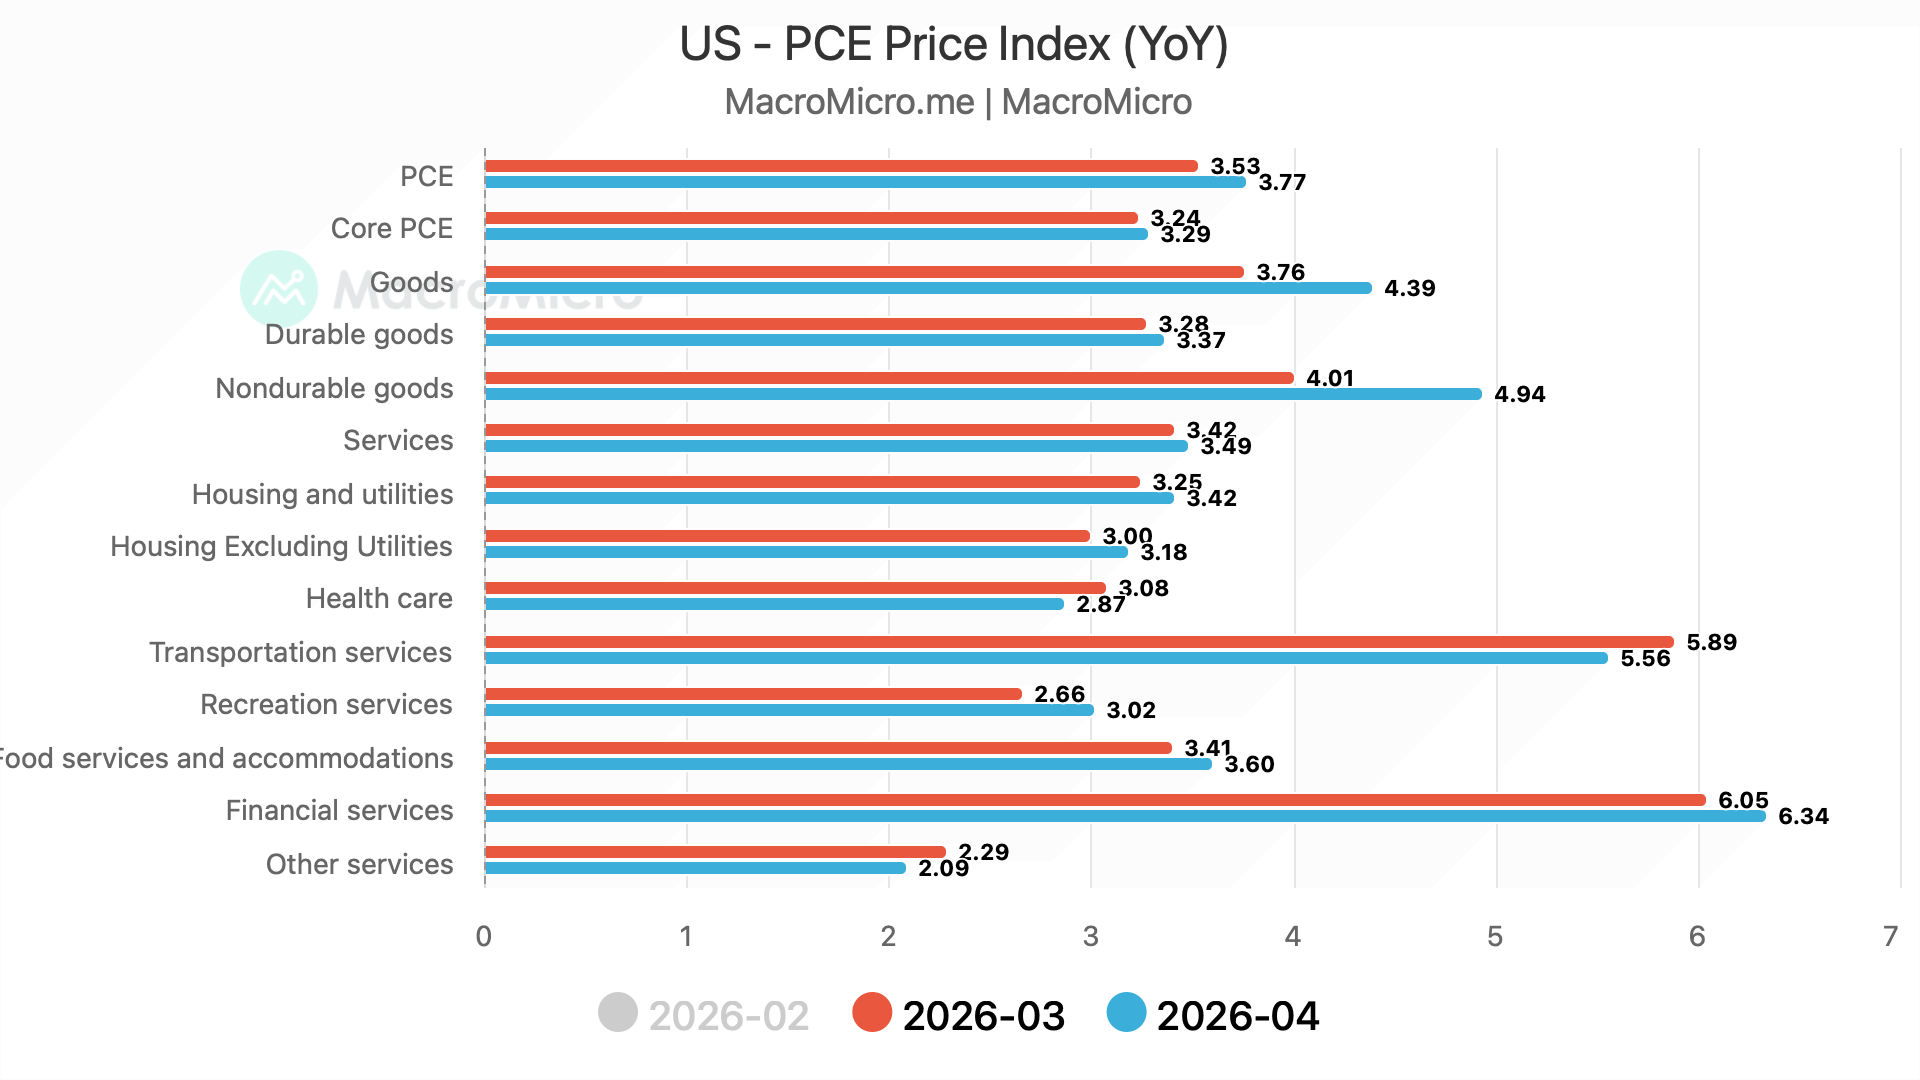
When we analyse the internals, there was significant upward pressure from financial services and non-durable goods.
In fact, the goods PCE came in at 4.39% YoY, which should raise some eyebrows at the Fed.
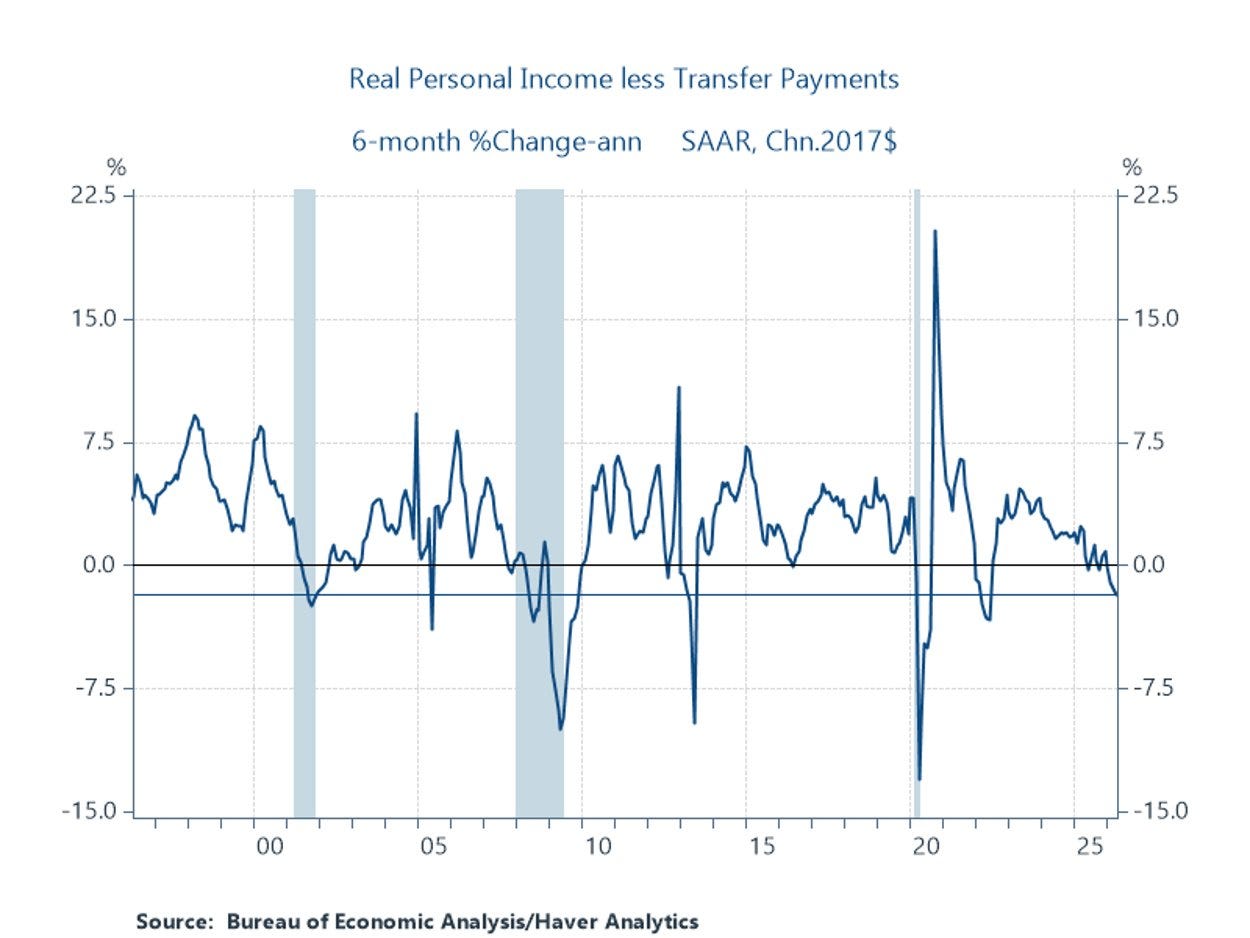
The other shocker, which portrays the sordid state of affairs for consumers, was the real personal income less transfer payments, which fell by 0.4%, the fourth decline in the last five months.
Note that these are real personal income and thus adjusted for inflation.
We believe asset owners (equities/housing/crypto/PMs) are spending thanks to the positive wealth effect; however, the bottom end of consumers (who don’t own any assets) is suffering [a K-shaped economy].
As a result, we are also witnessing one of the lowest savings rates on record as consumers dip into their savings to keep spending.
Last week, we discussed the plunge in consumer sentiment. The EZ consumer confidence, which cratered post-war, has recovered slightly this month.
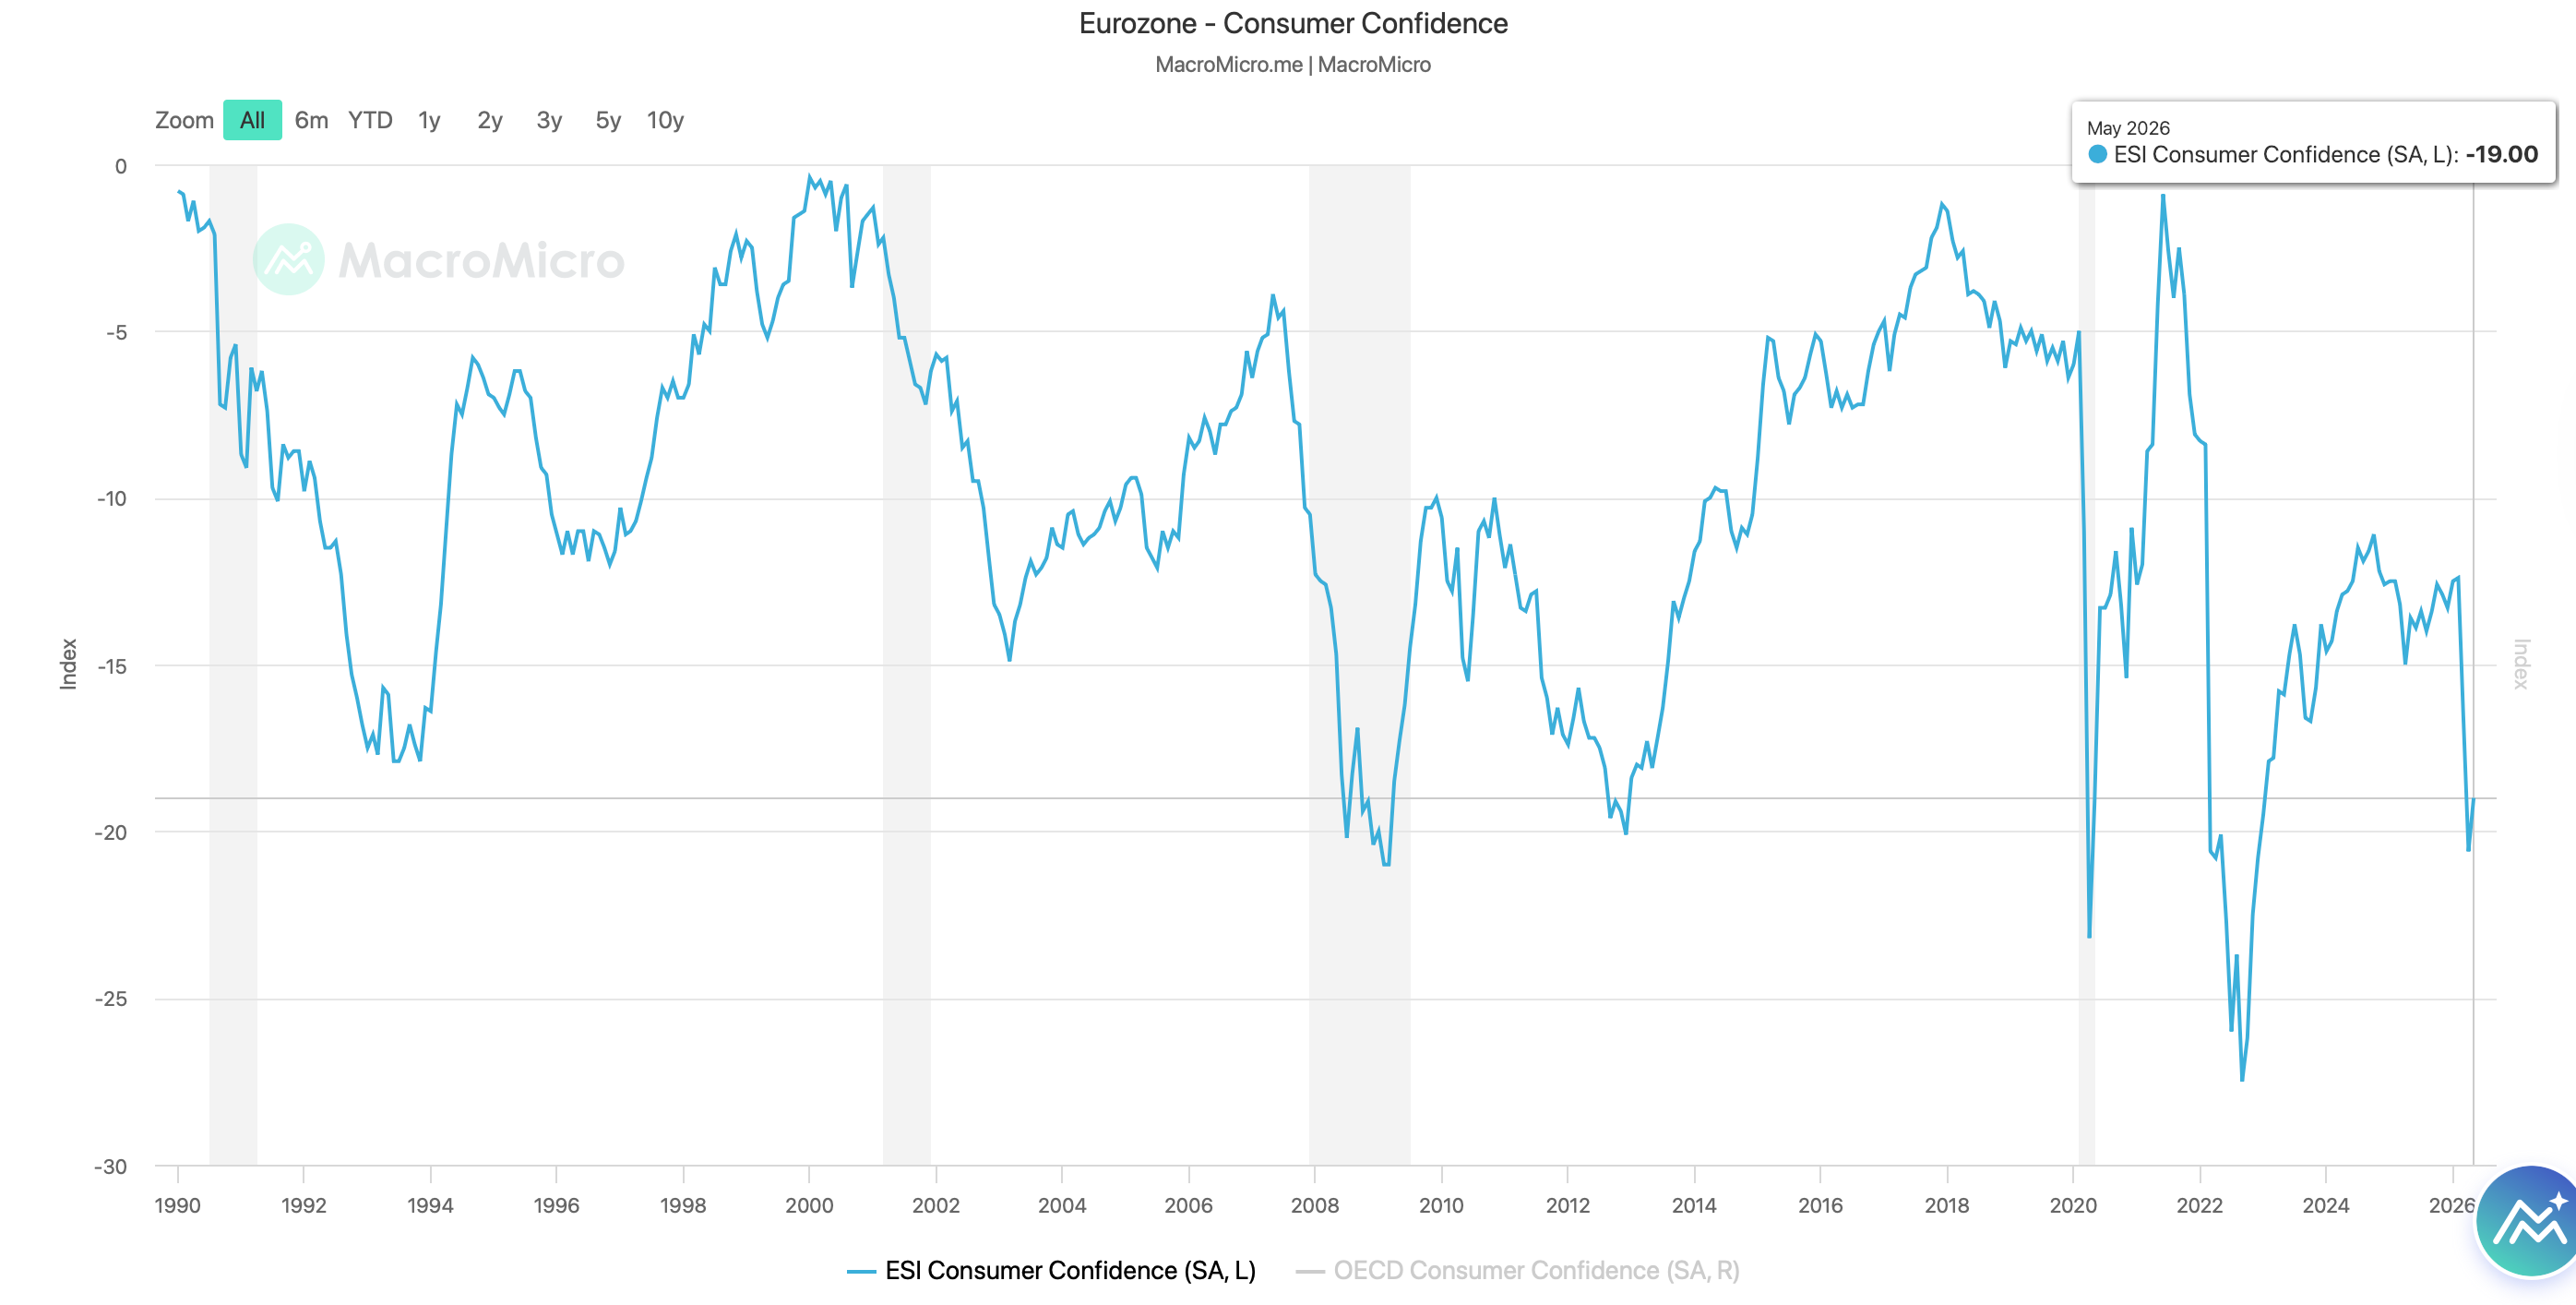
However, it’s still in deep negative territory, and we expect it to gradually move up as higher inflation and likely higher rates will be significant headwinds.
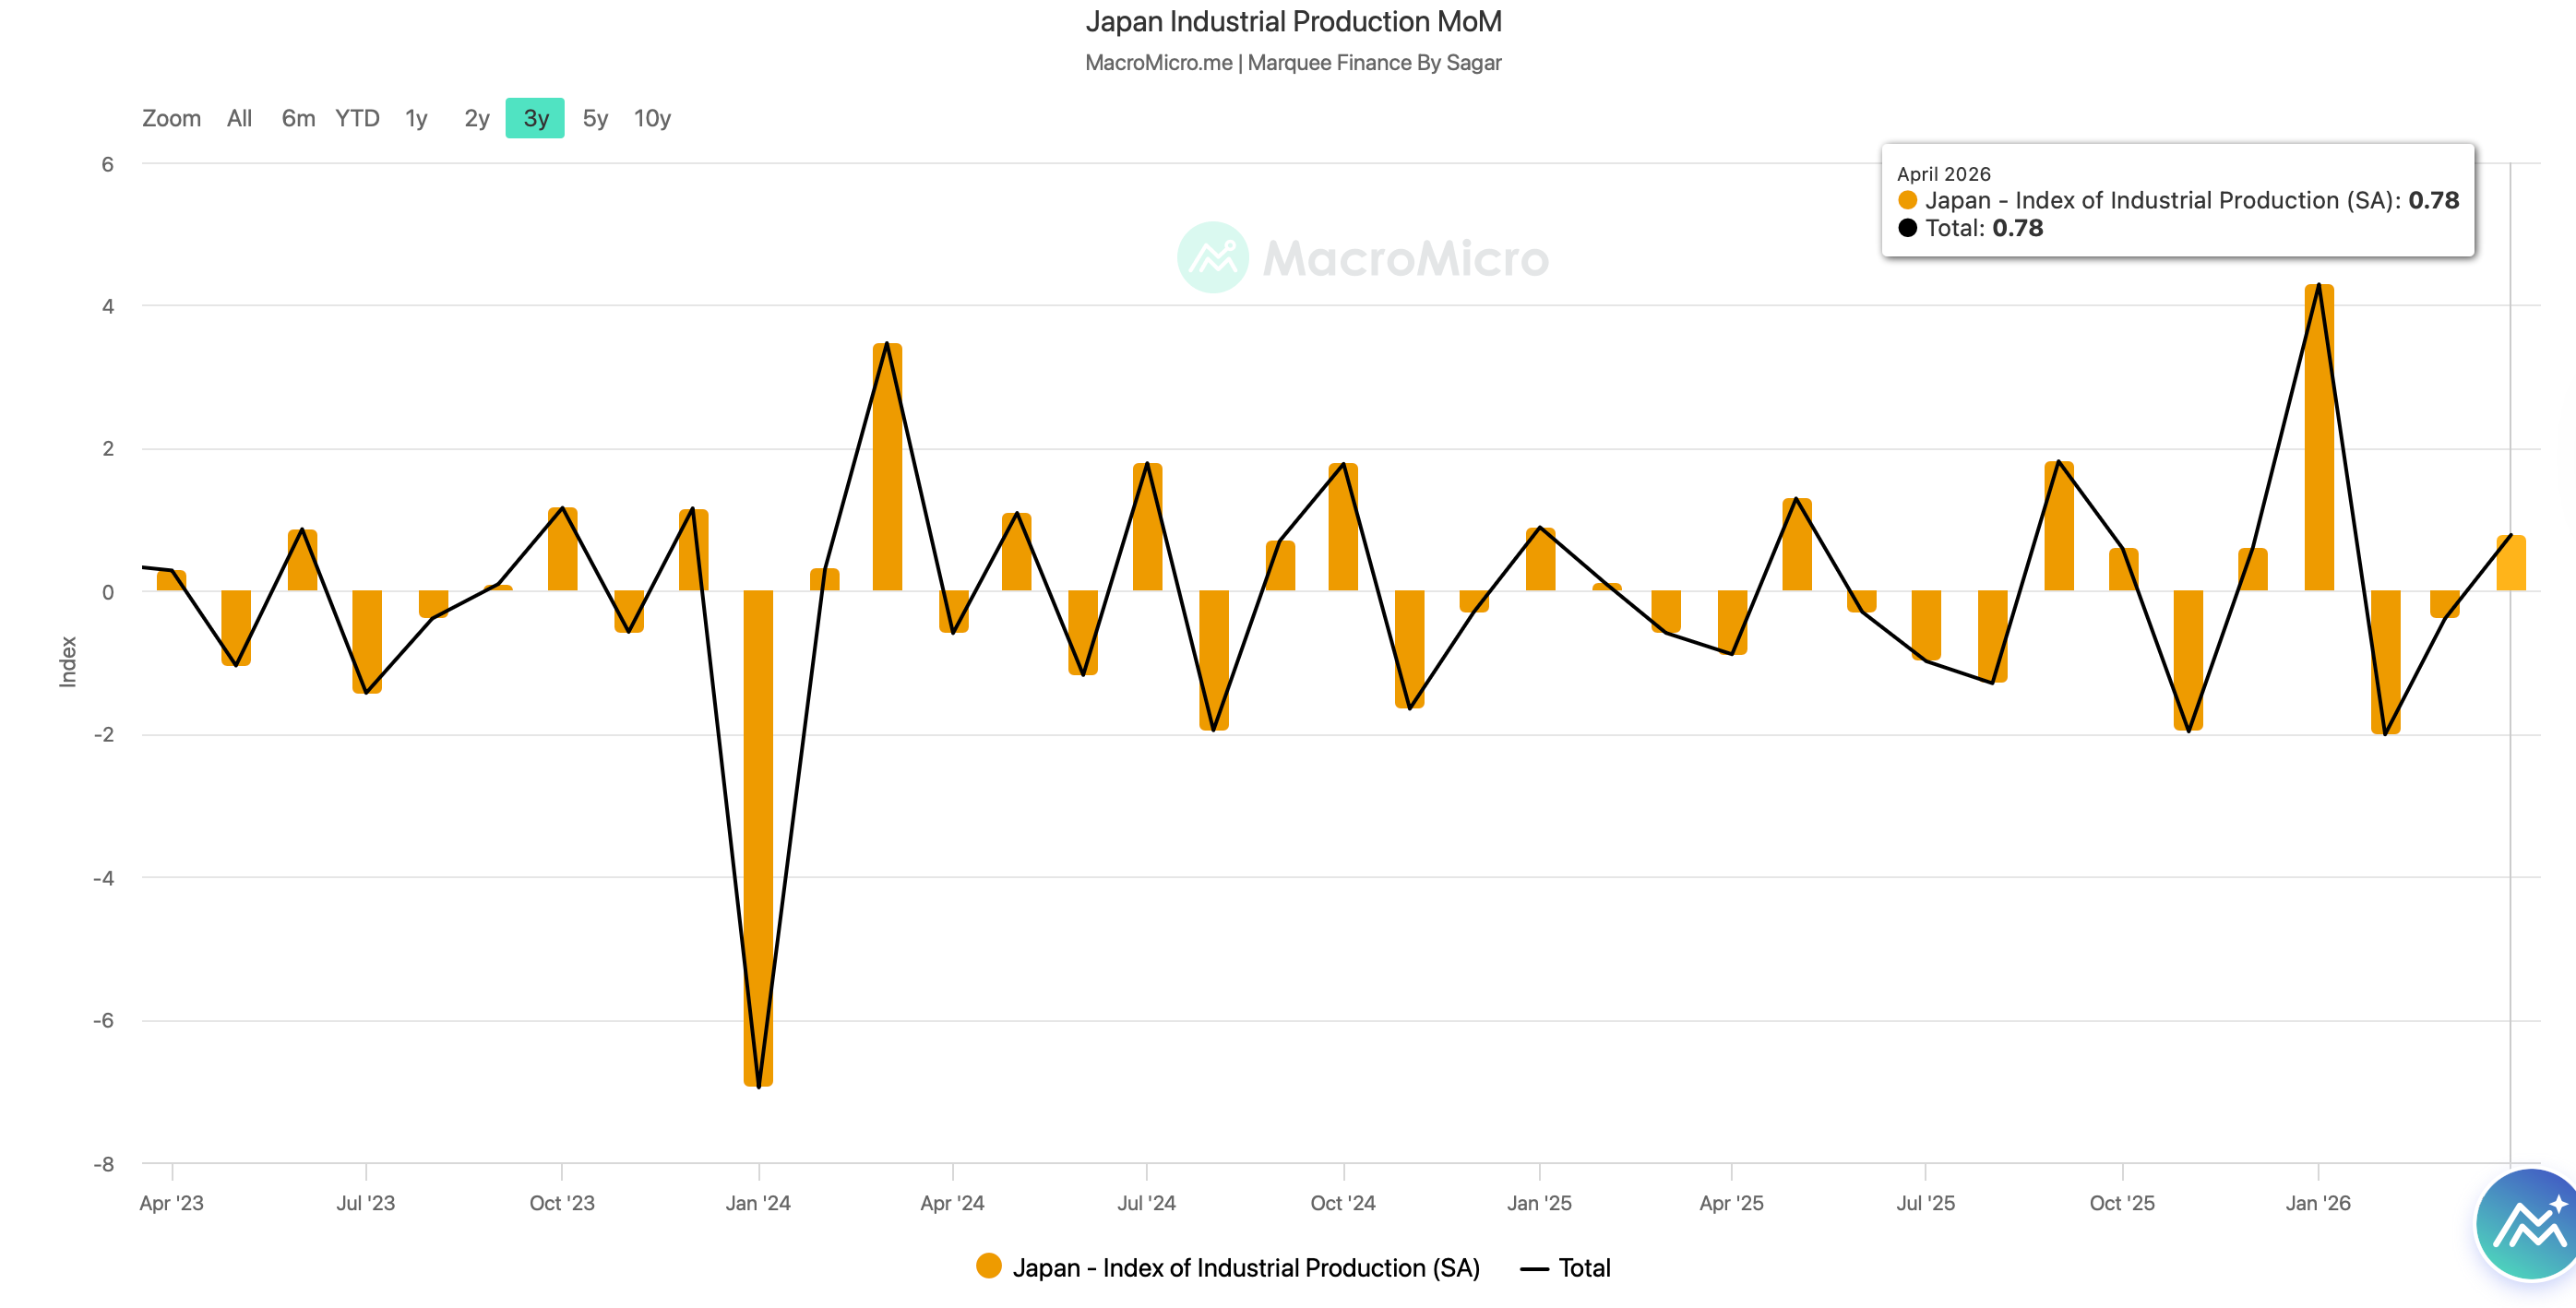
In the land of the rising sun, industrial production rose by 0.8% MoM in April, defying market forecasts for a 0.9% decline.
While electronics equipment and electrical machinery saw strong growth, chemical production and auto production fell.
China’s industrial profits surged 24.7% YoY in April, led by computer and electronics equipment manufacturing.
Last week, we wrote that the rising PPI will eventually lead to higher profits, which will also be a tailwind for higher equity prices.
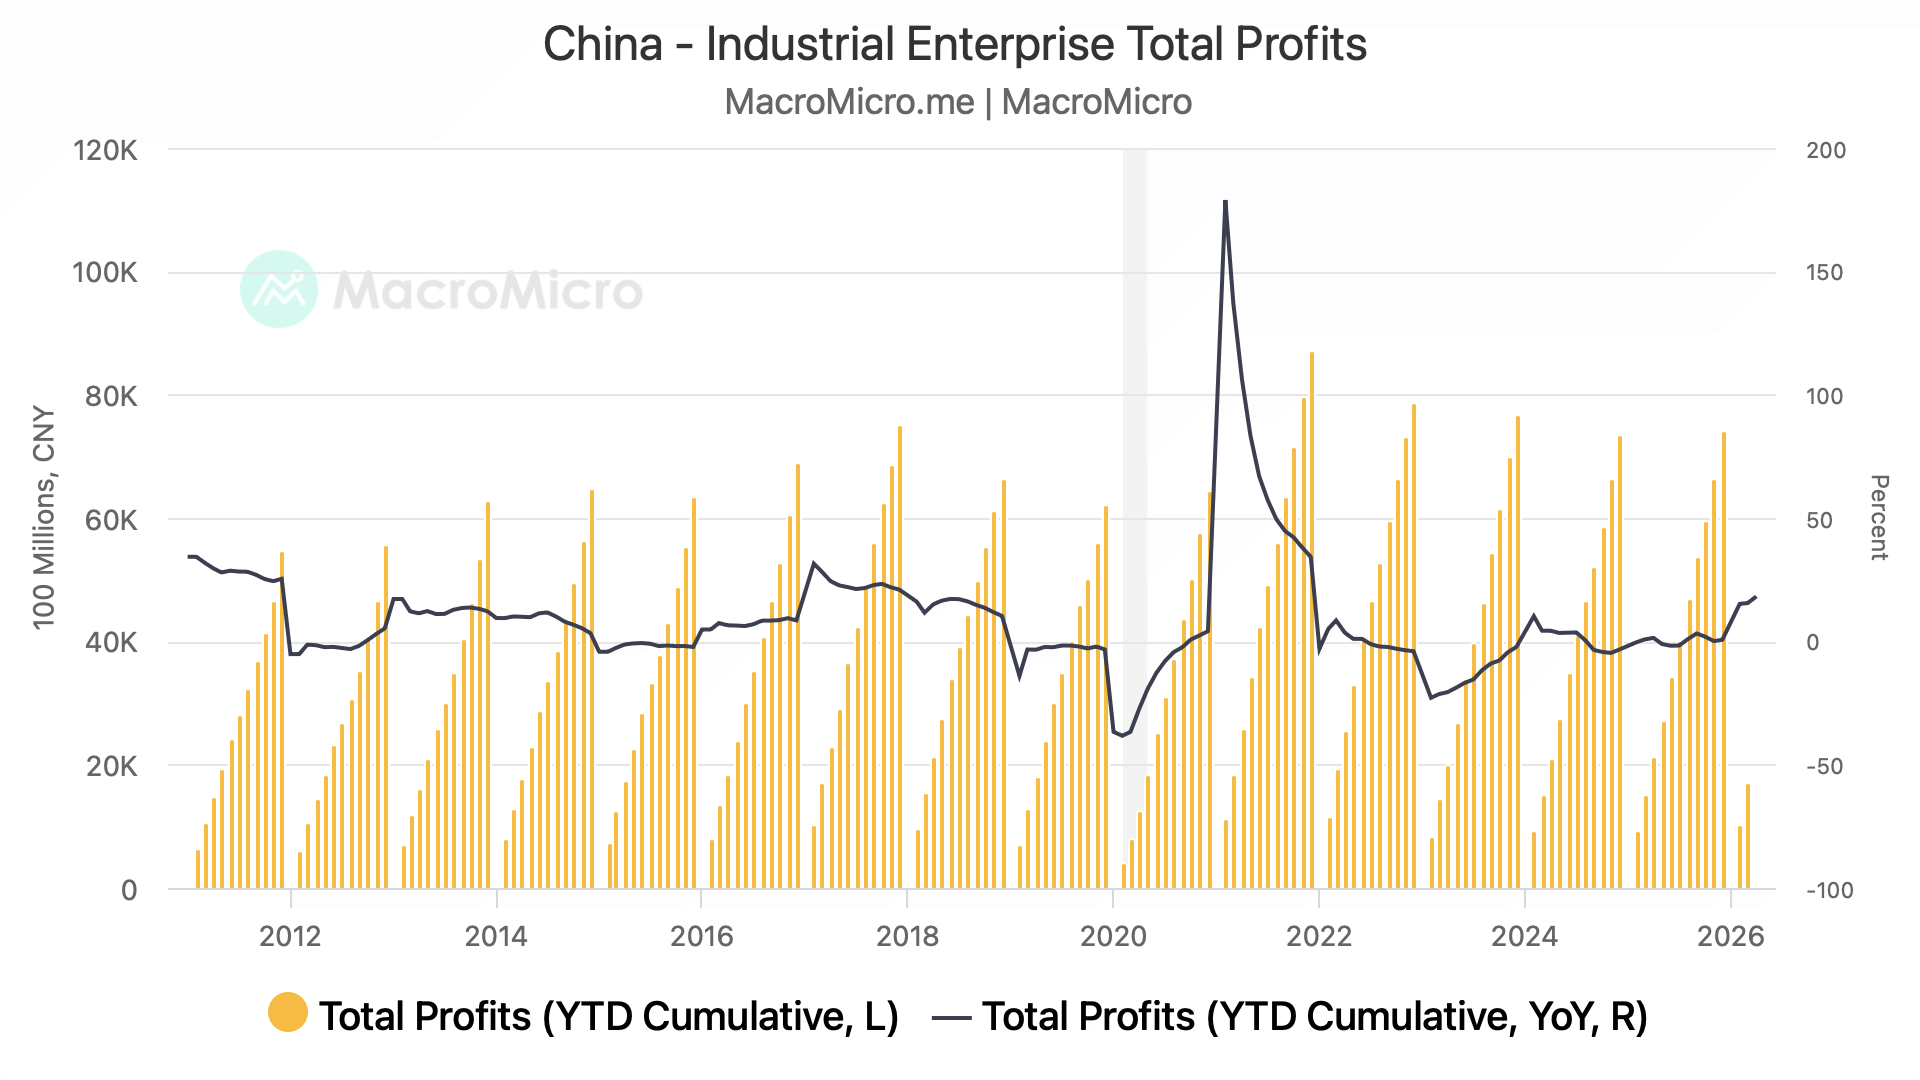
Profits for automobile manufacturers fell 16.8% YoY in Q1, indicating that the competitive intensity is hurting the industry.
Equities!
Since the market bottomed out on 30th March, it has been a one-way ride up led by momentum and growth stocks.
MTUM and IJR relative to SPY have seen huge outperformance, while value and small caps have been crushed, which is also one of the reasons our PF has underperformed.
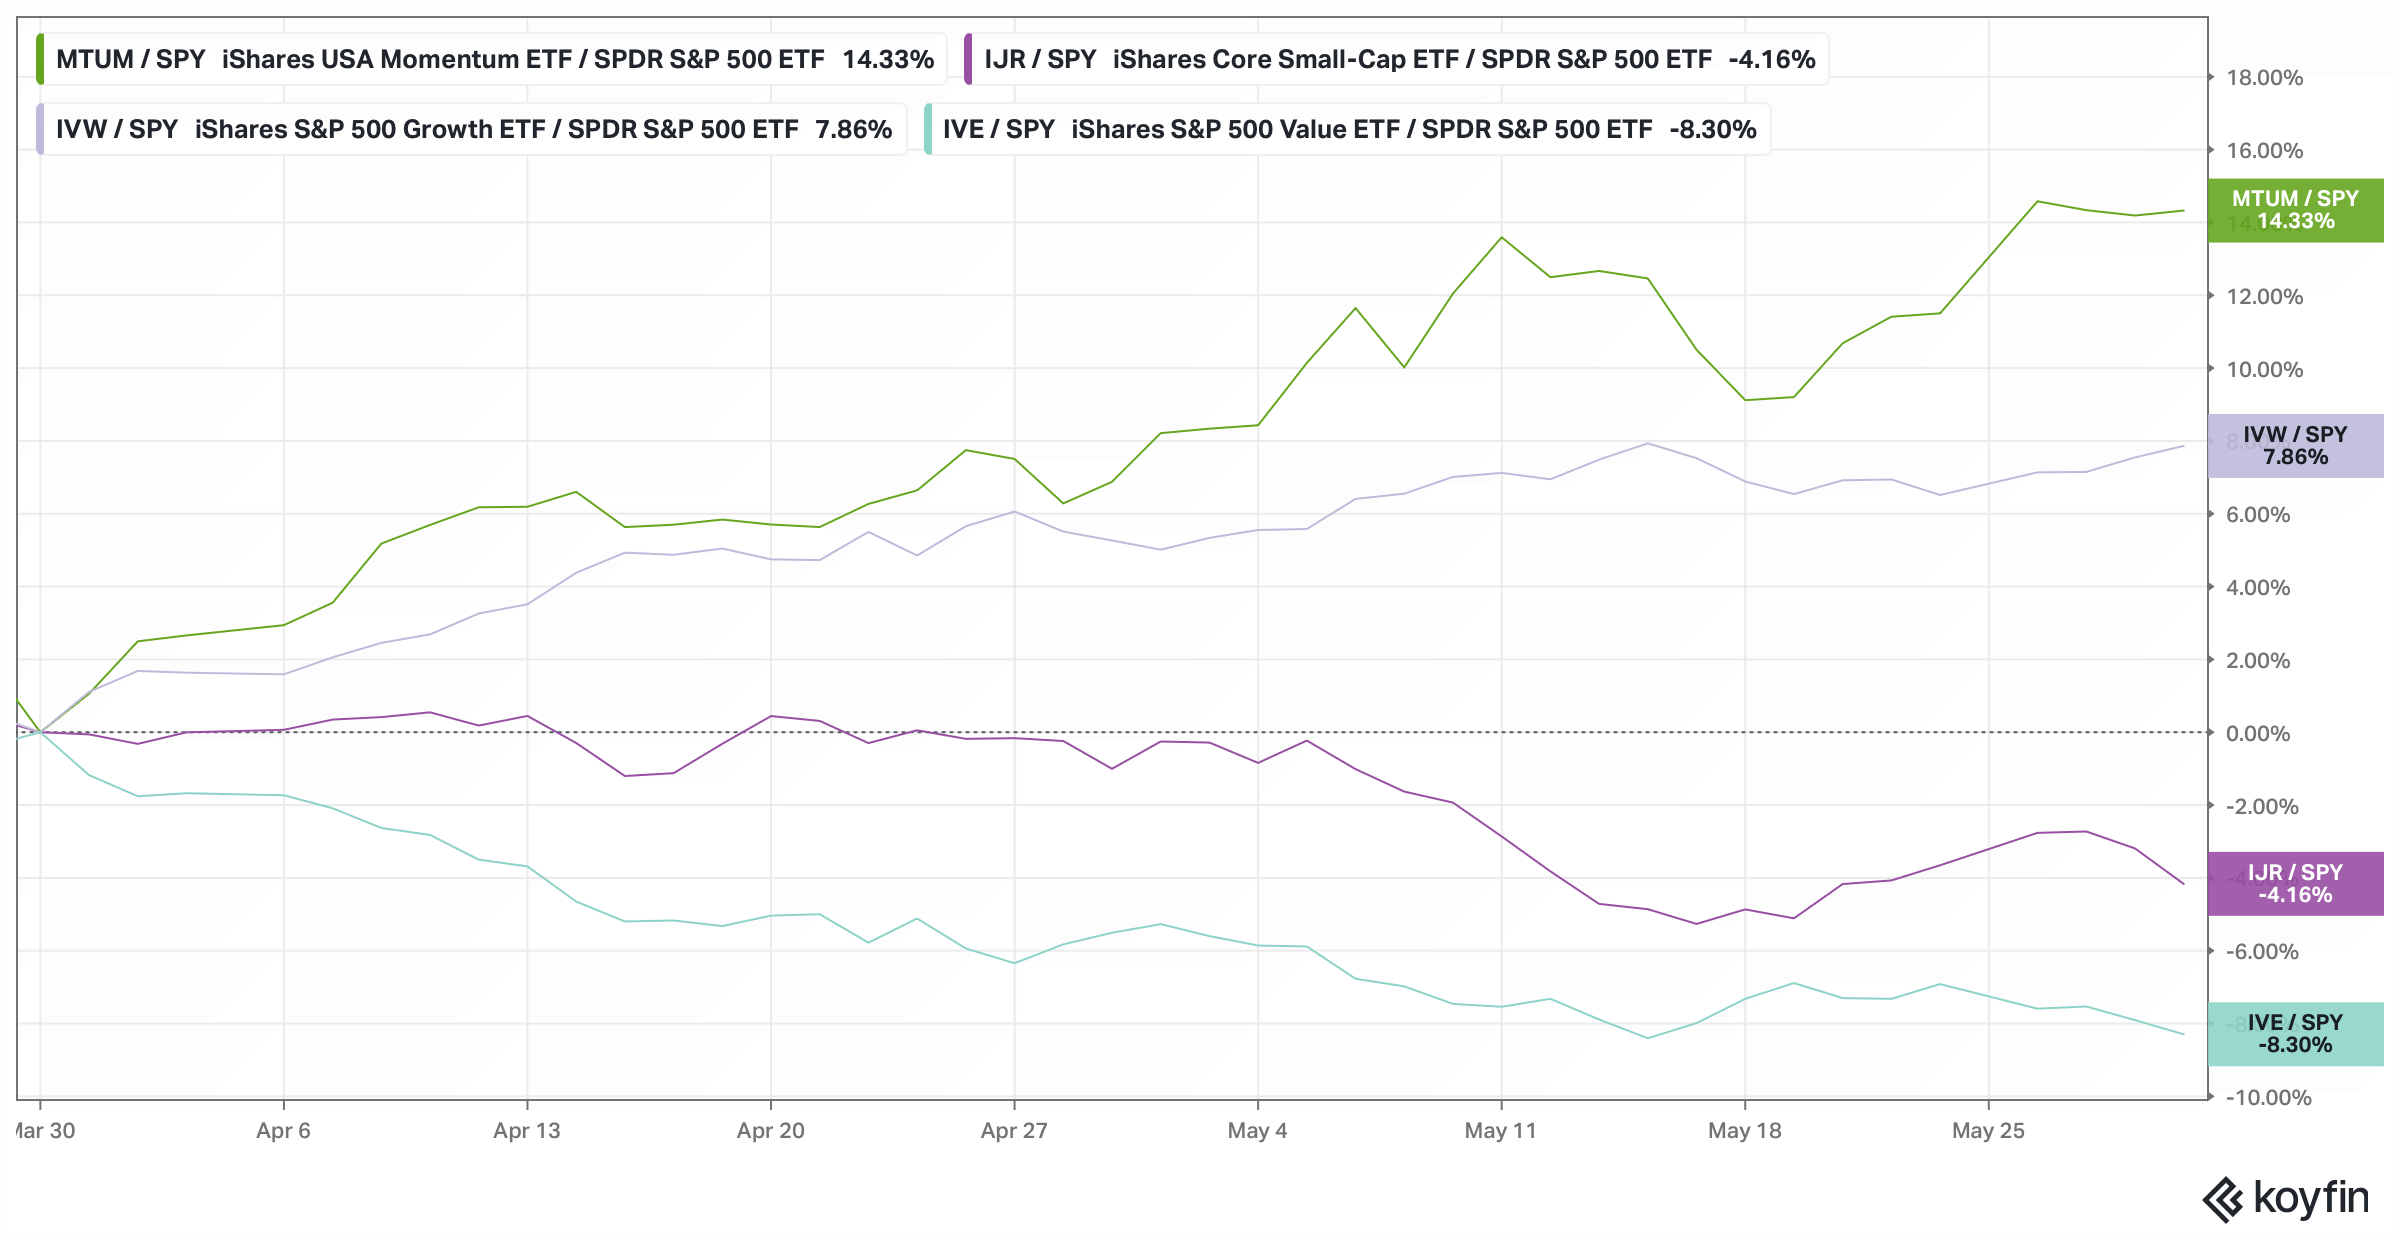
Nonetheless, the outperformance of these factors is largely attributed to only a handful of chip stocks (especially this month).
In fact, except for XLK, all the other sectors have underperformed the SPY by a “huge” margin.