
The Boom And Bust From The Macro Lens!

We are entering a “violent” AI phase in which only a few players with prudent capital allocation will survive.
As happens with every boom-and-bust cycle, the competition heats up, and eventually those with the competitive advantage emerge victorious.
The Chinese are rapidly enhancing their capabilities and catching up to their US peers.
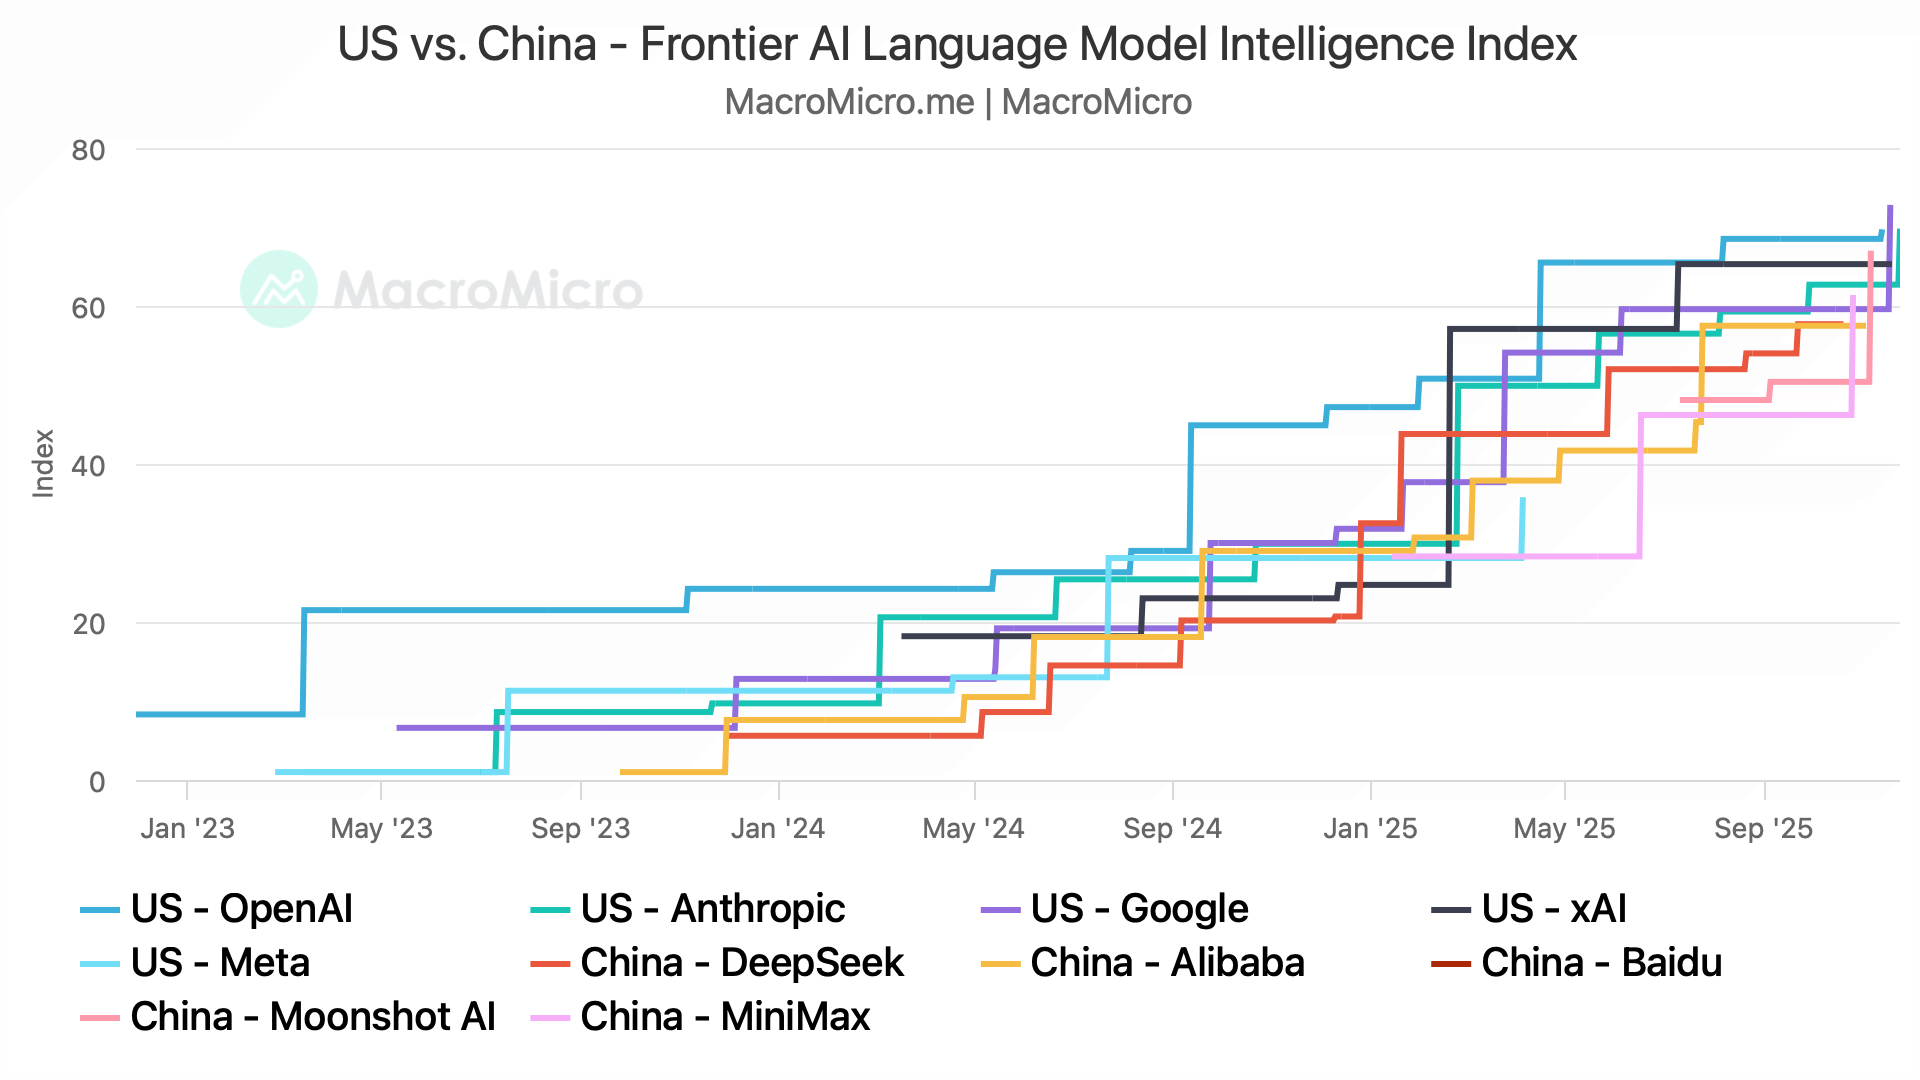
Considering the concentrated global stock markets and the likely repercussions of global AI adoption, it’s paramount for every investor on the planet to track the AI race.
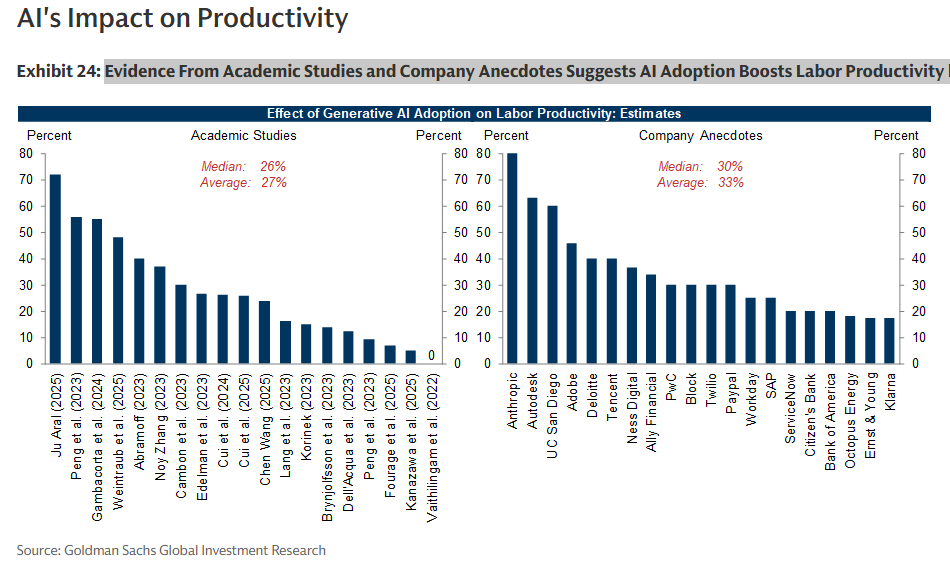
Various studies portray that AI will lead to productivity gains. According to Goldman Sachs, academic studies and company anecdotes suggest that AI Adoption Boosts labour productivity by around 27-33% on average.
As we head into a post-AI era, the boom-and-bust cycle will open up opportunities in both the equity markets and the macro universe.
We have begun researching and writing the Global Outlook 2026, which will be out on 20th December.
The annual performance review will be published on 27th December.
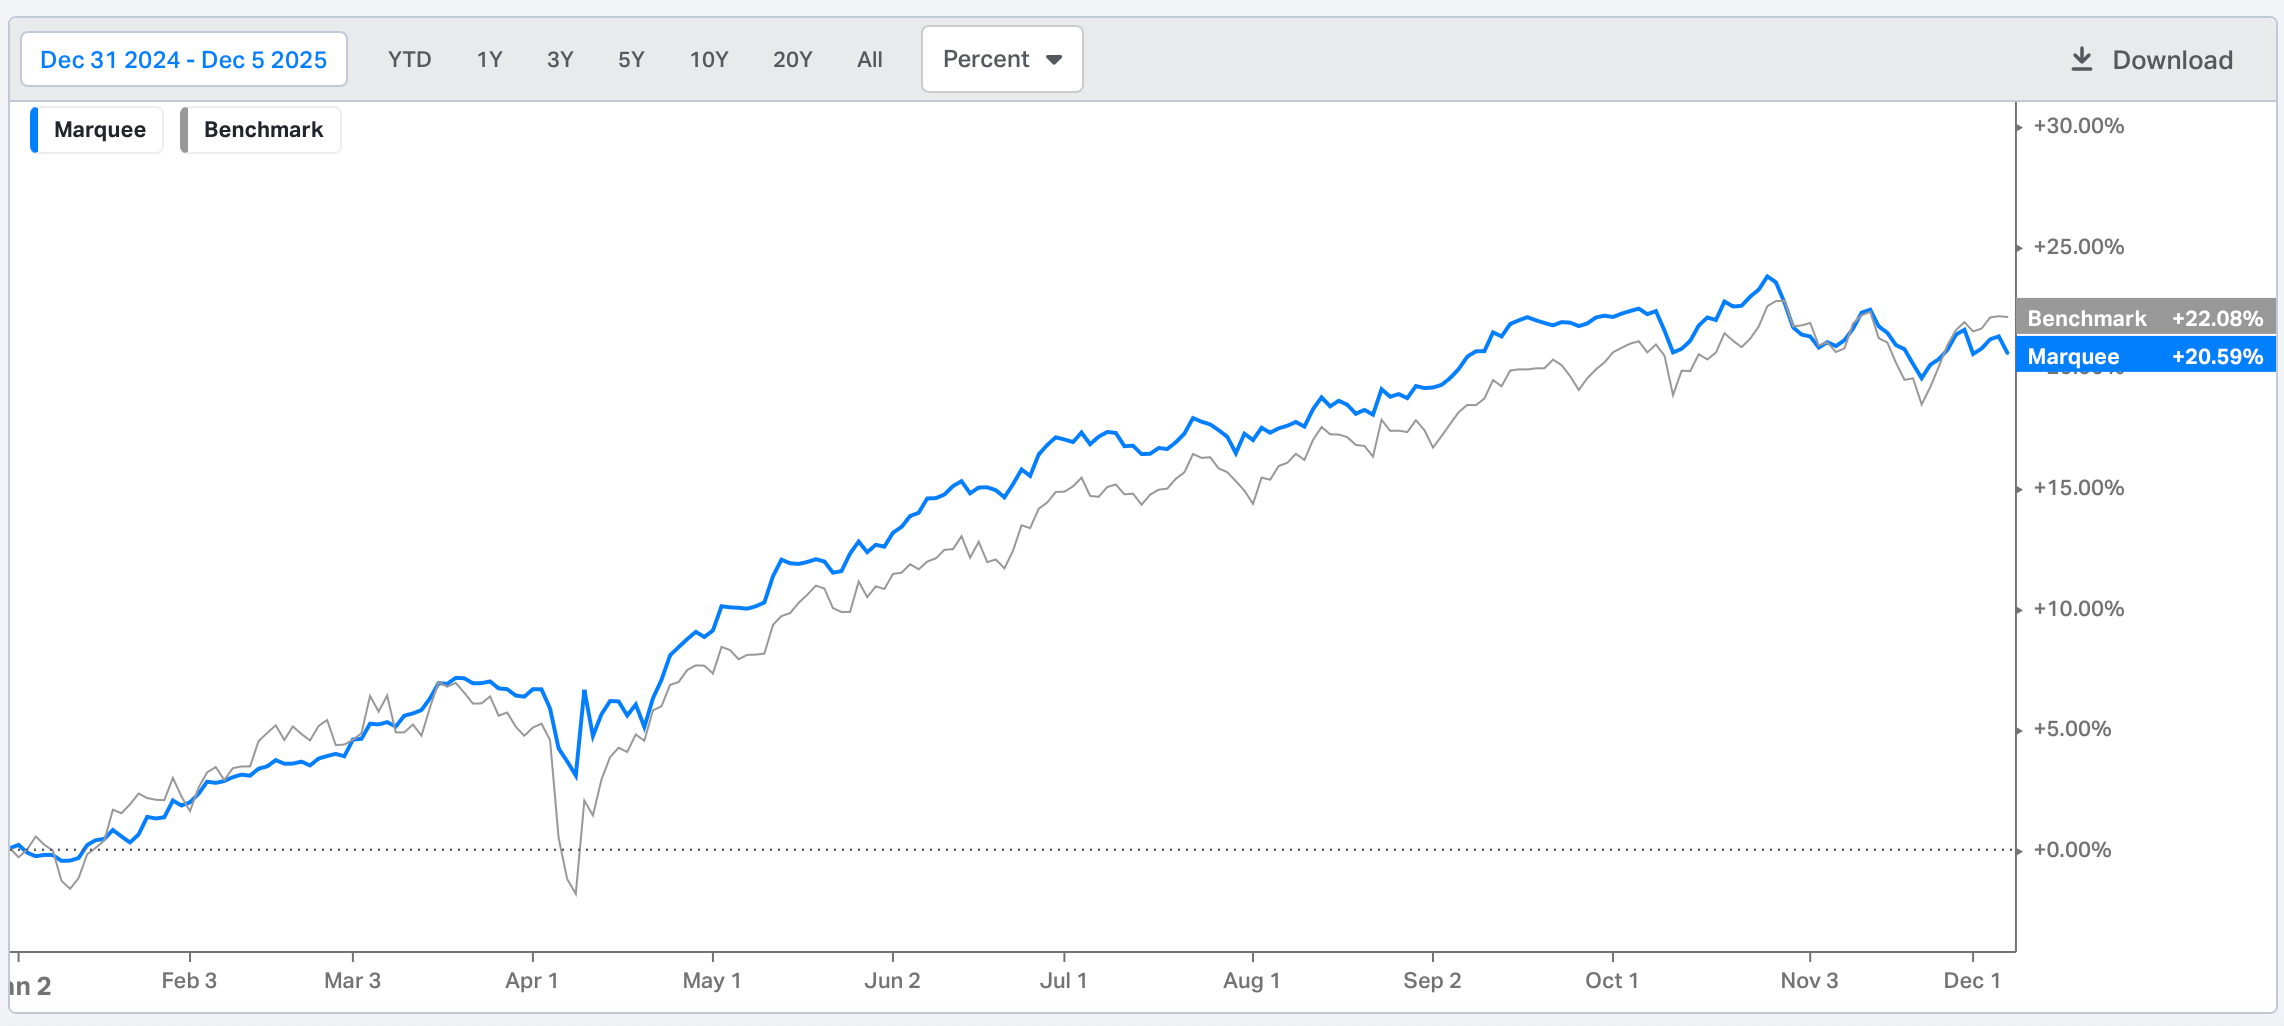
As mentioned last week, we are happy to underperform for a few weeks while protecting the gains achieved this year.
We are up 20.6% and will likely end 2025 above 20%.
Let’s begin today’s newsletter and analyse the cross-asset price action.
US/Bonds/Equities/Gold/Silver/Oil/Dollar!
The delayed government data for September is slowly trickling in.
The most important hard data for the week were the PCE, the Fed's favourite inflation gauge.
Today, we will analyse the PCE by dissecting it into two components:
Cyclical components are PCE items whose prices are more sensitive to overall economic conditions, such as housing, recreation services, and food services. Cyclical components account for about 40% of PCE in the US.
Acyclical components, on the other hand, account for around 60% of PCE and are more sensitive to industry-specific factors. These components include healthcare, financial services, clothing, etc.
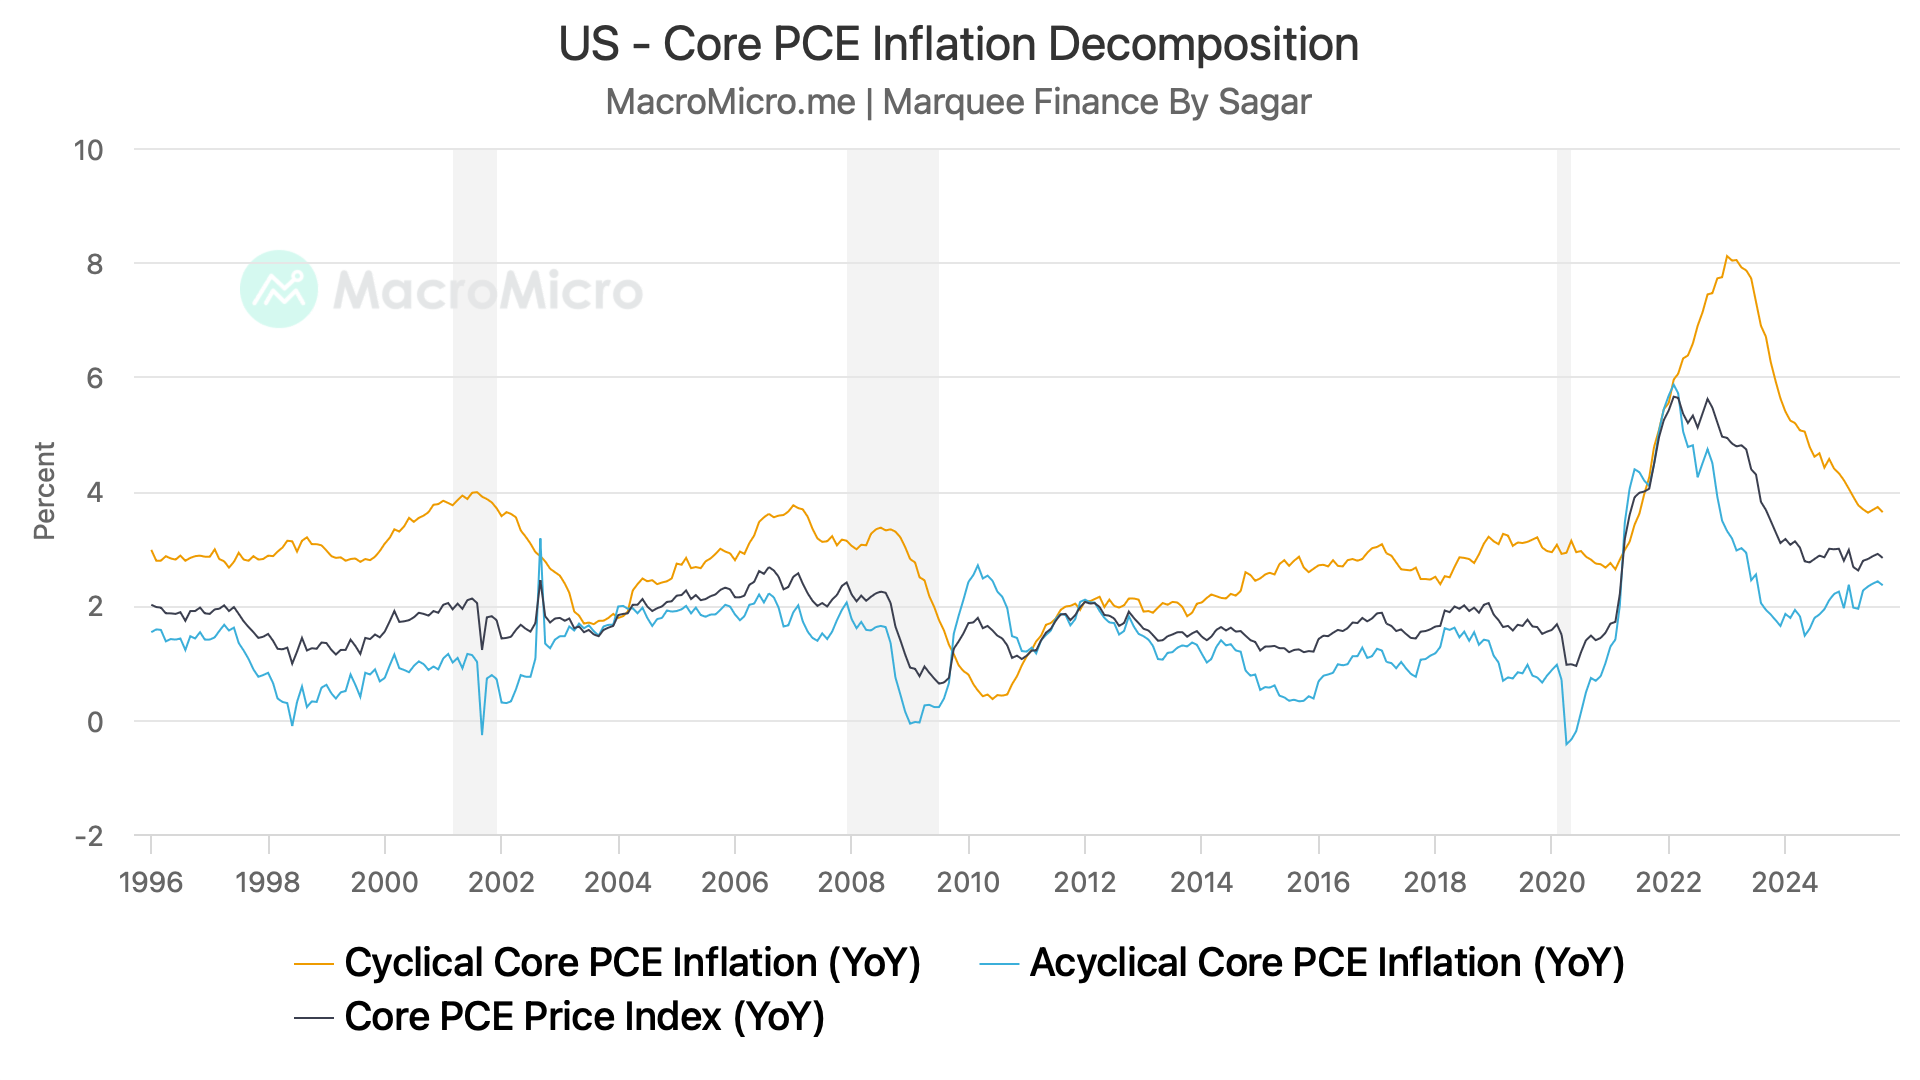
We can observe that the Acyclical Core PCE, though above the 2012-2020 range, has stabilised, but it is turning out to be sticky.
Cyclical Core PCE plunged from its highs as rent costs (housing inflation) fell significantly. It’s now near pre-COVID levels, and with the administration’s immigration policy, we expect the housing inflation to remain subdued going forward as well.
The Supercore PCE (Services Ex-Housing) has cooled down with a MoM rise of 0.221%.
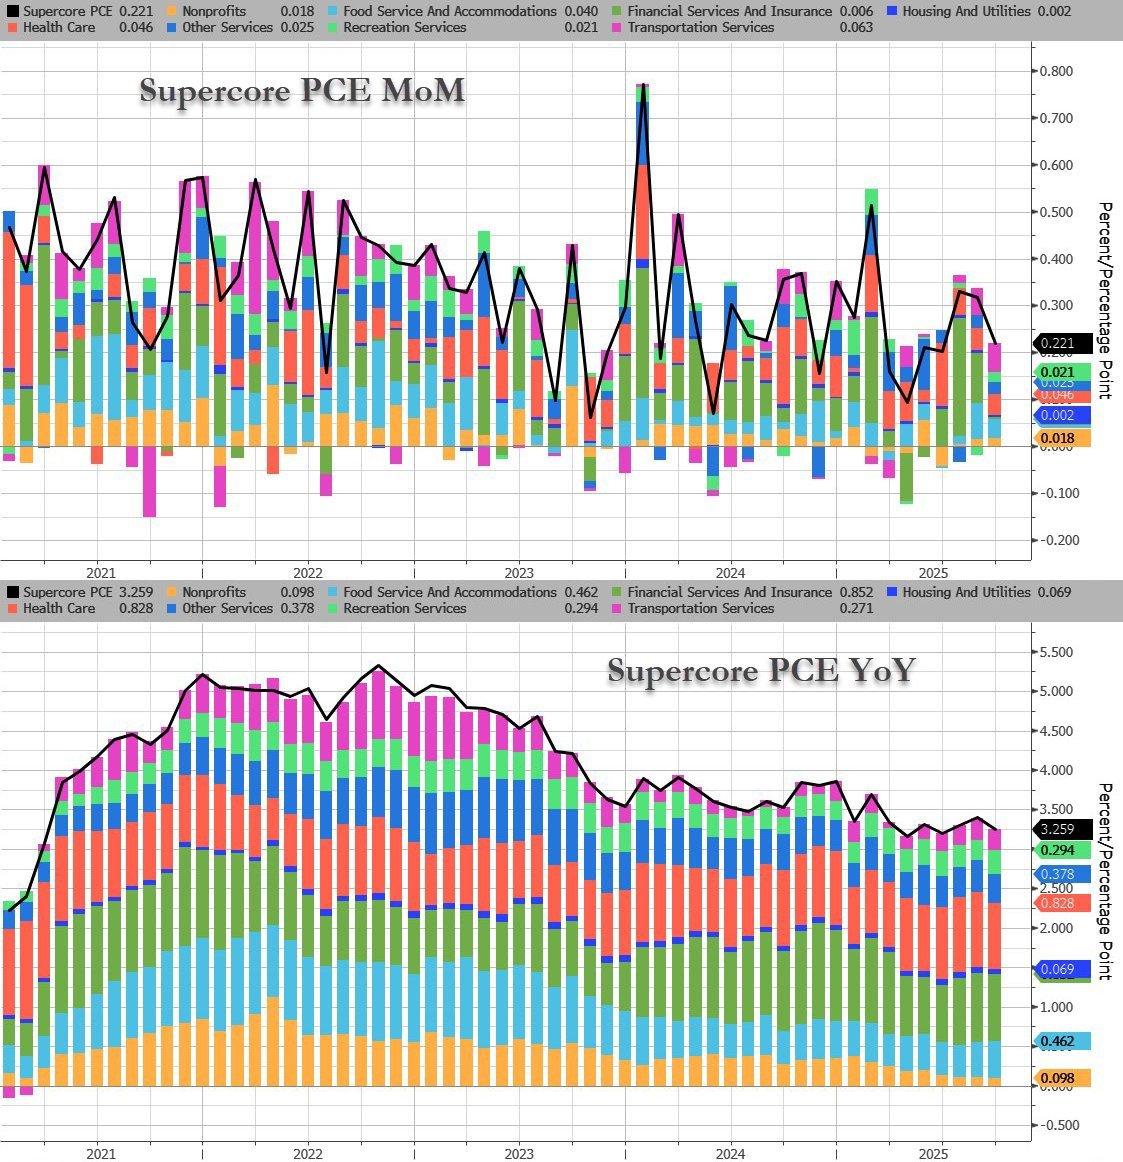
The slightly cooler PCE data should give the Fed confidence, and as a result, there is now a 90% probability that the Fed will cut rates by 25 bps on Wednesday.
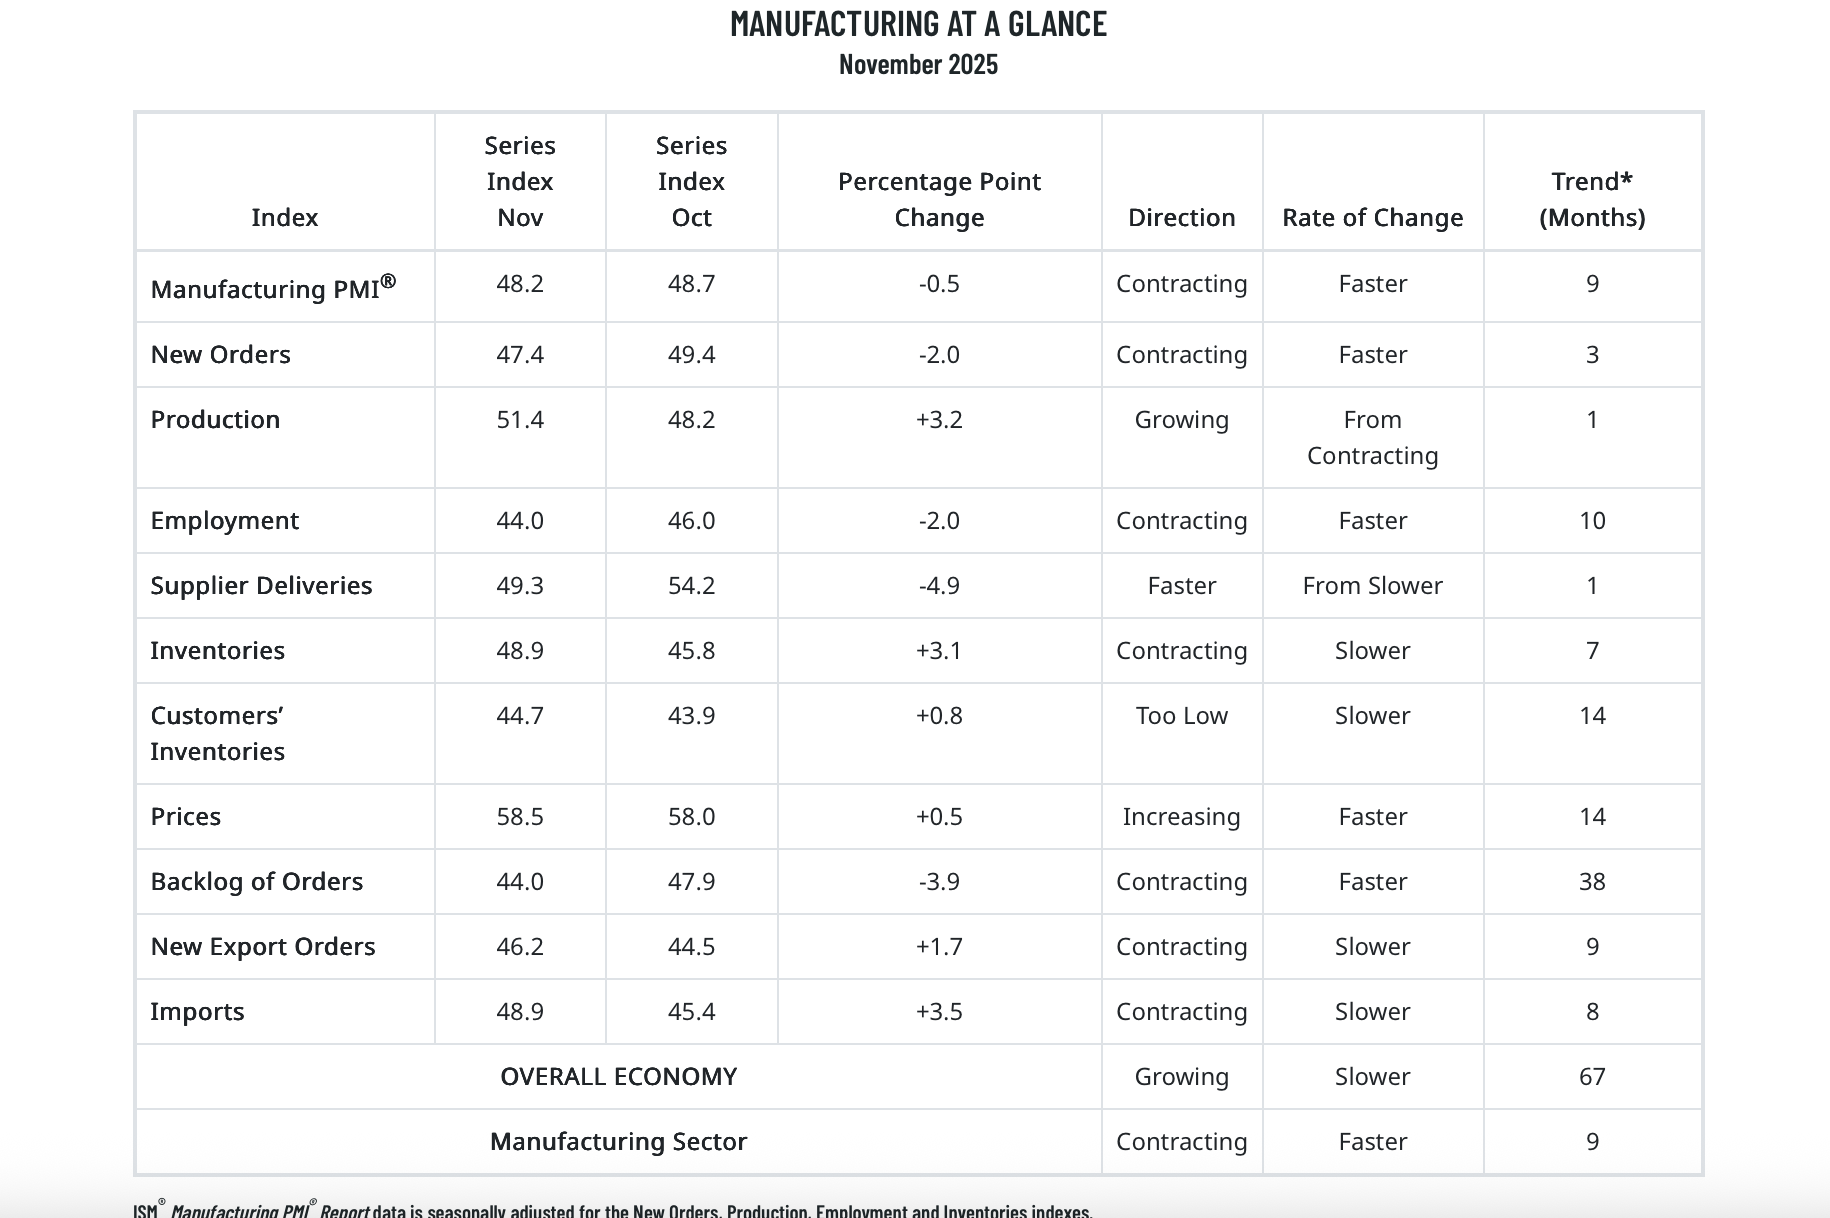
ISM Manufacturing has been our favourite indicator for gauging cyclical activity in the US economy.
The headline ISM Manufacturing came in lower than expected.
The culprit was the Employment PMI, which is again below 45 levels.
When we analyse the comments from the Survey, the tariffs are hurting the manufacturing sector, and one respondent referred to uncertainty similar to that of the COVID era.
Some of the comments from the ISM Manufacturing Survey:
“We are starting to institute more permanent changes due to the tariff environment. This includes reduction of staff, new guidance to shareholders, and development of additional offshore manufacturing that would have otherwise been for U.S. export.” (Transportation Equipment)
“Tariffs and economic uncertainty continue to weigh on demand for adhesives and sealants, which are primarily used in building construction.” (Chemical Products)
“Business continues to be a struggle regarding long-term sourcing decisions based on tariffs and landing costs. External (or international) sourcing remains the lowest-cost solution compared to U.S. production/manufacturing. The delta is smaller now, reducing margins.” (Computer & Electronic Products)
Trade confusion. At any given point, trade with our international partners is clouded and difficult. Suppliers are finding more and more errors when attempting to export to the U.S., before I even have the opportunity to import. Freight organisations are also having difficulties overseas, contending with changing regulations and uncertainty. Conditions are more trying than during the coronavirus pandemic in terms of supply chain uncertainty.” (Electrical Equipment, Appliances & Components)
New Orders Less Inventories fell sharply, reversing the trend and indicating that the ISM Manufacturing PMI might follow suit.
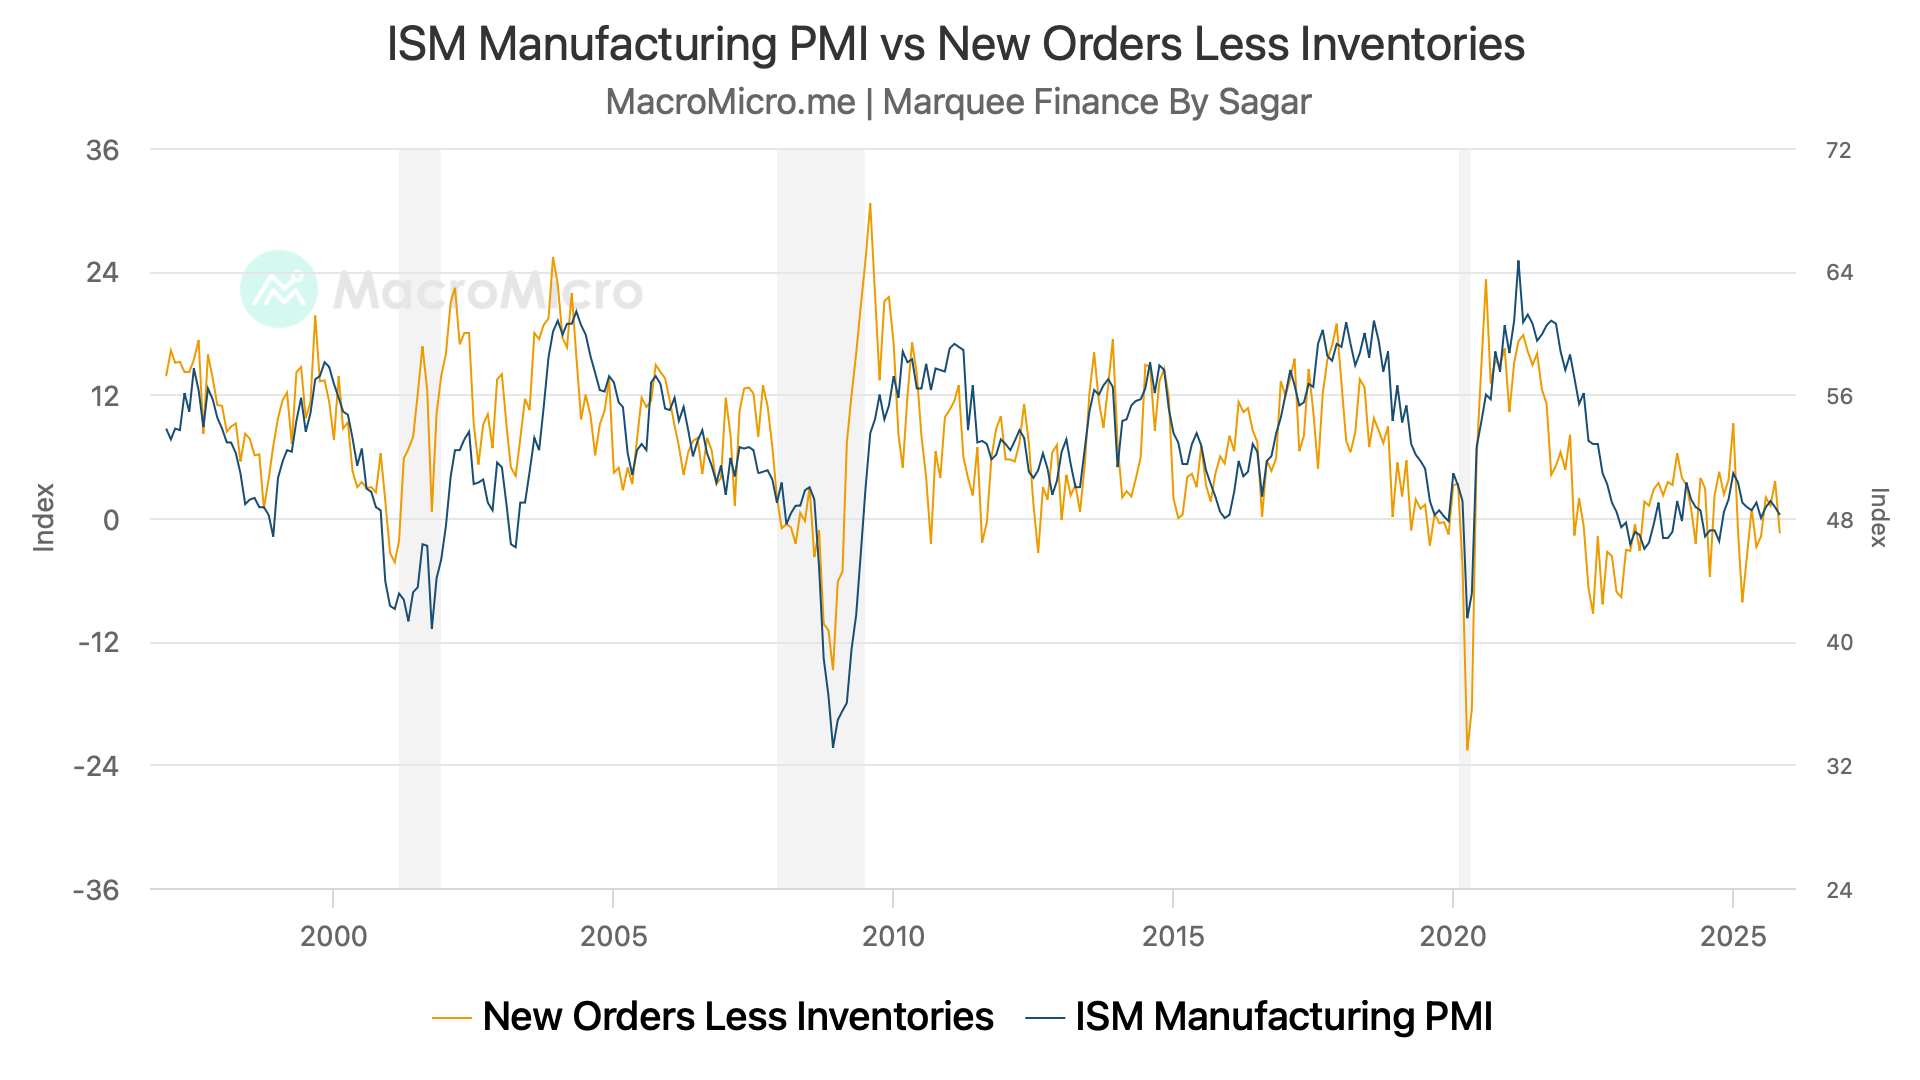
As we have always maintained that one can’t infer from a single month of data, but if the trend persists, then it will indicate that the manufacturing recession will deepen further (EX- the AI capex-related industries).
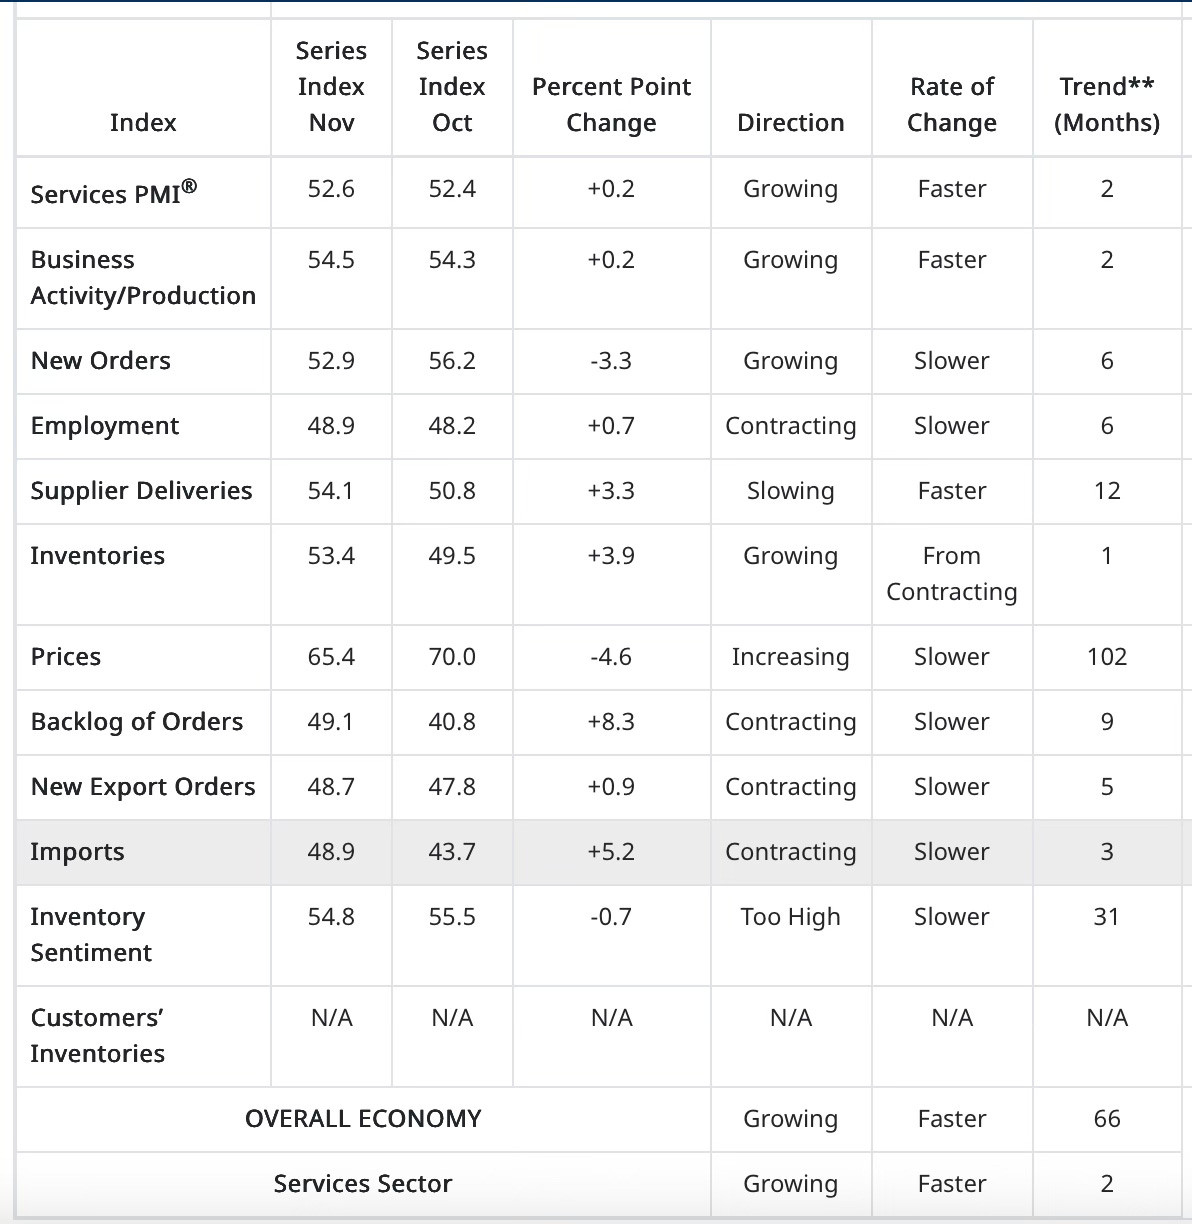
The headline ISM Services came in better than expectations at 52.6.
One of the comments in the ISM Services survey that caught our eye:
“Suppliers are very inconsistent on how they are planning and executing pricing related to tariffs. Overall uncertainty on how to source and how much to source is as high as during the coronavirus pandemic era.” [Accommodation & Food Services]
The tariff and the government lockdown have hurt the economy, and it will be visible in the data when we get the releases after 15th December.
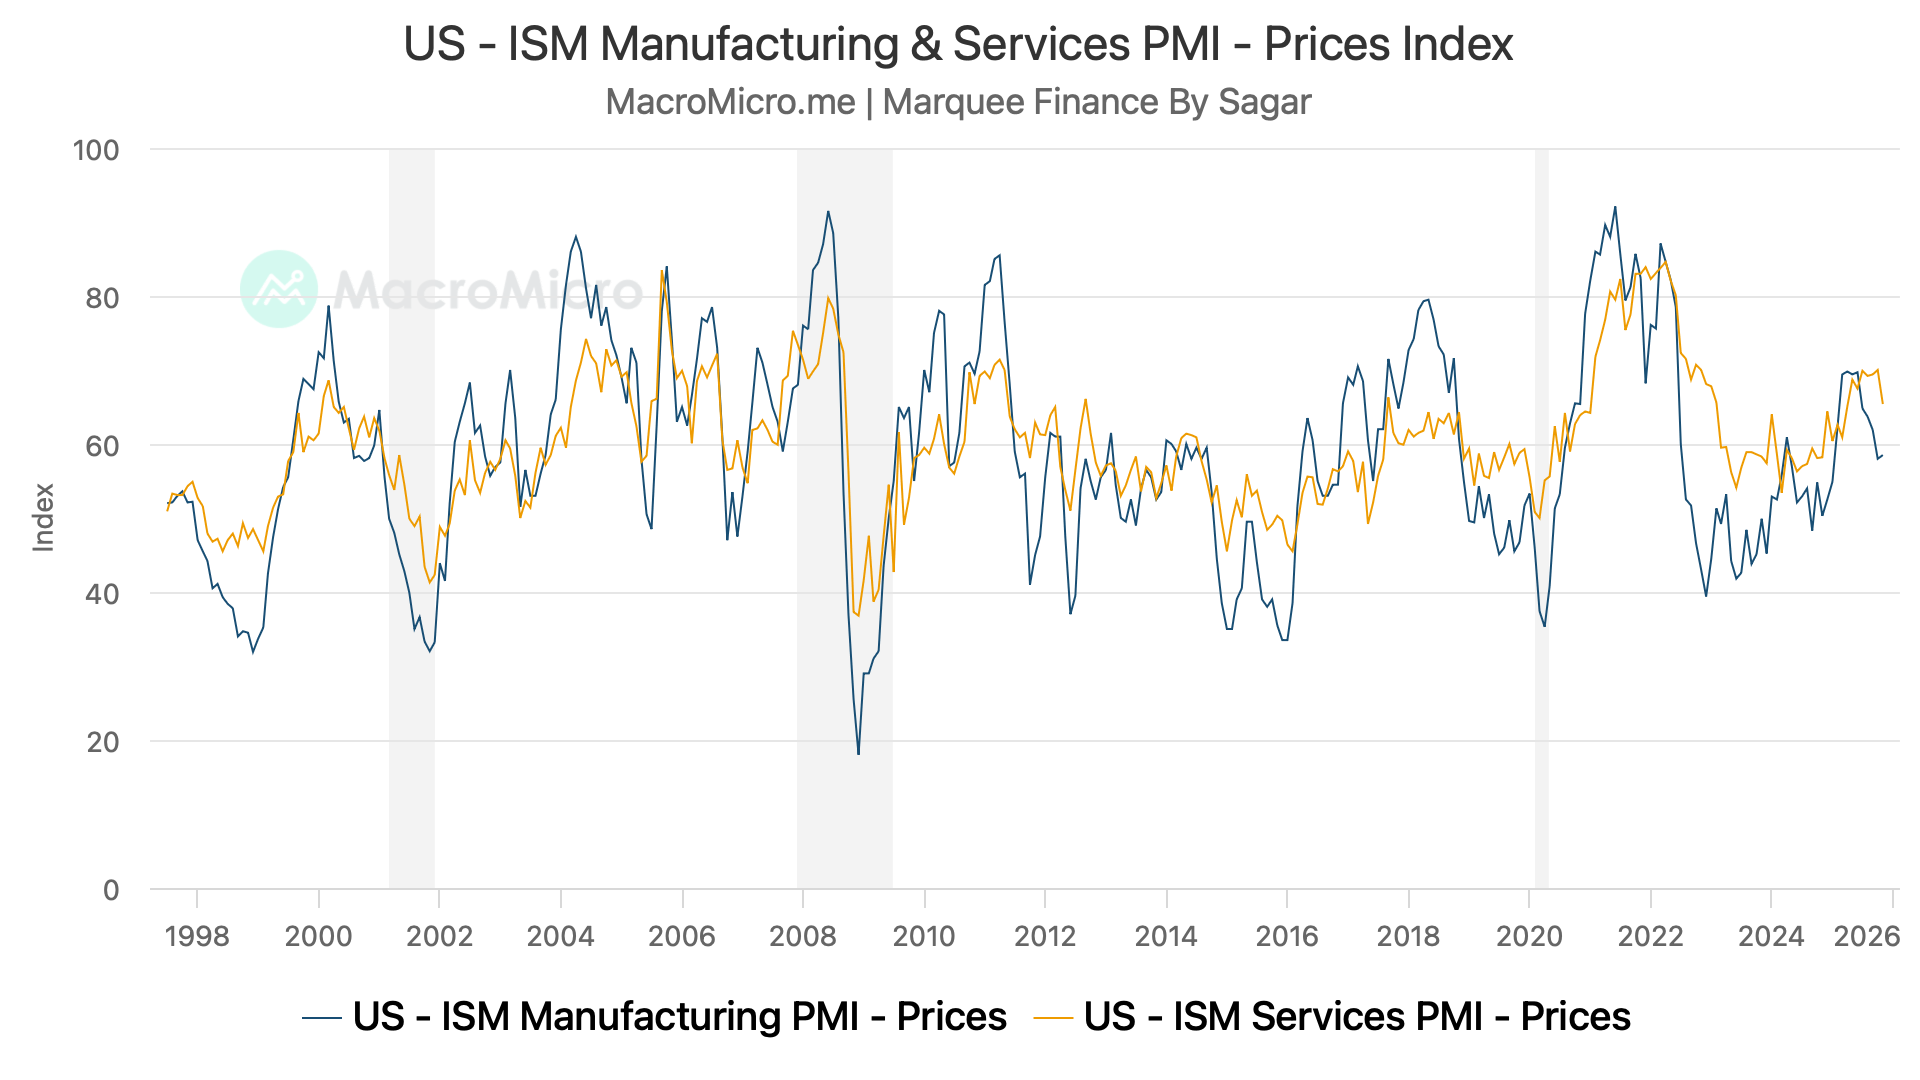
While the ISM Manufacturing Prices Paid is elevated at 58.5, we have seen some cooling in the ISM Services Prices Paid, which is now 65.4 from 70.
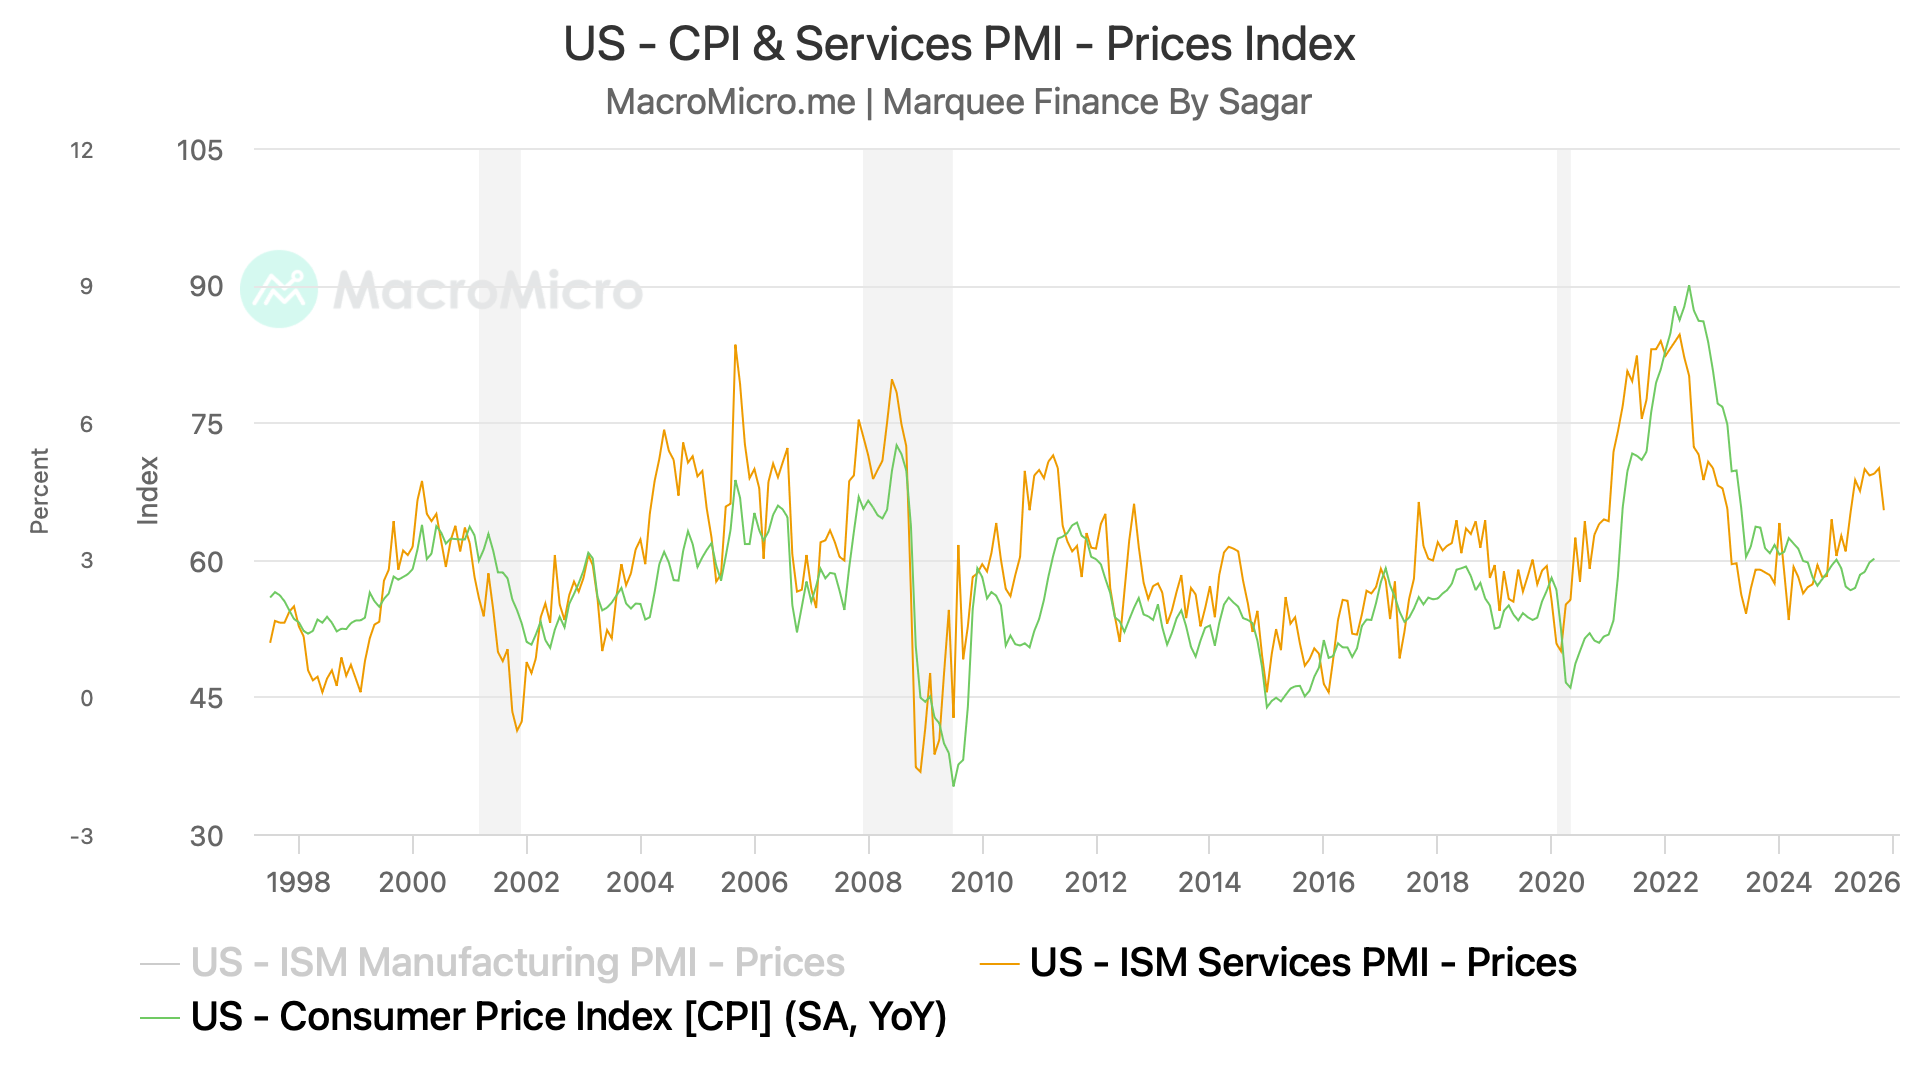
Our favourite chart from the ISM Services is ISM Services Prices Paid, as it is closely correlated with the US CPI.
From the chart, we can conclude that the CPI might rise in Q1 as old inventories are replenished, but if the ISM Services is to be believed (and if the downward trend continues), the spike will be temporary (transitory).
Now let’s jump to the most critical piece of the puzzle:
