
The D-Week has Arrived!
Are You Well Prepared For What's Coming??

As we enter one of the most crucial weeks of the year (the first time the Fed will cut this year), the speculative AI mania has reached unprecedented levels.
This week, we witnessed trillion-dollar companies trading like memecoins with spectacular moves in Oracle and Tesla.
Considering the horrendous earnings report by Oracle, where Free Cash Flow (FCF) turned negative, the “optimism” about the future earnings led the stock to witness the highest one-day gain since 1999.
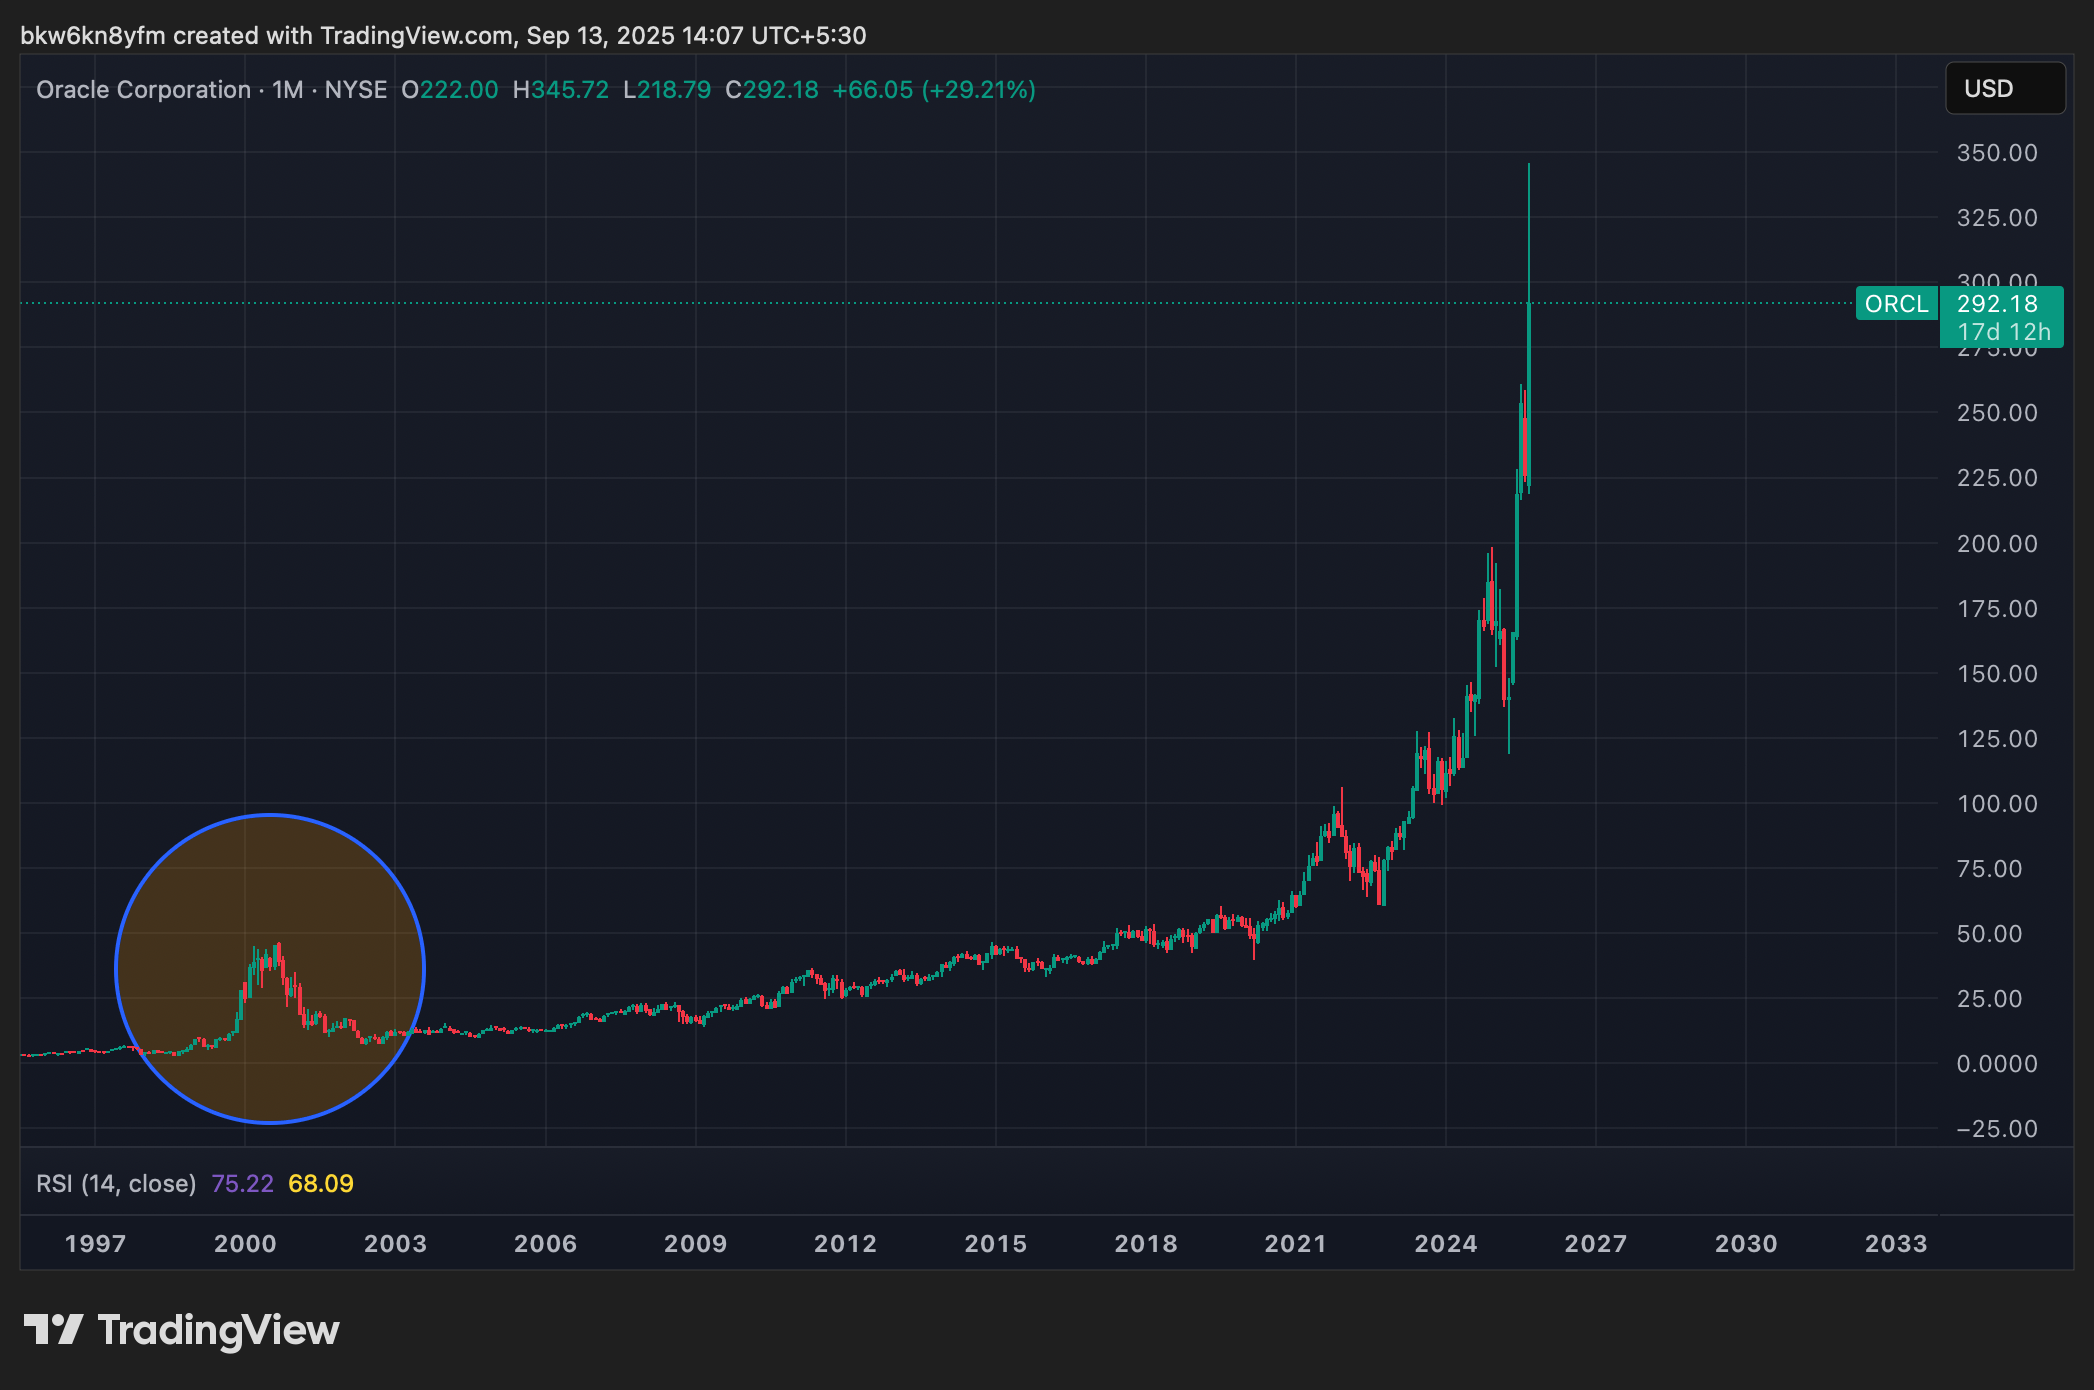
Unsurprisingly, the pattern is precisely similar to the 1997-2001 period.
However, the million-dollar question is where we are in the period.
While some market participants believe we are near the end (March 2000), some believe that we are in early 1999 and the bubble will grow much much bigger in the coming year as the Fed cut rates and inflation rebounds.
While nobody knows where we are (everybody has a guess), traders must follow risk management, and long-term investors should adequately hedge their portfolios.
With volatility in all asset classes (FX, equities, and bonds) extremely suppressed, we expect wild moves in the coming weeks.
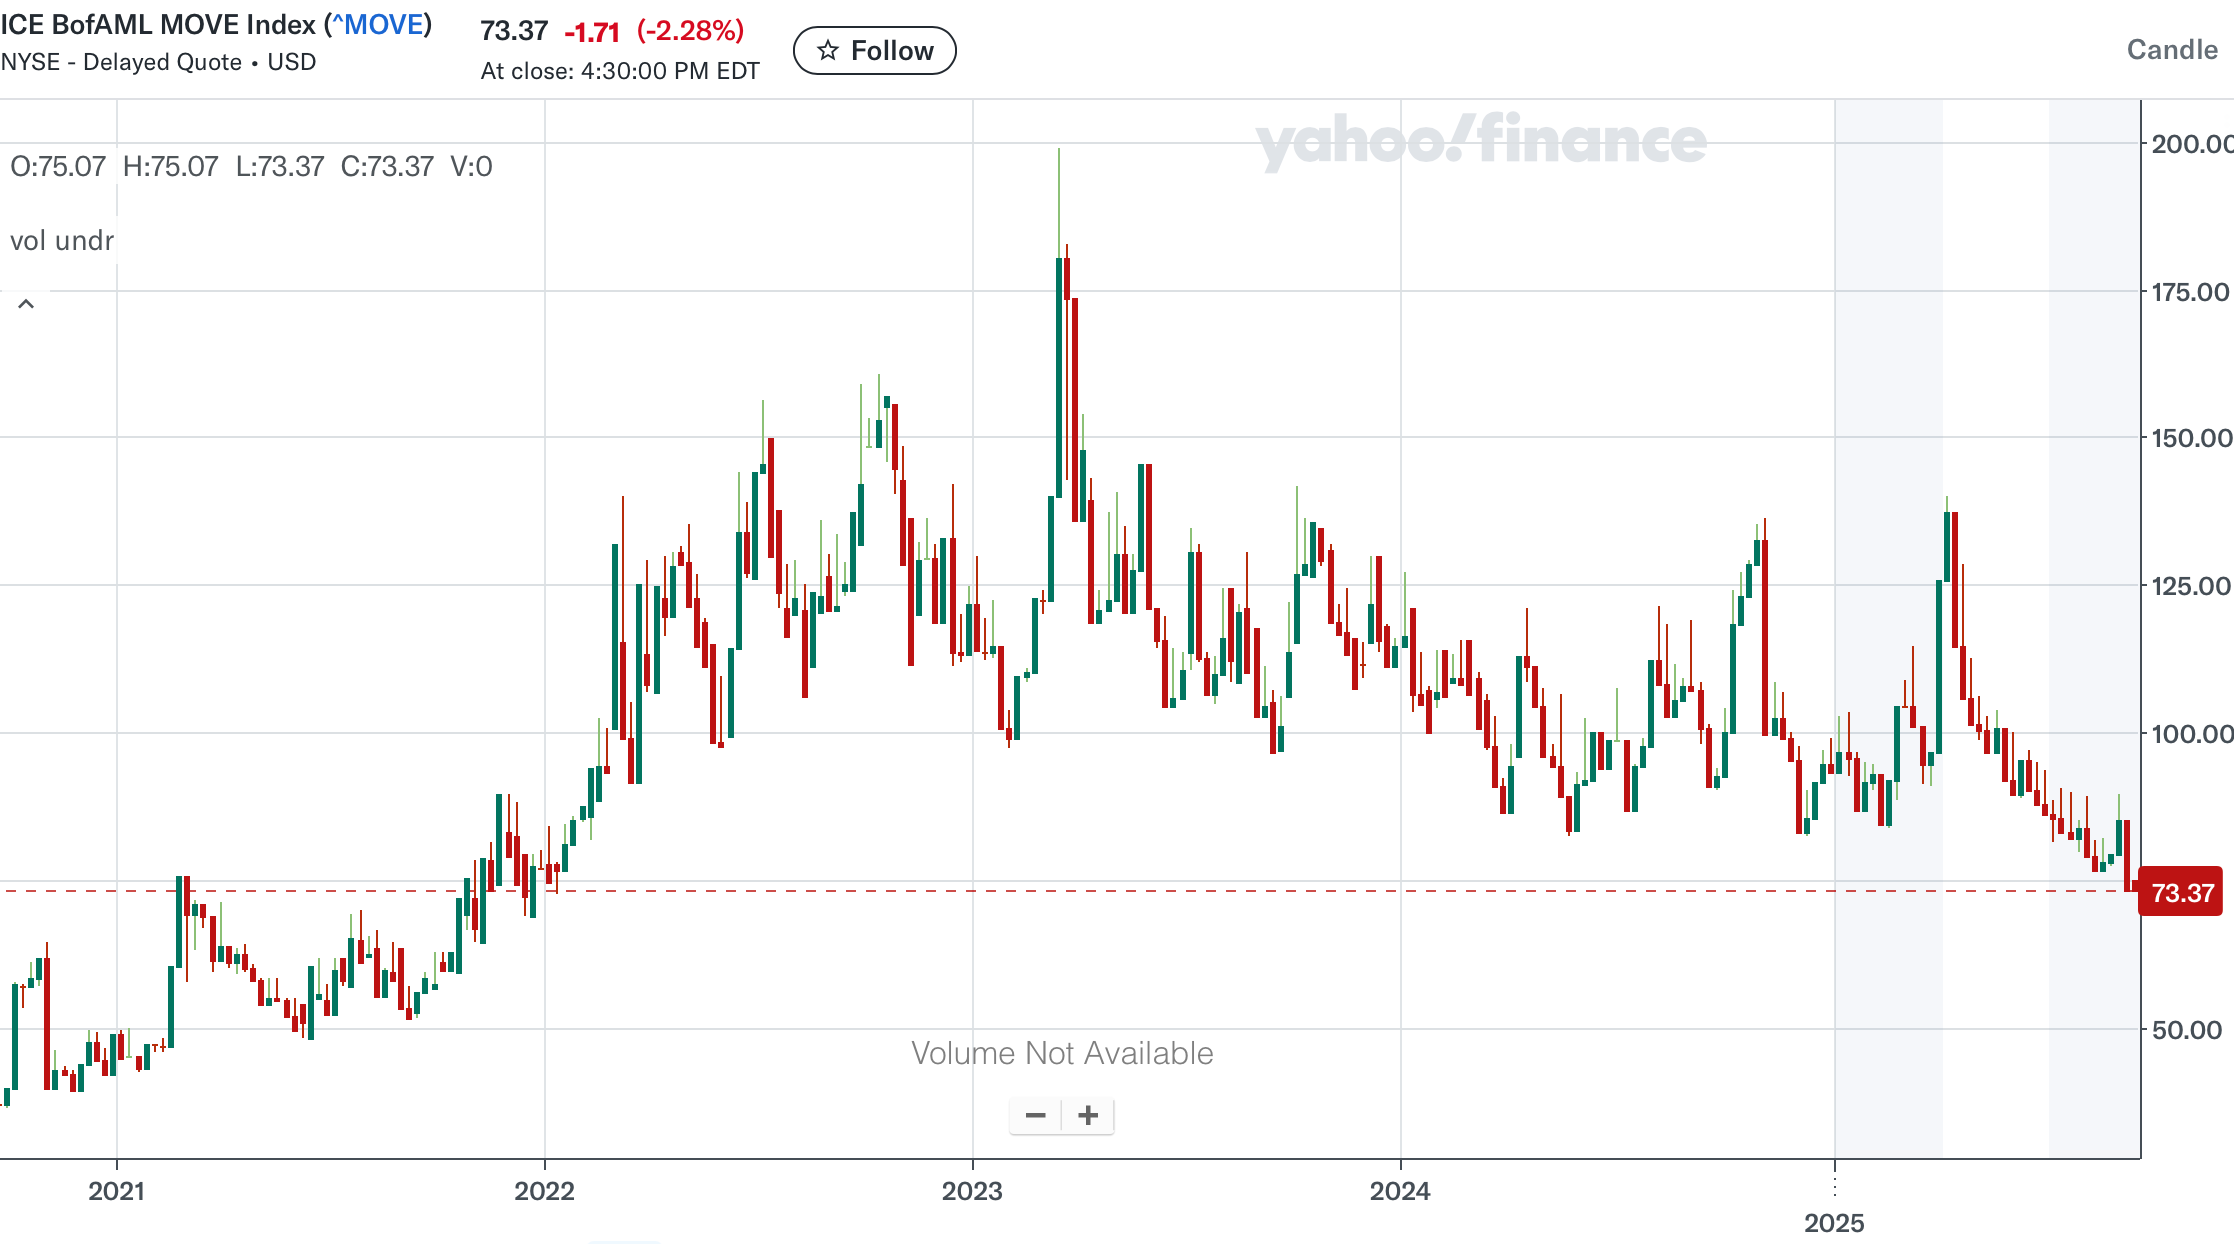
Ironically, the MOVE Index is at its lowest since 2022, indicating calm in the bond markets.
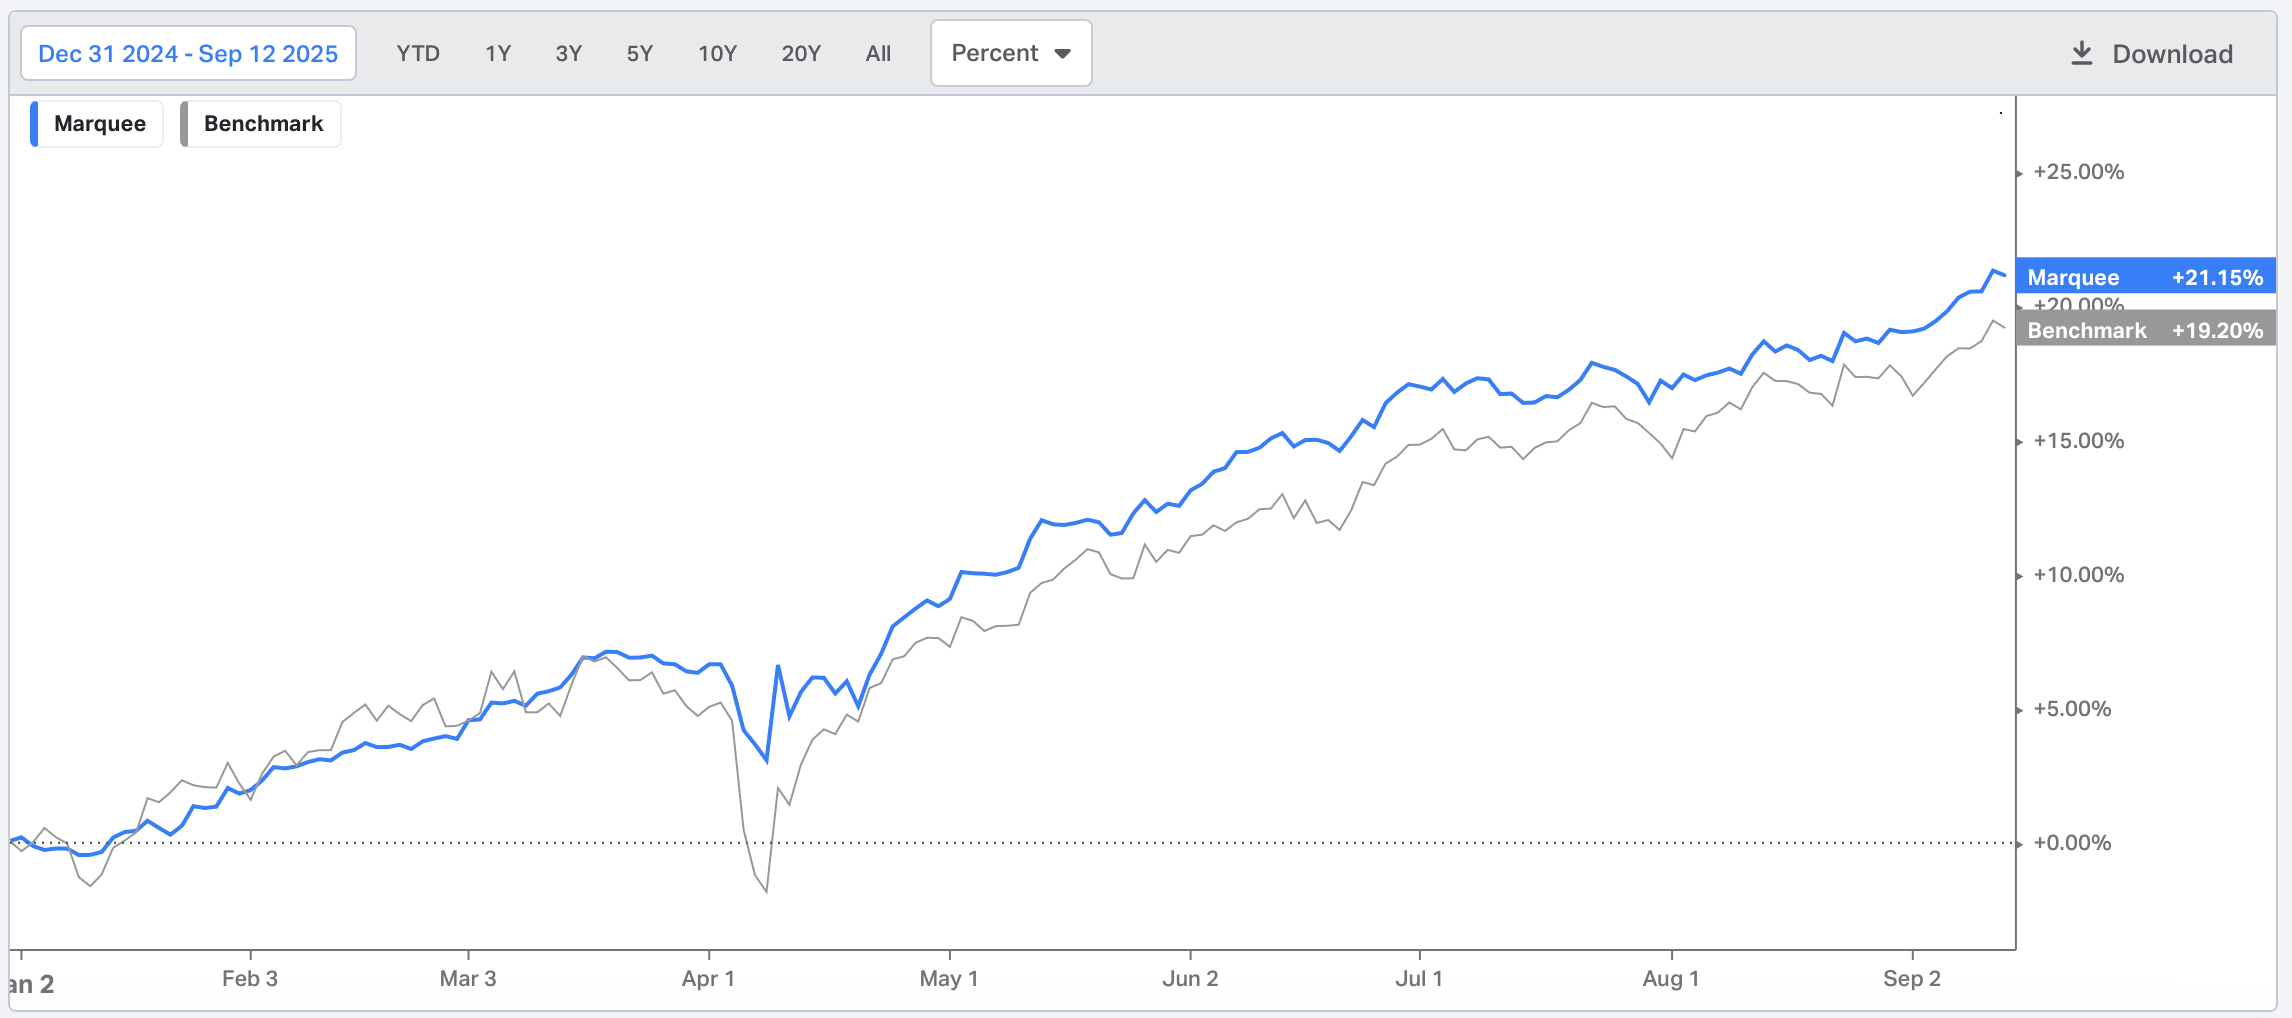
We are now up more than 21% YTD (outperforming our benchmark by 200 bps) as our trading positions continue to log in high single-digit/double-digit gains across asset classes.
PS: New and old subscribers please make sure to avoid Apply Pay as it charges enormous fees. Please use other mediums of payment.
Let’s dig deeper into the macro world and analyse the cross-asset moves!
US/Bonds/Equities/Gold/Silver/Oil/Dollar!
We begin this week’s data dump with the PPI, which shocked the street with a big miss.
The headline PPI came in at -0.1% MoM vs Exp. 0.3%, while the Core PPI came in at -0.1% MoM vs Exp. 0.3%.
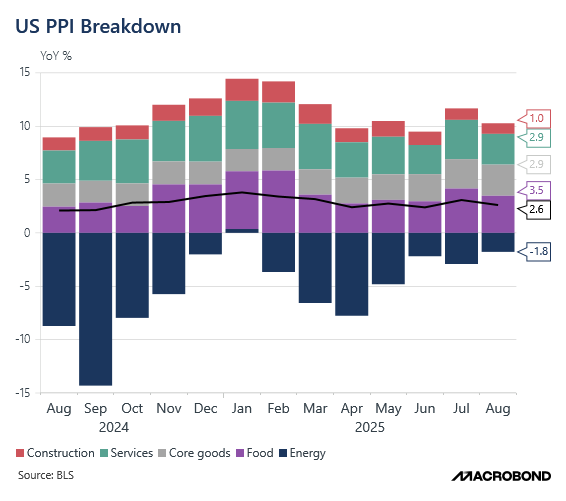
If the PPI continues to trend lower while the CPI rises, there will be a profound impact on corporate profitability, so we need to watch the trend here closely.
The headline CPI came in at 0.39% MoM, and the Core CPI came in at 0.32% MoM. While headline CPI was in line with estimates, the Core CPI came in slightly higher than estimates.
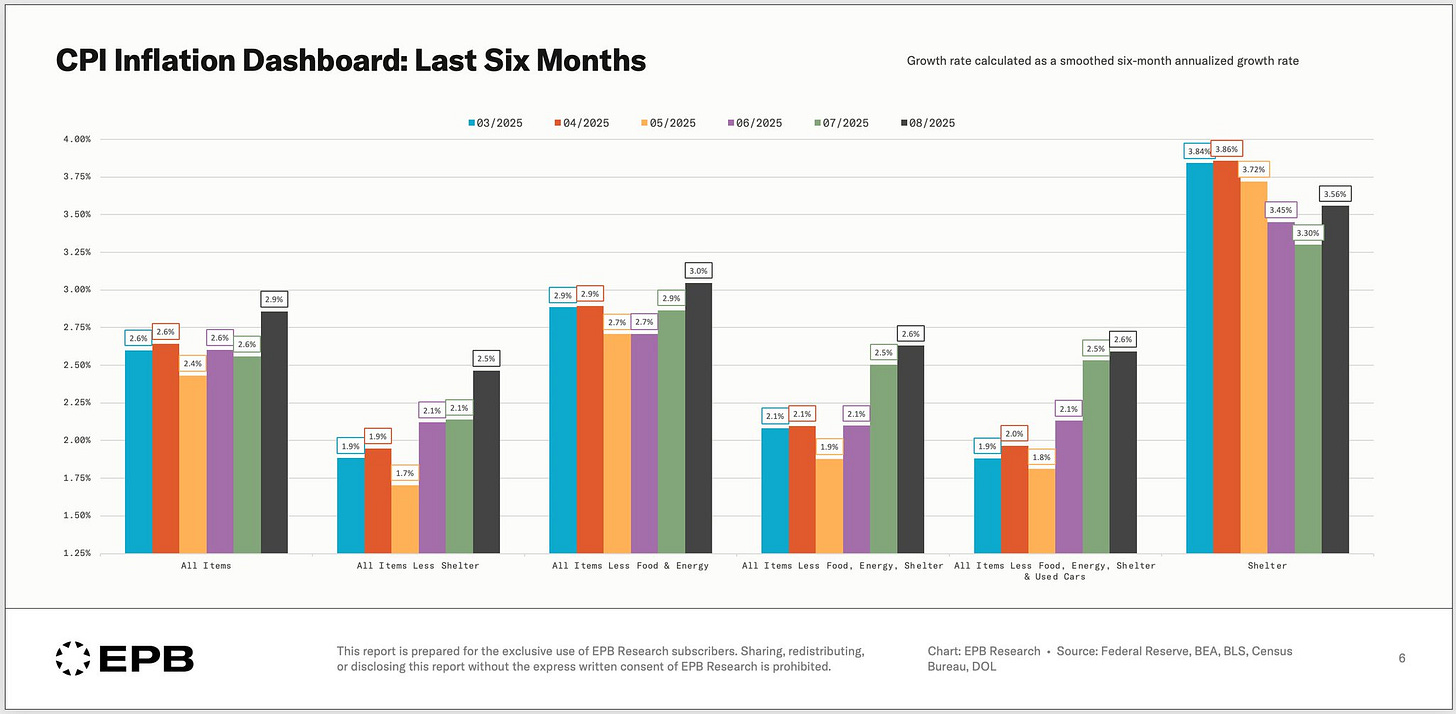
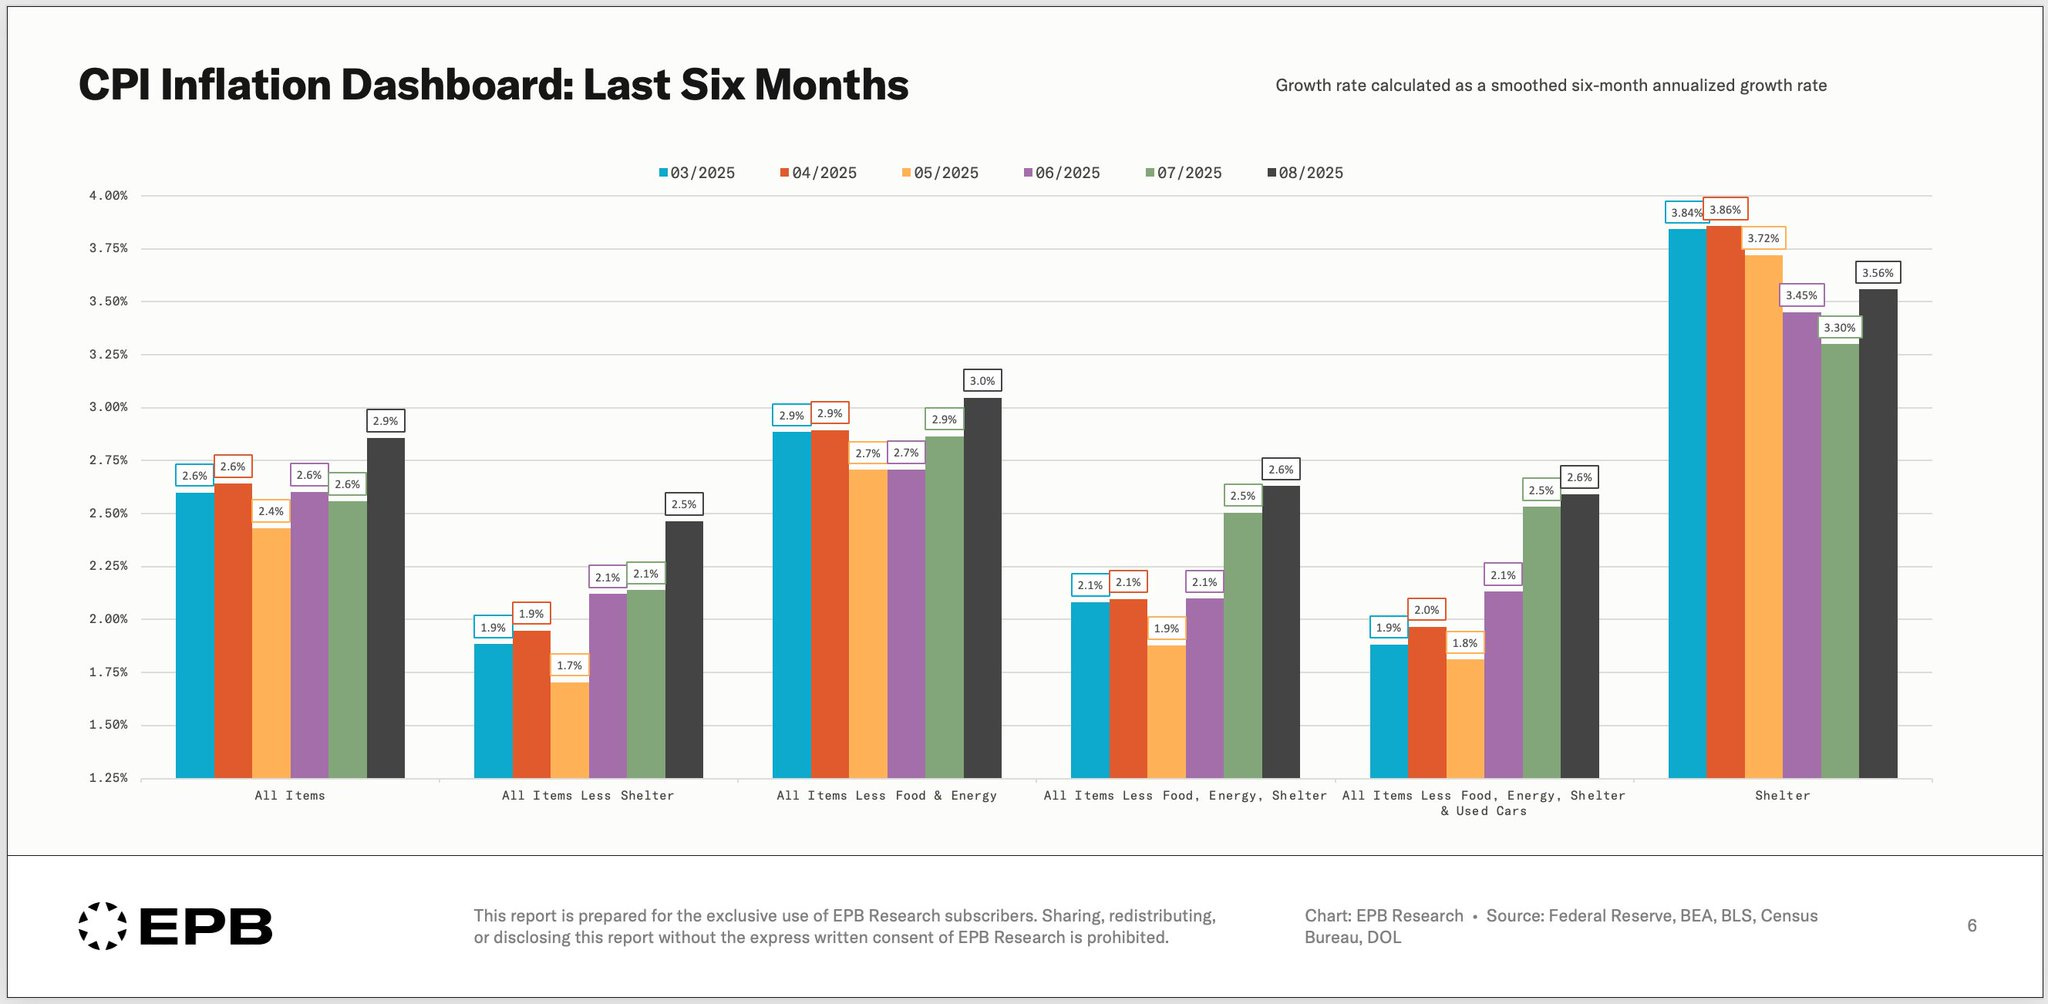
To understand the CPI in detail, we have compiled a CPI Chartbook for this month:
Overall Picture: In this chart, you can see: CPI Headline, CPI Less Shelter, CPI Core, CPI Supercore, CPI Supercore Ex-Used Cars and CPI Shelter in this order. As we can observe, the trend across all metrics (except Shelter) is crystal clear, and the chart undoubtedly indicates bottoming out of inflation.
The Shelter was in a downtrend but unexpectedly rose this month. We will have to see whether this month’s data was a one-off or the trend has reversed here (according to Zillow and other metrics, the rents remain in a fierce downtrend).
Source: EPB Macro
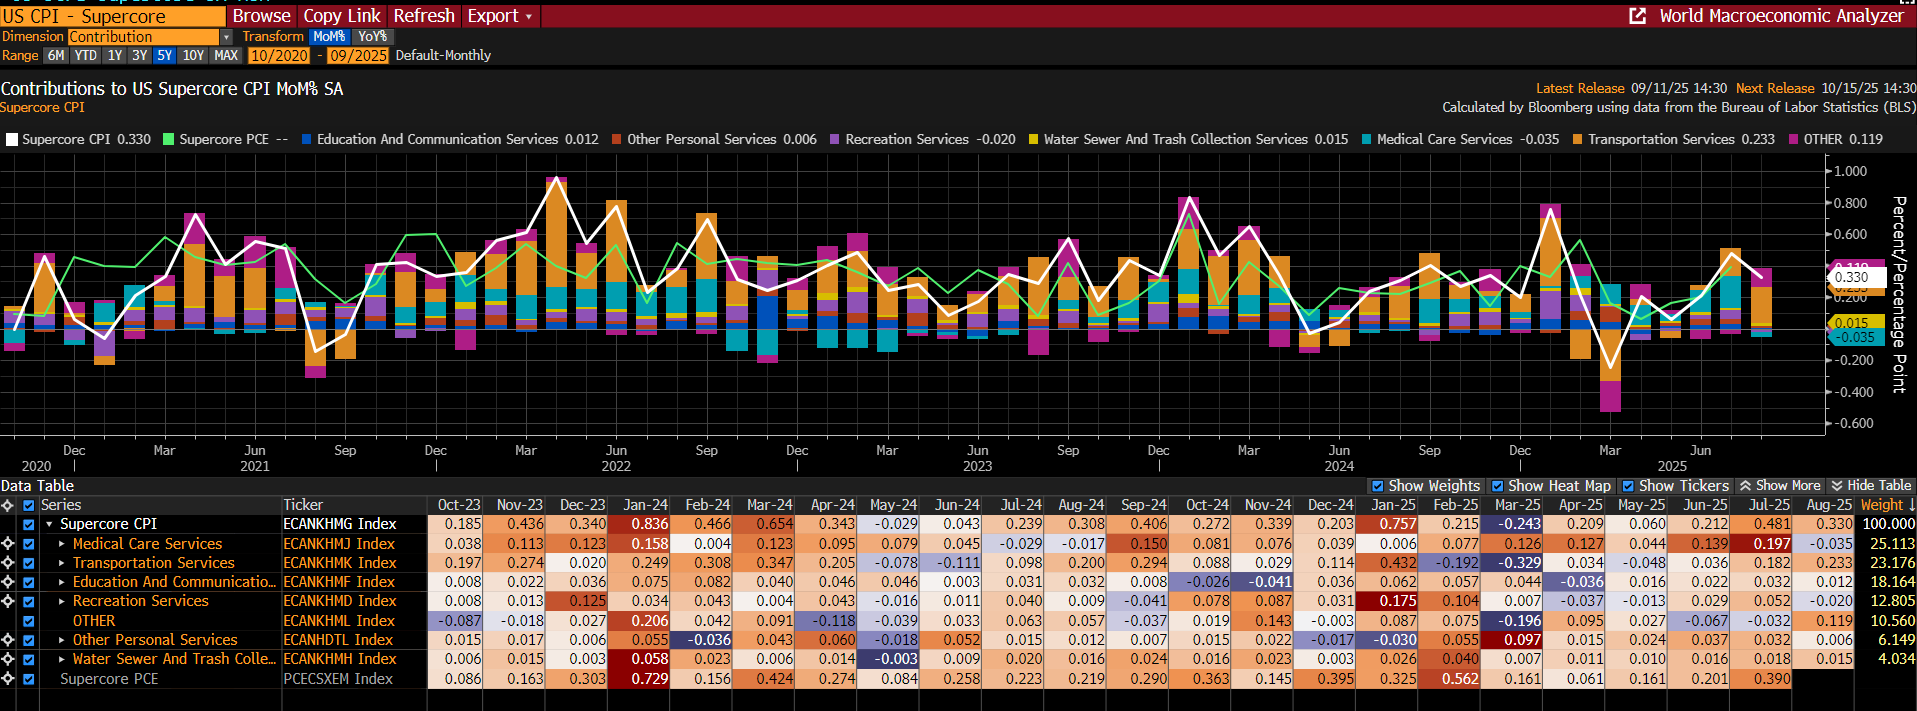
The Supercore: JayPo made the Supercore CPI (Services Ex Shelter) famous when he raised rates in 2022 after the transitory fiasco. Though the Supercore has moderated from last month, the reading is still high (3.96% annualised) and demonstrates stickier services inflation. Notably, Transportation Services is leading the charge and is once again in a strong uptrend (base effect should kick in the next few months, though).

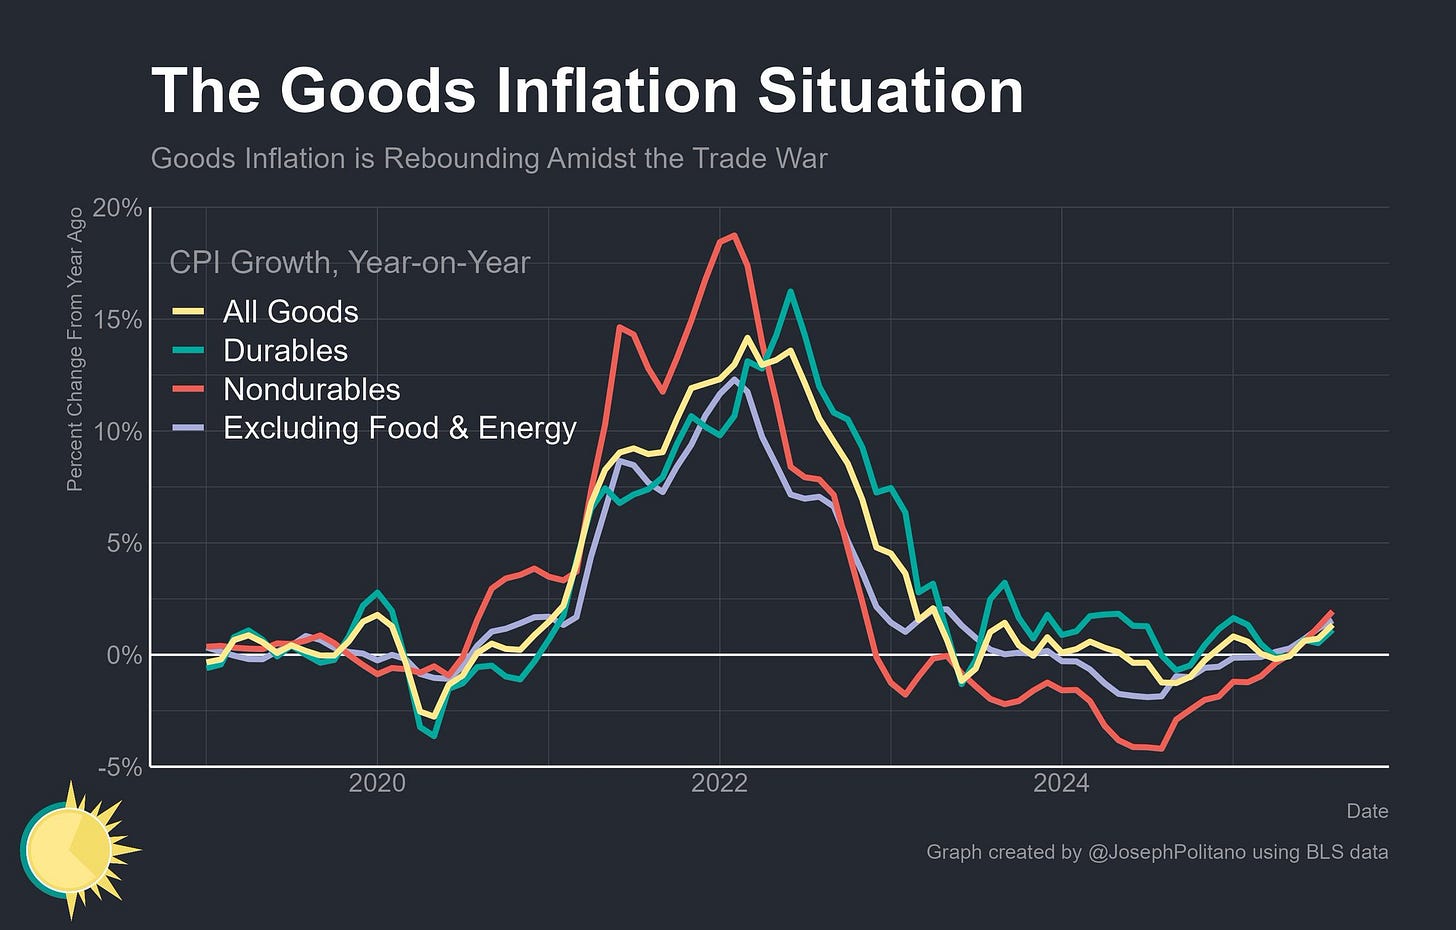
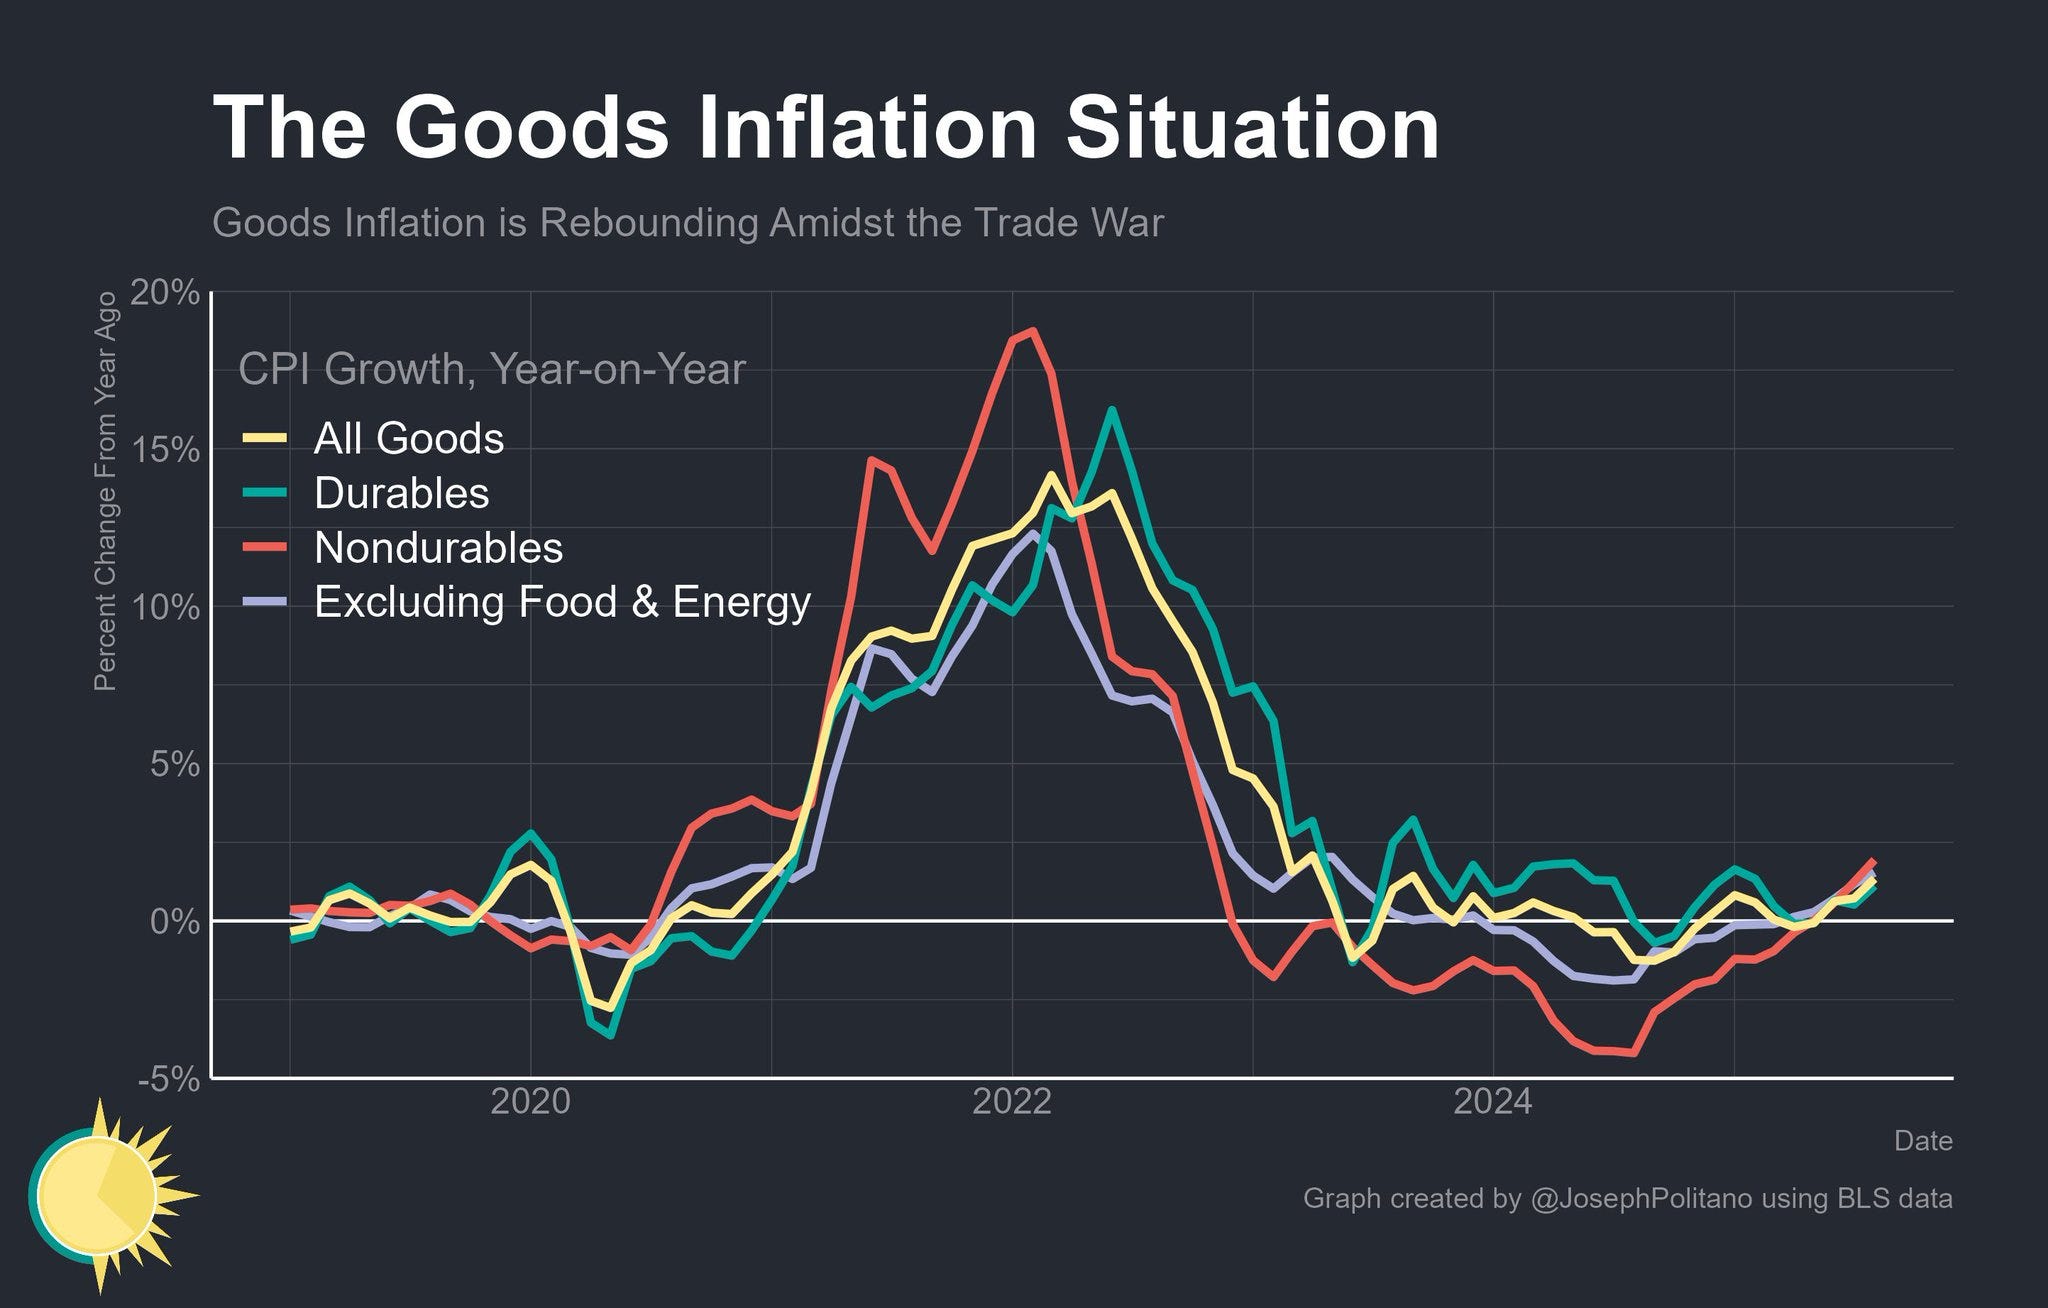
Goods Inflation: When we predict that the higher tariffs will lead to higher prices, this transpires in two ways. Firstly, it’s the good inflation, and then after a lag, higher prices are seen in services as well. Note that due to enormous front-loading and inventory buildup, there was a delay in the tariff-fueled goods inflation. We are now witnessing higher CPI across the goods basket.
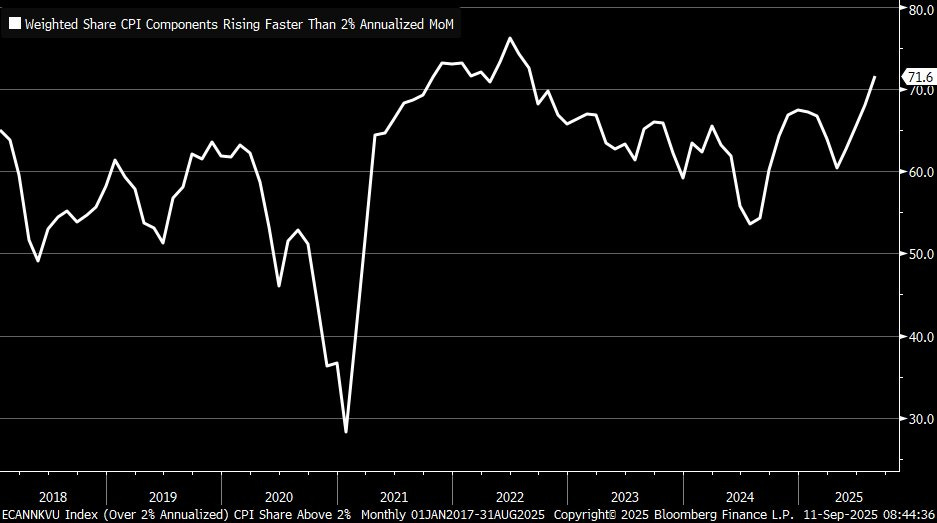
The Most Concerning Part: If a few components lead the CPI higher, we can ignore the readings and call it a one-off, but ironically, there is a broad-based rise in prices with CPI components rising faster than 2% annualised MoM, jumping to 71.6%, the highest since 2022. Furthermore, you can’t dismiss the fact that CPI is a lagging indicator.

After analysing in detail, we can conclude that inflation by December 2025 will..
