
The Shakeout!

The first week of every month is the most important for macro traders/investors as we get the critical data that the central banks all around keep a close watch on.
The bond and equity markets react violently as rates expectation swiftly moves , and the equity markets “generally” follows the credit markets (barring episodes when the liquidity Tsunami rules the streets).
This week was quite eventful across asset markets as the 10Y yield in the West created havoc. In the UK, yields ripped as persistent core inflationary pressures led to markets pricing in a 6.5% terminal rate, significantly higher than the US.
In the US, the 10Y is back to the levels seen before the SVB demise in March. As the labour market data surprises on the upside, the odds of a rate hike in “November” has risen considerably.
With the “shakeout” in the bond markets and a significant drop in Central Bank liquidity, an interim top in equities has seemed to materialise.
Let’s understand, with super interesting charts, the data dump of the week!
US Macro Data!
This week, we got the all-important ISM data and the closely watched Non-Farm Payrolls (NFP) data.
ISM Manufacturing, the best metric to gauge cyclical activity, is the favourite leading indicator for macro traders/investors.
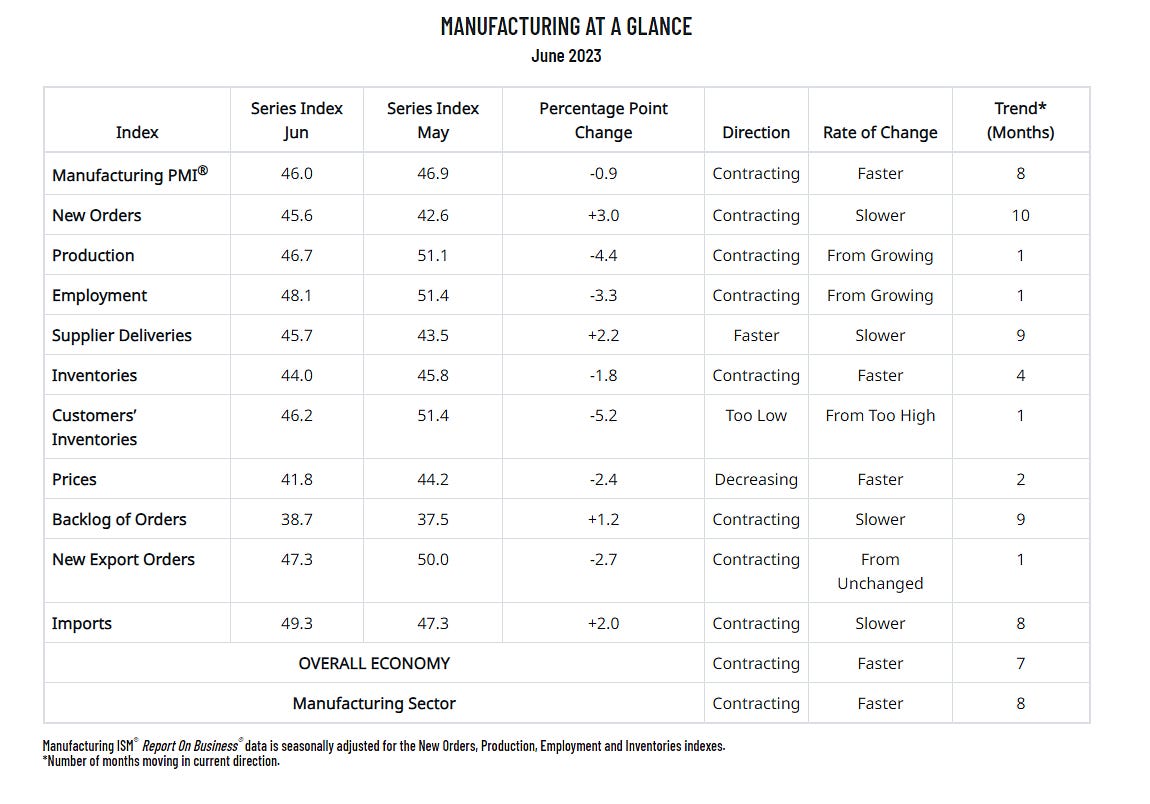
One of the astounding facts about this month’s ISM Manufacturing data was that all the sub-components are in the contraction territory (below 50), a rare phenomenon often seen during recessionary periods.
The New Orders Less Inventories have been my preferred gauge. Digging deeper,
