"Whatever It Takes"!

If you thought that 2025 was a tumultuous year in the markets with wild cross-asset swings, then 2026 has begun with a bang.
The US under Trump is doing “whatever it takes” to maintain the dollar’s hegemony by taking steps one wouldn’t have thought possible in their wildest dreams.
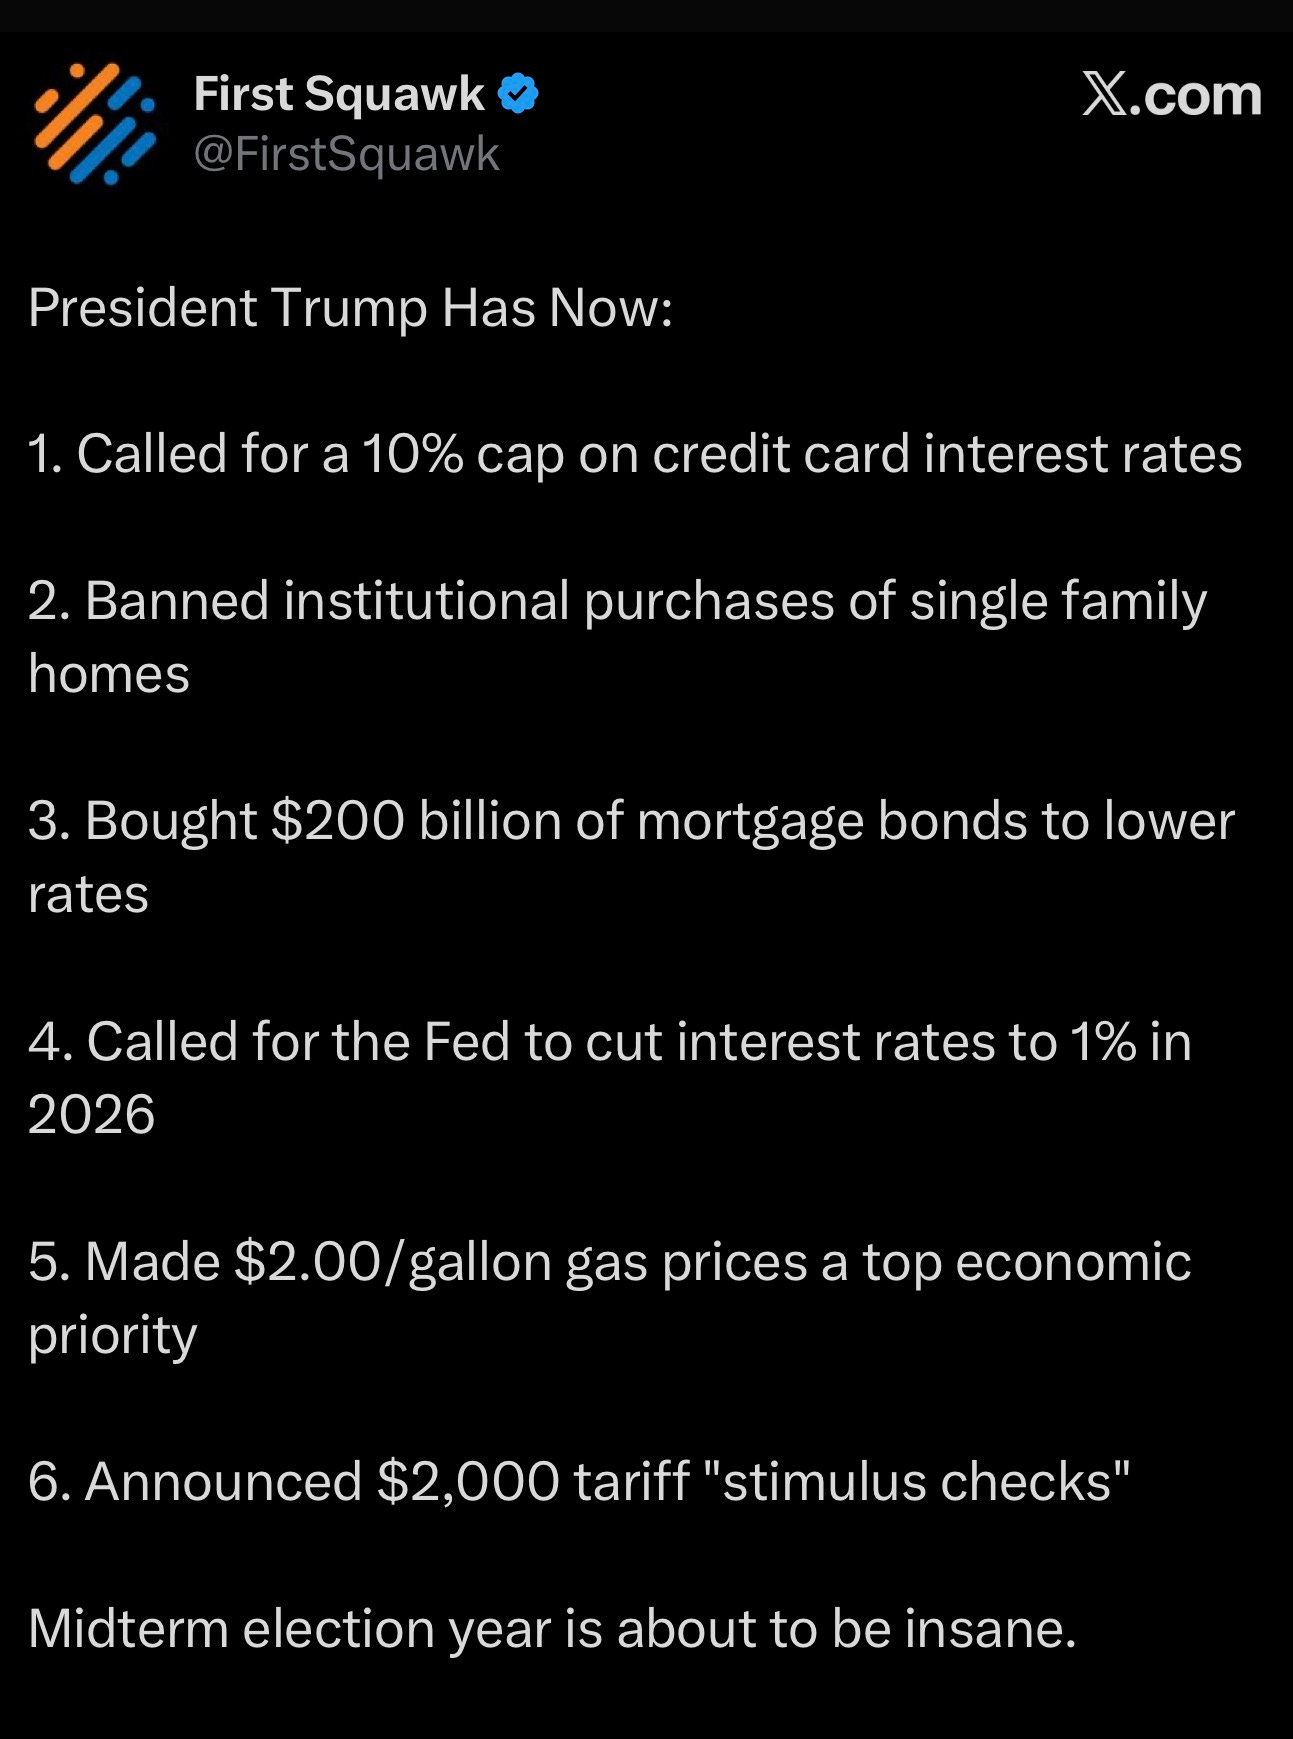
Furthermore, as the mid-term elections loom late this year, Trump has, in the last few days, made a series of decisions to support the struggling part of the economy.
Housing has been in a recession for the last 18 months, and the Trump administration has acknowledged this.
However, for the first time since Trump took office, we are witnessing the government’s urgency to revive the housing market.
Furthermore, the K-shaped recovery has left low-income households under severe stress.
As a result, Trump is now proposing to cap credit card APRs at 10%. Although this can’t be implemented via an executive decision, lowering APR by pressurising banks will eventually choke credit and have the opposite effect to what’s desired.
It’s too early to conclude, but the intent of the administration seems to be to revive the animal spirits in the US economy by propping up the cyclical part of the economy while at the same time augmenting its influence in resource-rich economies to secure natural resource/commodities supplies.
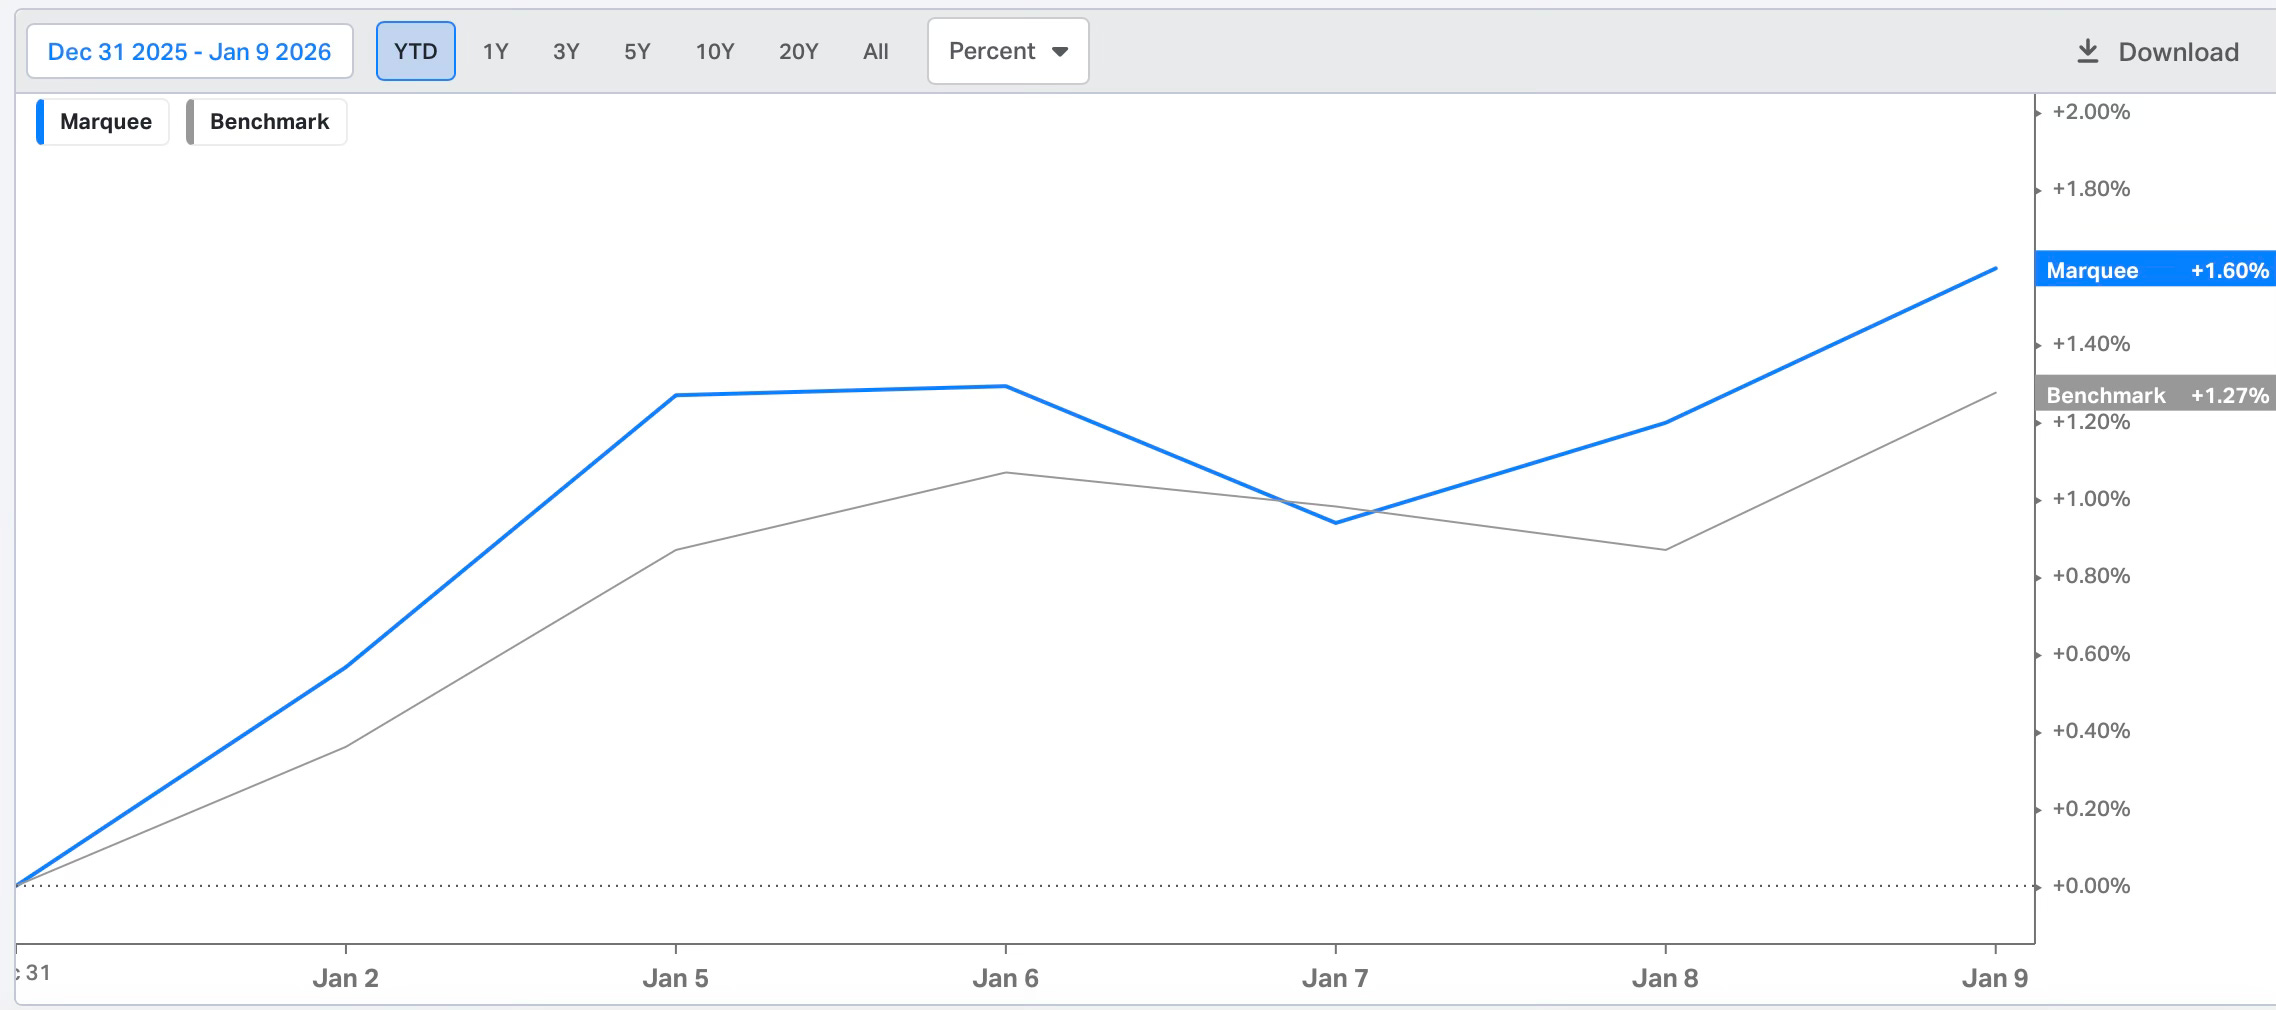
We are up 1.6% YTD as all our positions except a few have been firing up.
Let’s decipher the extensive macro data released this week and comprehend the cross-asset moves!
US/Equities/Bonds/Gold/Silver/Dollar/Oil!
We begin with our favourite indicator to gauge the cyclical activity in the US economy.
The ISM Manufacturing came in soft with the headline index reading at 47.9, marking the 10th consecutive month of contraction (below 50).
The sub-components demonstrate overall weakness.
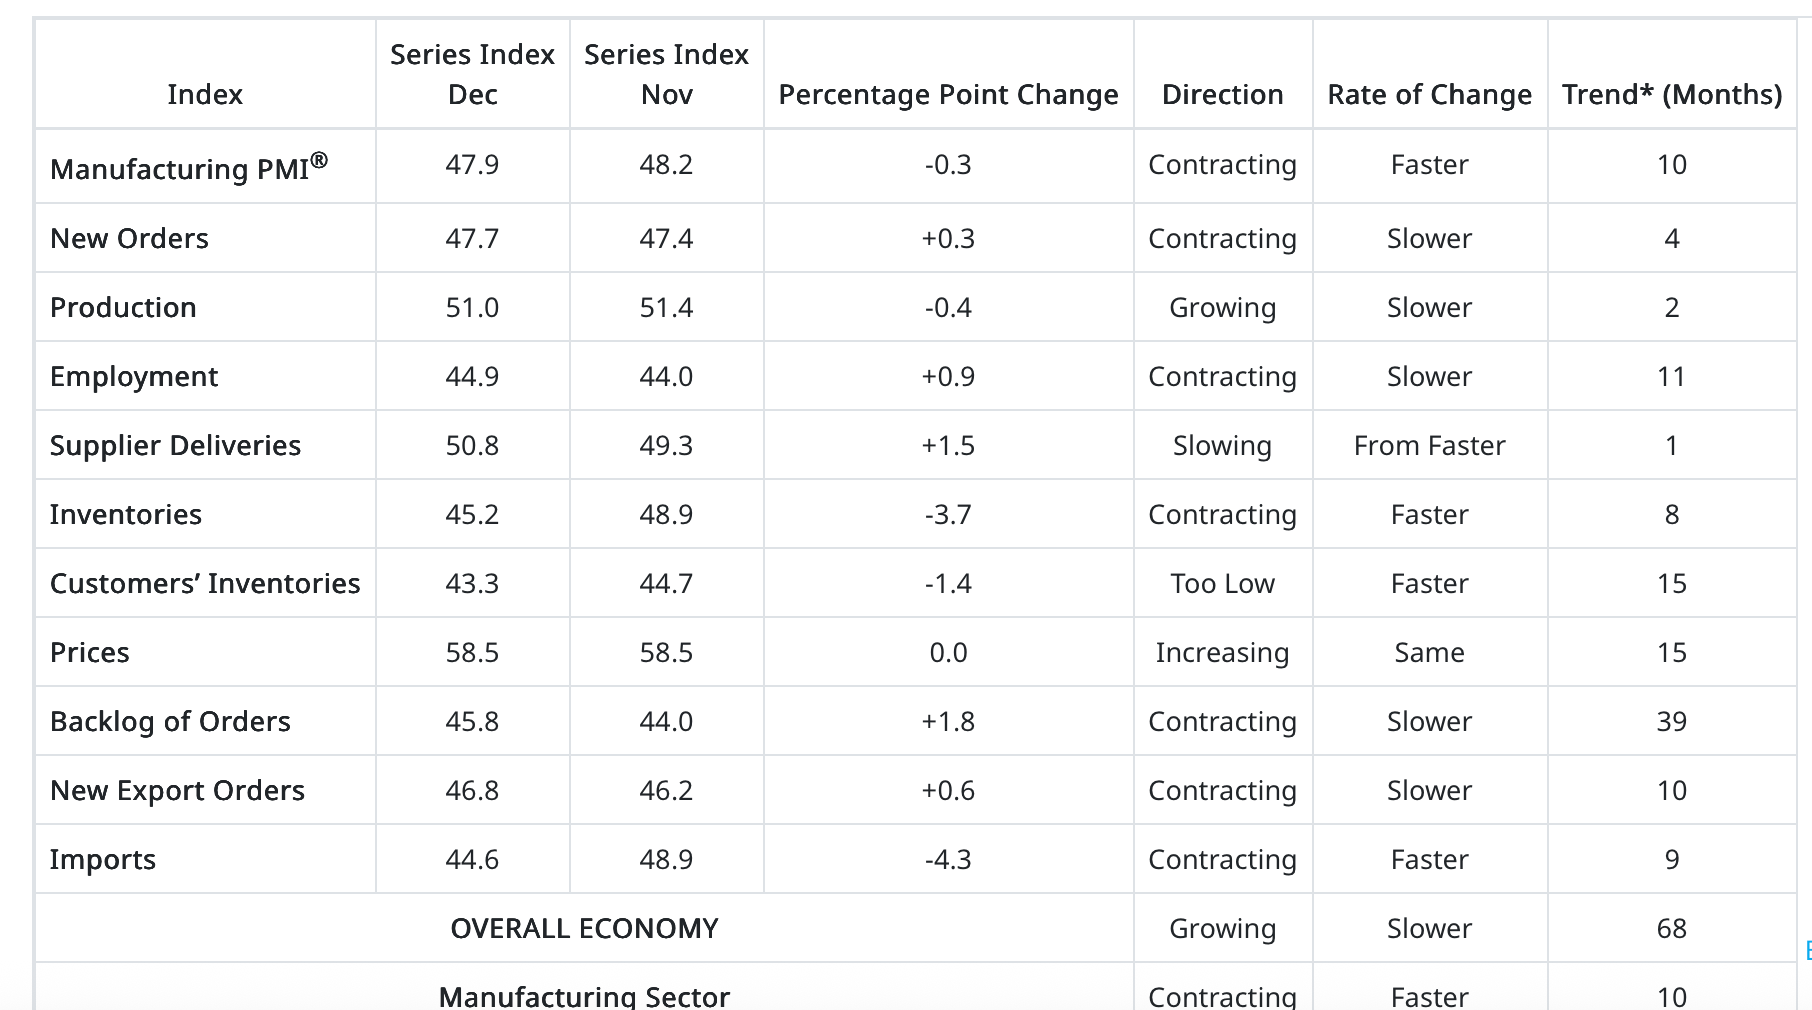
Furthermore, the comments from the survey indicate the pain faced by businesses across the board:
“Things are quieter regarding tariffs, but prices for all products remain higher. Our costs have increased, so we have increased prices for our customers to compensate. Margins have deteriorated, as full pass-through (of cost increases) is not possible.” [Computer & Electronic Products]
“Things are not improving in the transportation equipment market. Many customers are ordering for 2026, but those orders are 20% to 30% below their historical buying patterns. Some large fleets are still completely on hold for 2026, with zero capital expenditures money available to fleet budgets. Truck rental utilisation, which is a good benchmark for the health of the economy, is still below historically stable levels. The general mood of the industry is that the first half of 2026 will be another bust, and we’re now hoping things pick up in the second half, even as the North American truck fleet continues to age.” [Transportation Equipment].
“Orders continue to drop for most of our businesses. Many plants are not running near full capacity. Make to order being utilized where possible.” [Chemical Products]
“Order levels have continued to decline: We had a bad October, an awful November and a dismal December. January and February don’t look too good, as bookings are down 25% compared to the first two months of 2025.” [Fabricated Metal Products]
Note that we prefer ISM Data as it is one of the leading indicators of the cyclical economy.
If there is a bounce and revival in activity, we will first see it in the ISM data.
ISM New Orders Less Inventories leads the headline number.
It has been trendless in the past few months.
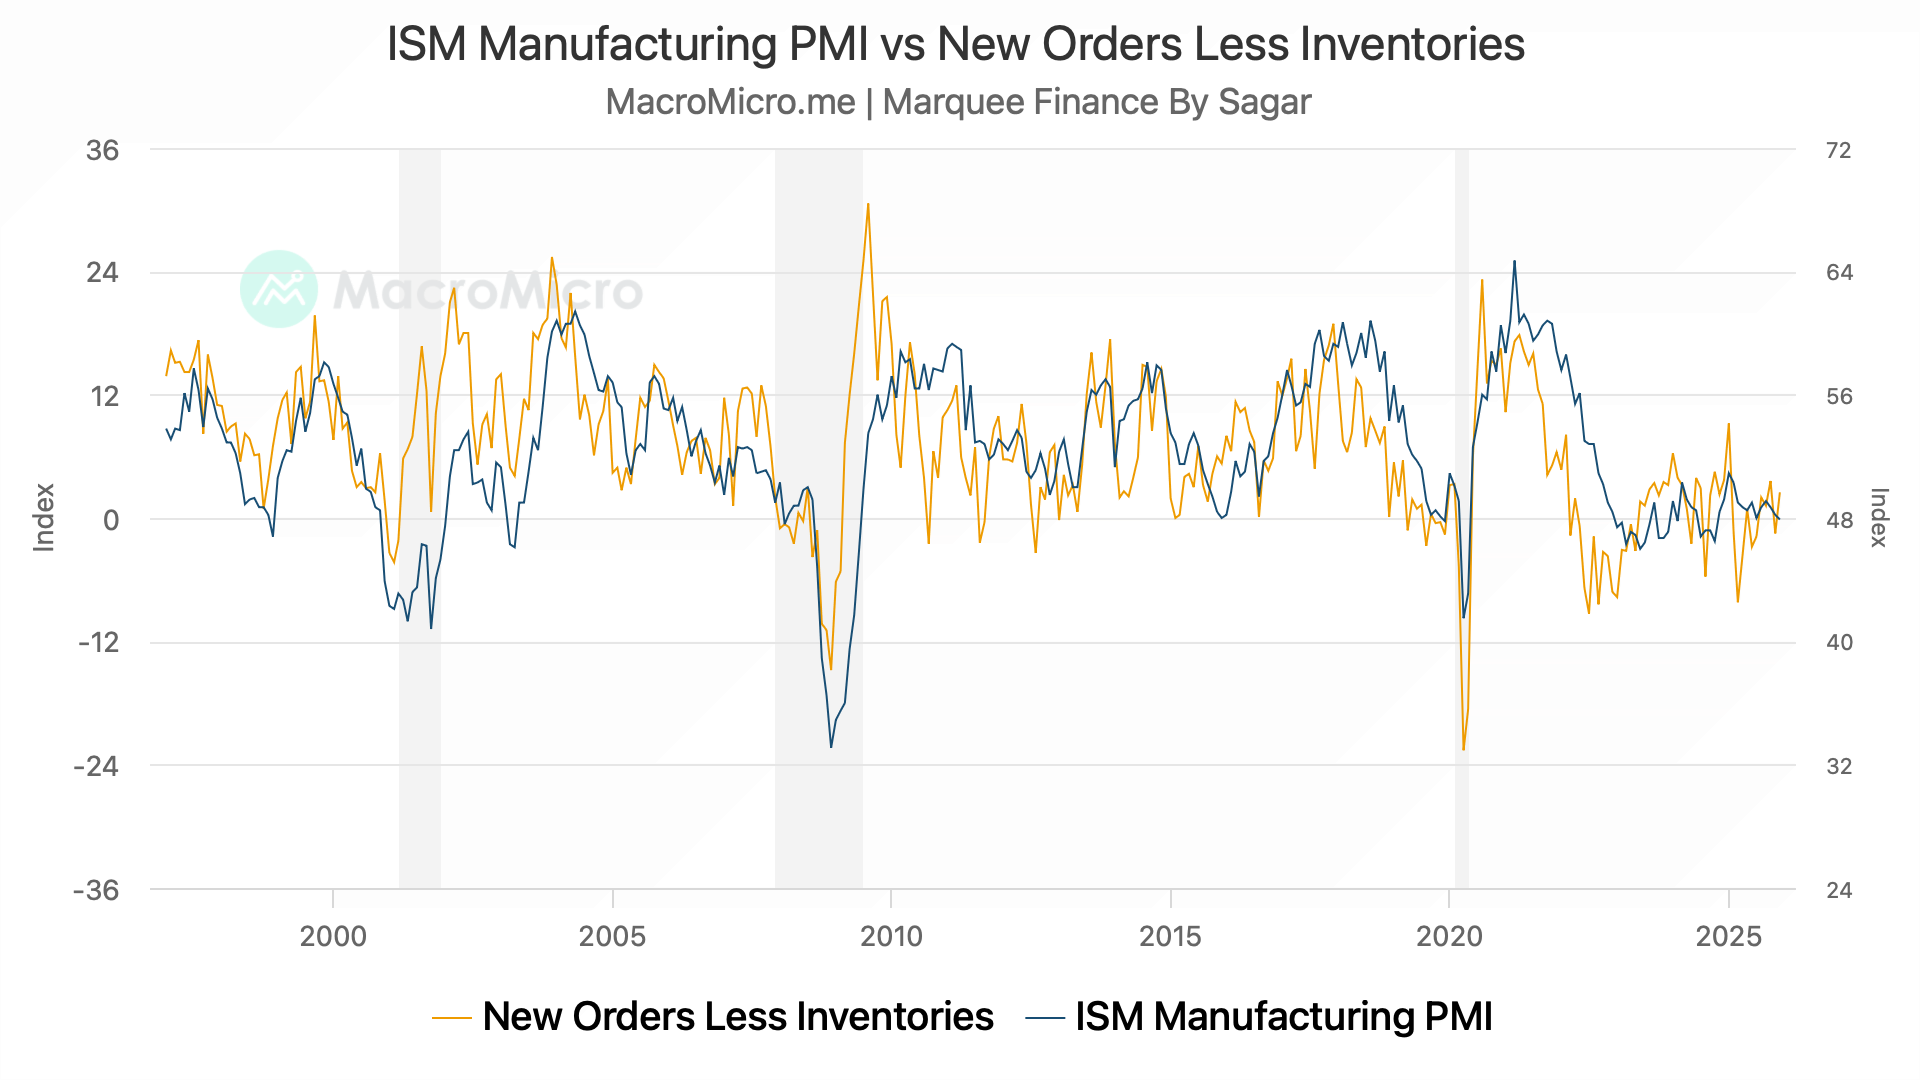
However, with inventories contracting at a faster pace, any demand boost can lead to higher new orders.
Thus, we will maintain a close vigil on the data in the coming months.
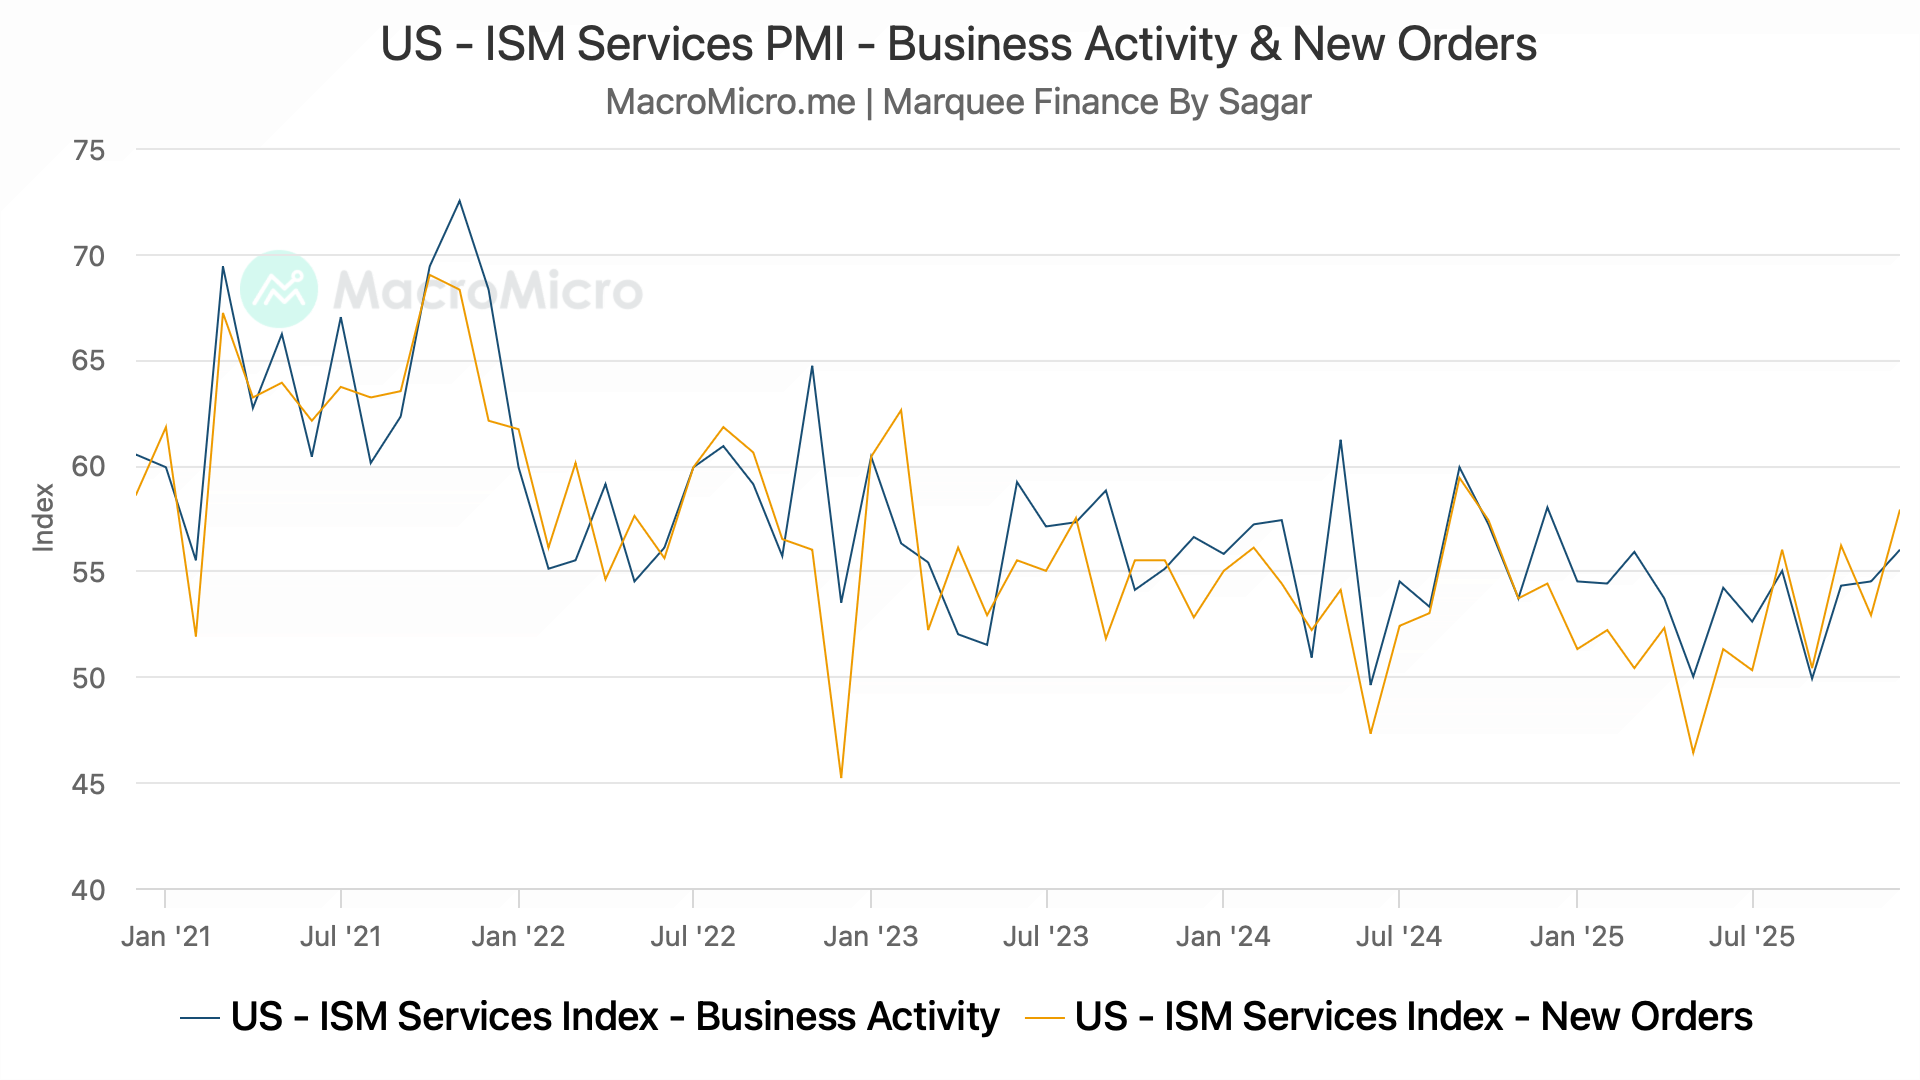
While the ISM Manufacturing was dismal, ISM Services surprised on the upside.
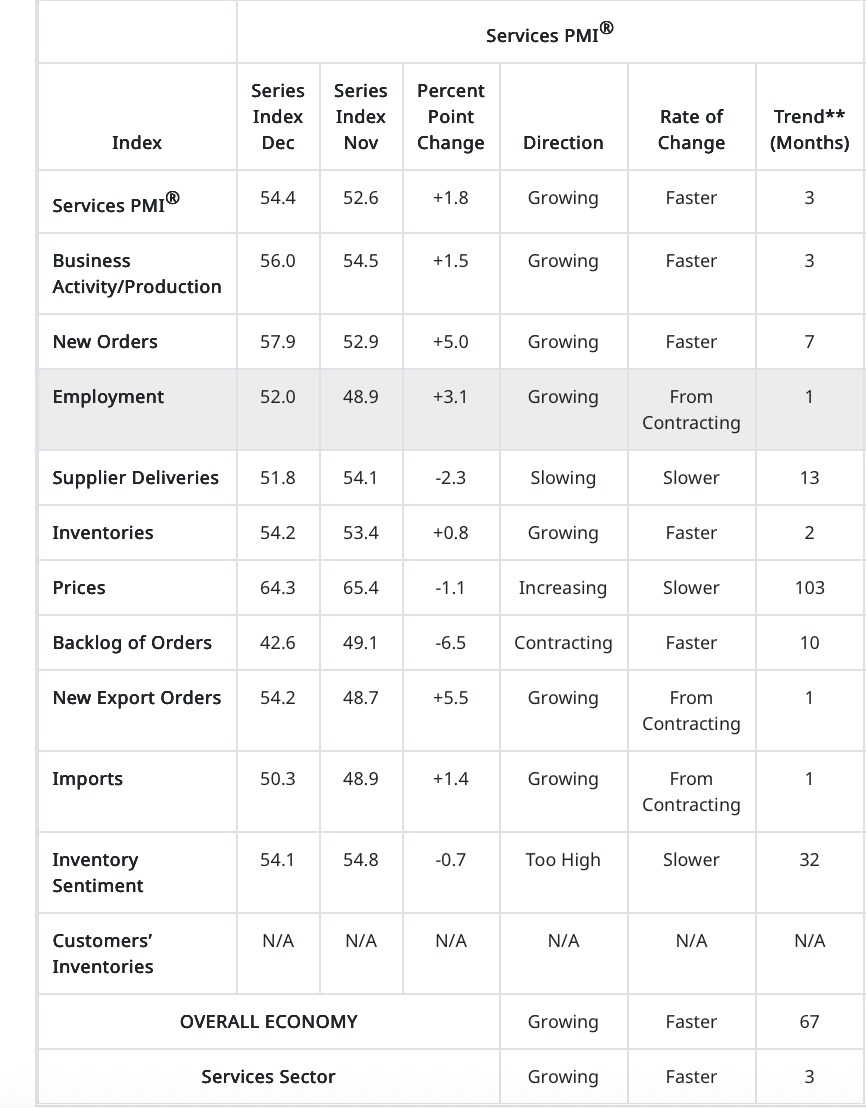
The enormous rise in New Orders surprised the street.
If the uptrend remains intact, expect consumption to witness a V-shaped recovery, which could bode well for earnings as well.
One of the data points we present monthly and track very closely is the ISM Services PMI Prices, as it has a tight correlation with the US CPI.
The trend here is down, and the Services Prices Paid have likely peaked, which is good news for the Fed.
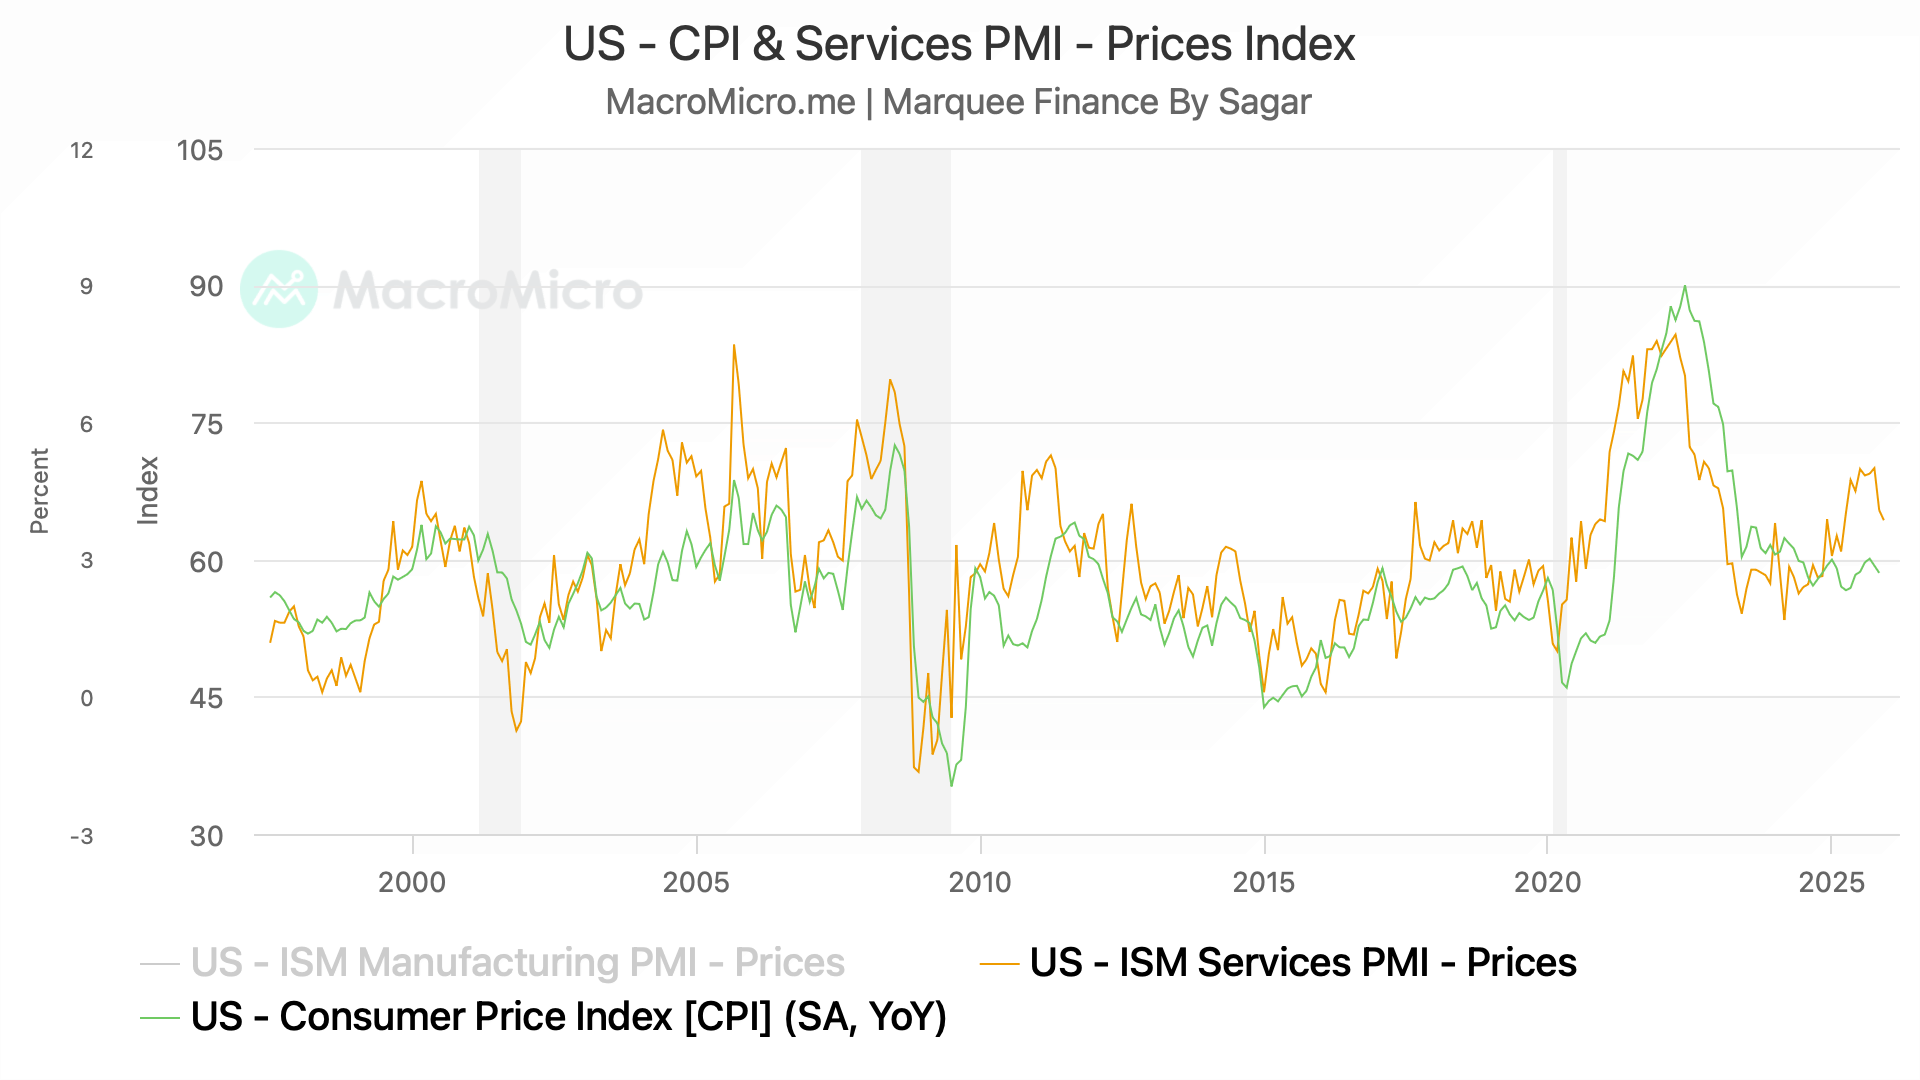
Nevertheless, the risk of higher commodity prices spilling over remains a headwind for lower inflation.
Let’s now jump to the labour market (10 charts):
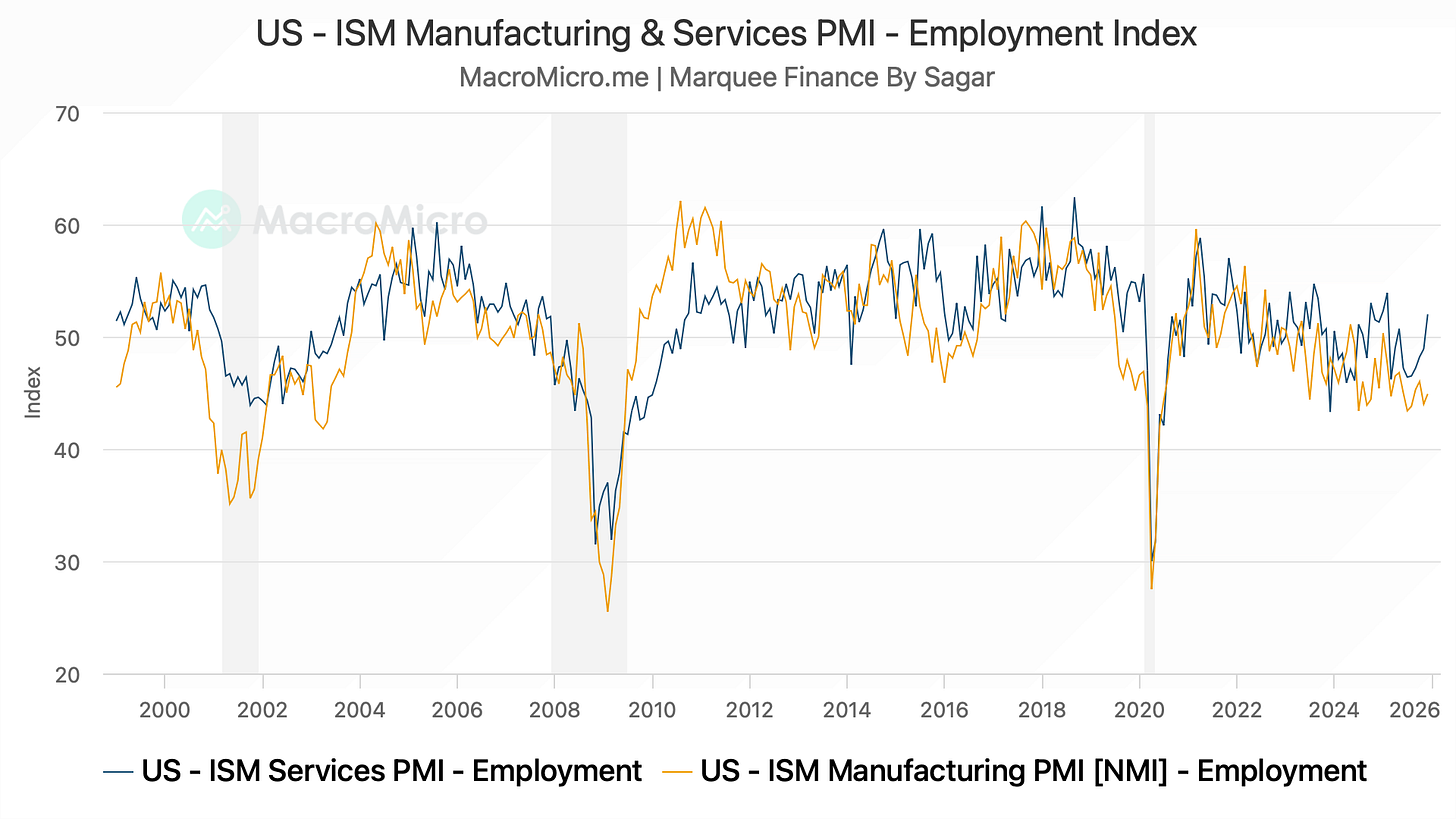
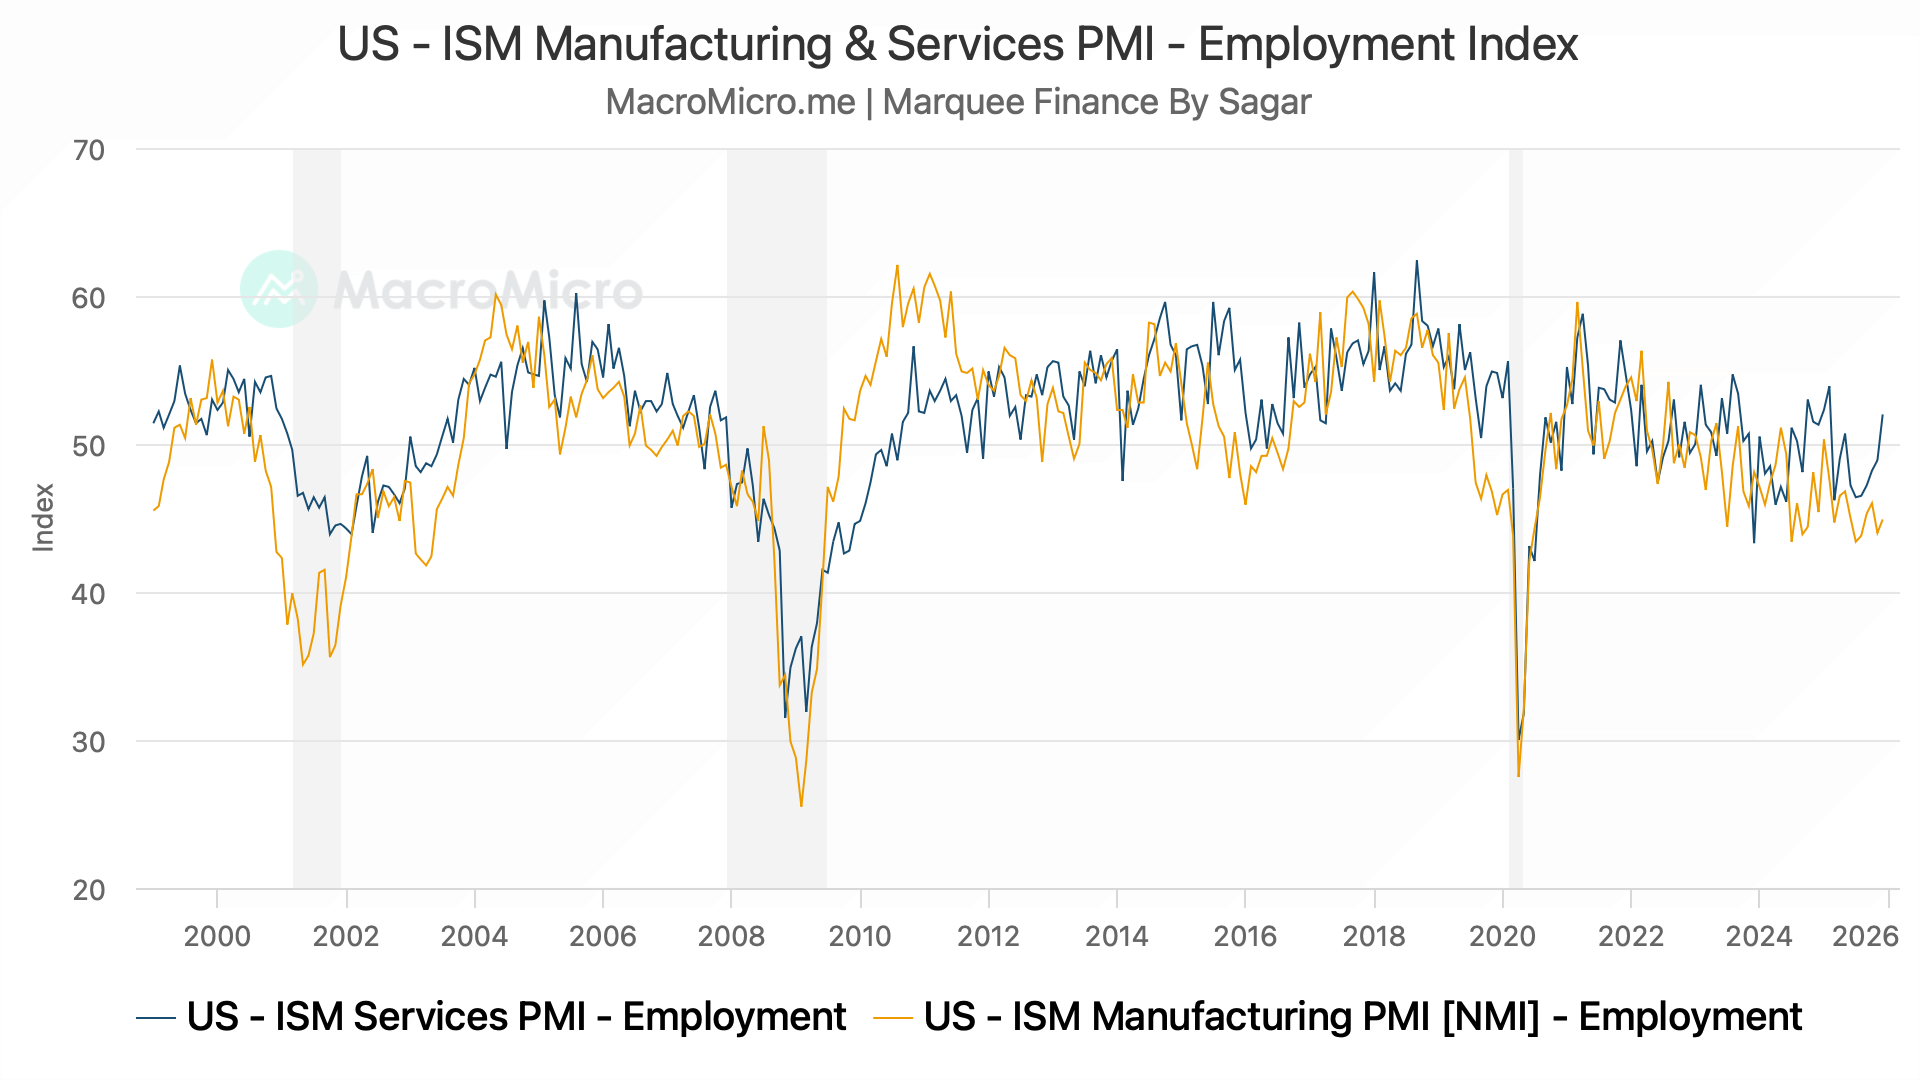
ISM Manufacturing and Services Employment Index: Services Employment rose sharply, indicating hiring in the services sector (however, as we will see later, it’s really shallow, limited to a few sectors). On the contrary, the Manufacturing Employment remains in a contraction zone and at the cycle lows.