

November was marked by an early “Santa” rally across all the major asset classes, excluding some commodities.
Let’s understand with charts the performance of asset classes and the global macro data with 16 intriguing charts.
Let’s go!
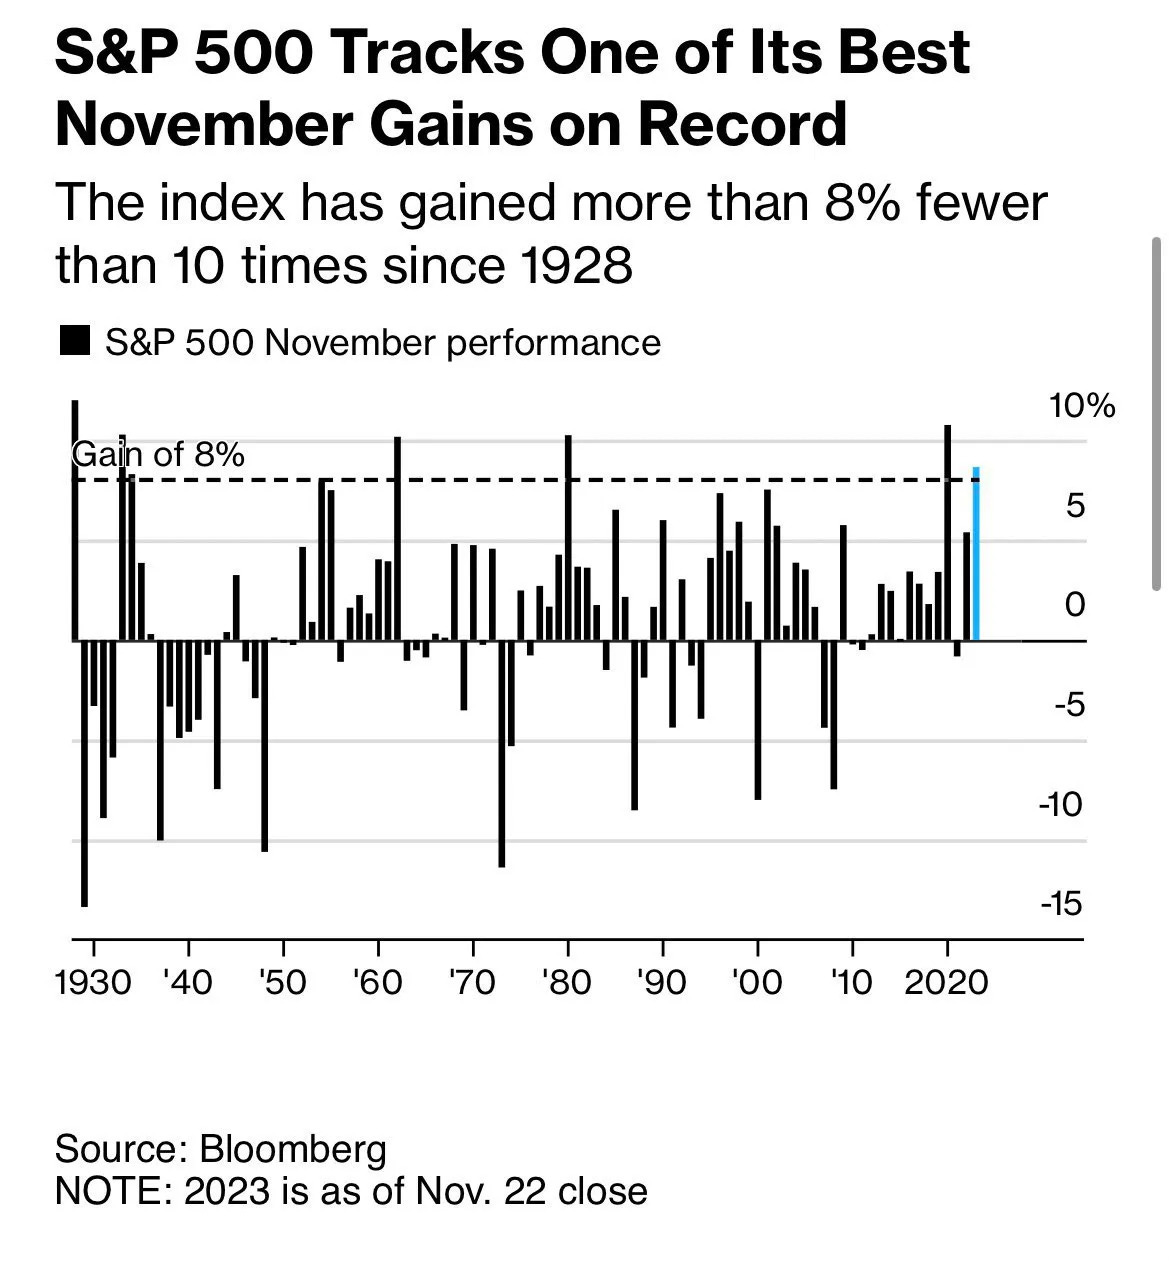
In a stealth rally which stole the show for November, S&P 500 witnessed an 8% gain, one of the best in the last 100 years.
No prizes for guessing who led the rally!

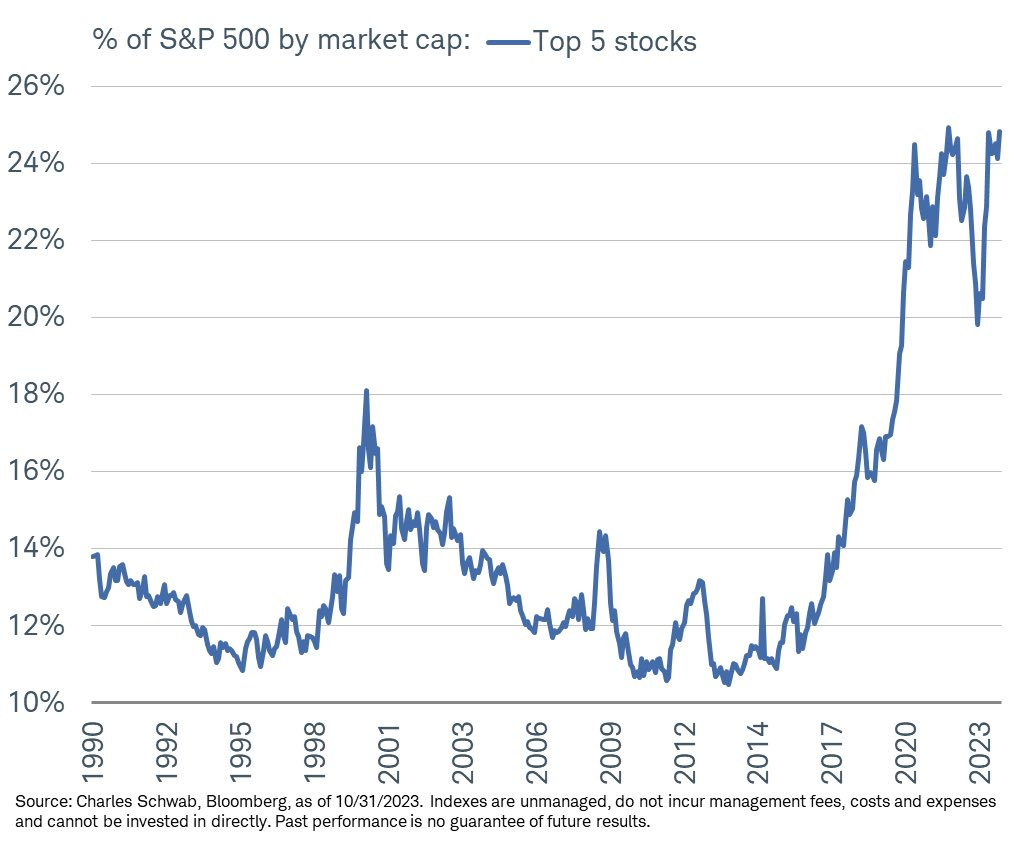
The Magnificent 7 saw a violent comeback led by AAPL and MSFT.
In fact, the top 5 stocks now account for roughly 25% of the weight back to its 2021 highs, which raises the concentration risk in the markets.

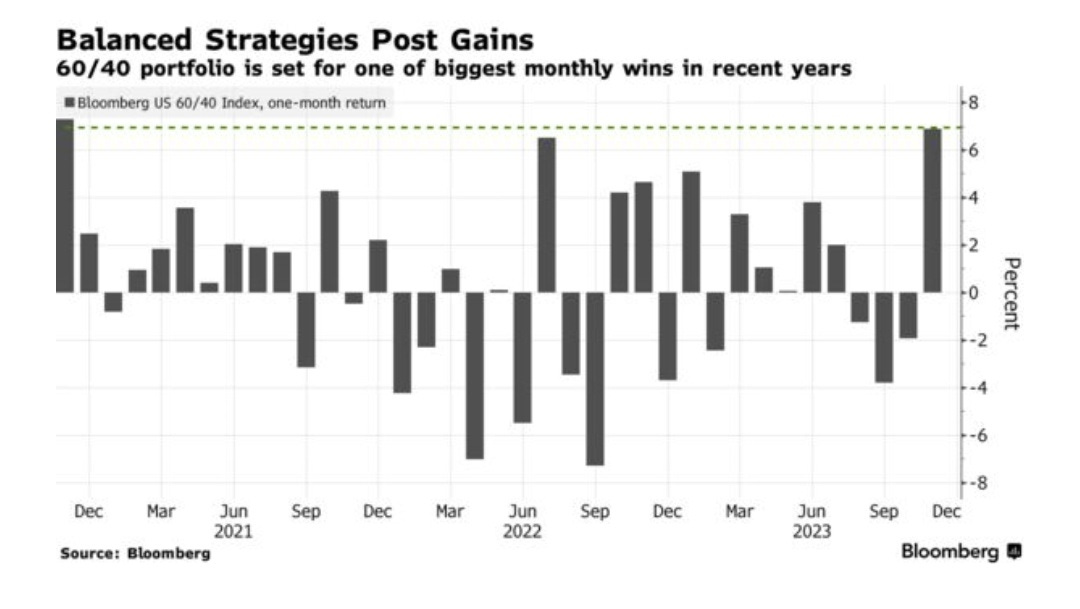
Source: Lizz Ann Sonders Not only stocks but even bonds saw a relief rally from the oversold levels.
Duration (TLT) saw a rise of more than 15% from its lows. As a result, the 60:40 portfolio posted one of the highest gains in months.
The “everything” rally has resulted from the hopes of a “soft landing” as the CPI has cooled significantly while the labour market remains above the historical trends of a recession.
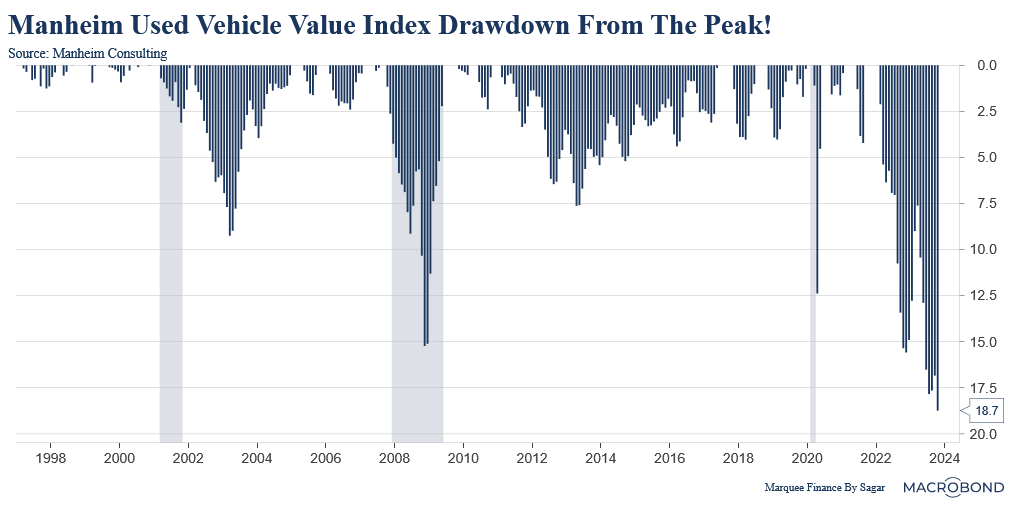
Nevertheless, the internals paint a grim picture as the most significant contributor to the goods disinflation has been the used vehicle index.
The Used Vehicle Index is now witnessing the biggest drawdown in the last two decades as the bubble post-COVID has finally burst. The DQ rates are indeed going up across auto loans.

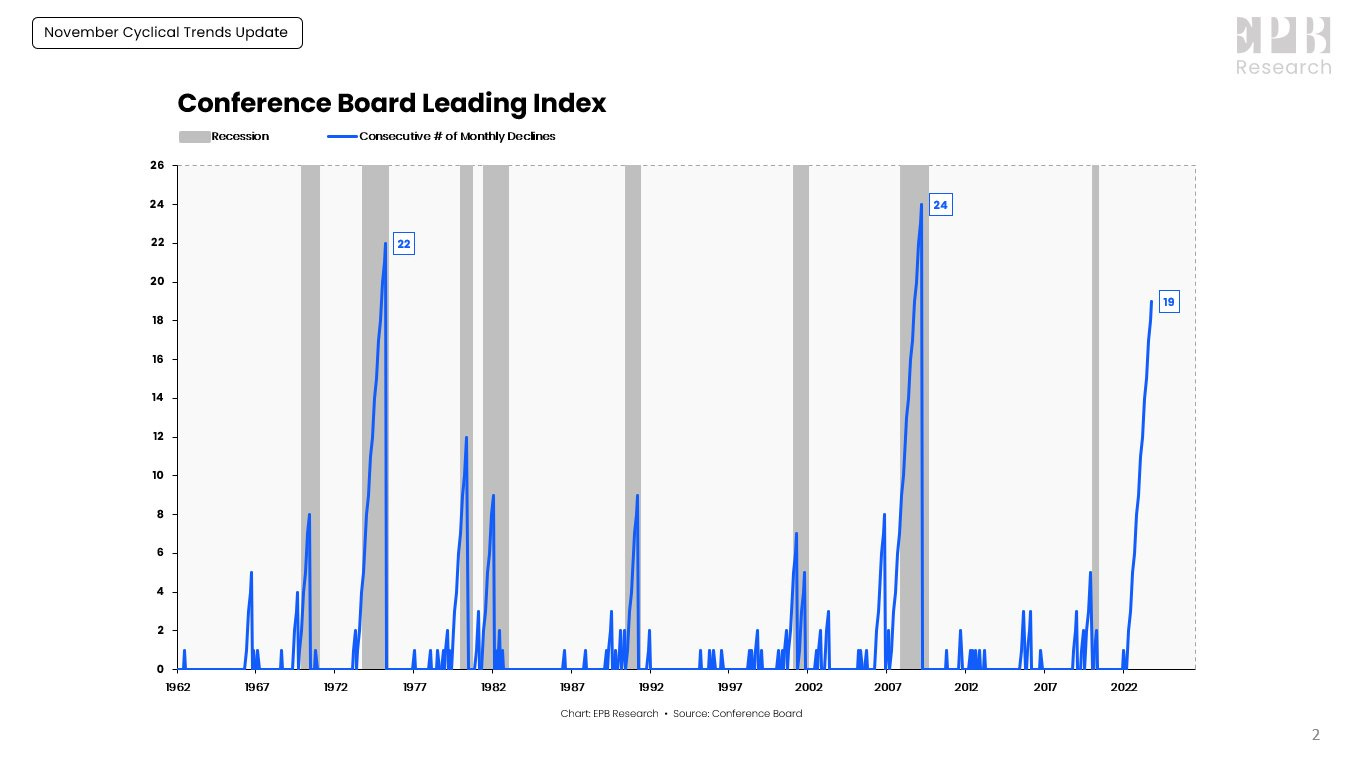
The Conference Board Leading Index is a confluence of various leading indicators with an impeccable track record of predicting a recession.
It has now been in contraction for a record 19 months and nearing the levels seen in the 2008 GFC and the 1970s.
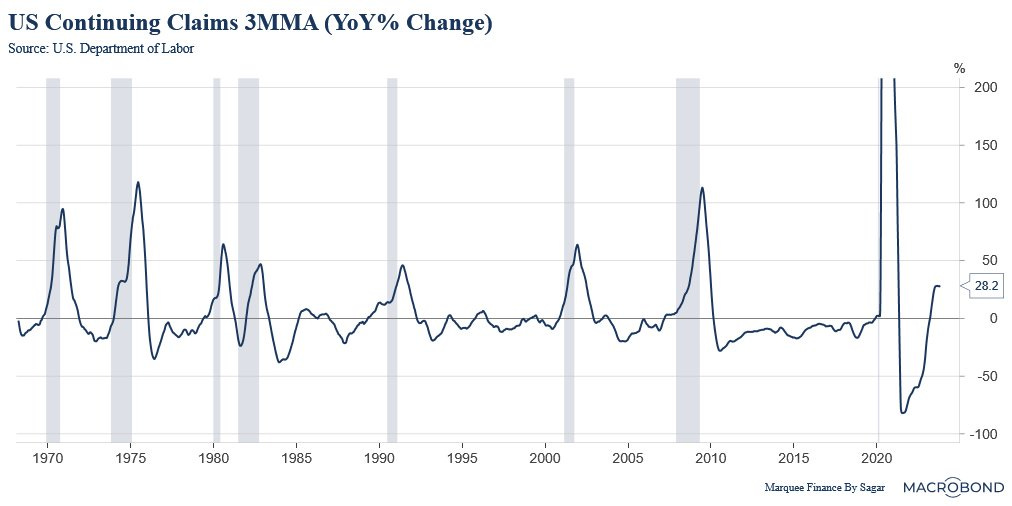
Source: EPB Research The labour market is the last to react in the sequence of events and is the most lagging indicator.
While it has been remarkably resilient throughout the year, we are now at the likely inflection point as the claims data can swiftly worsen as we end the year.

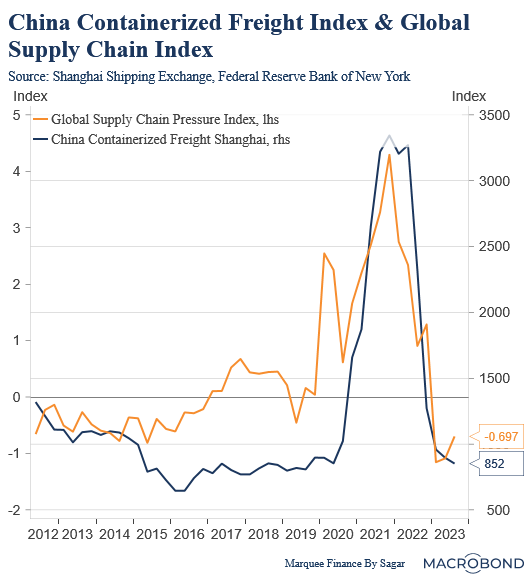
Goods disinflation has been a global trend led by the Chinese reopening (massive fall in the Shanghai Freight prices).
However, we are likely at the bottom for the prices, and any uptick from hereon will lead to a moderate price rise in the prices of goods.

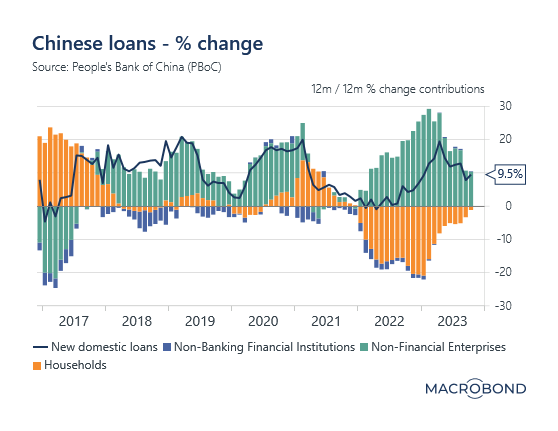
China has been in the news for all the wrong reasons this year after a prediction of a massive reopening in early January, which never arrived.
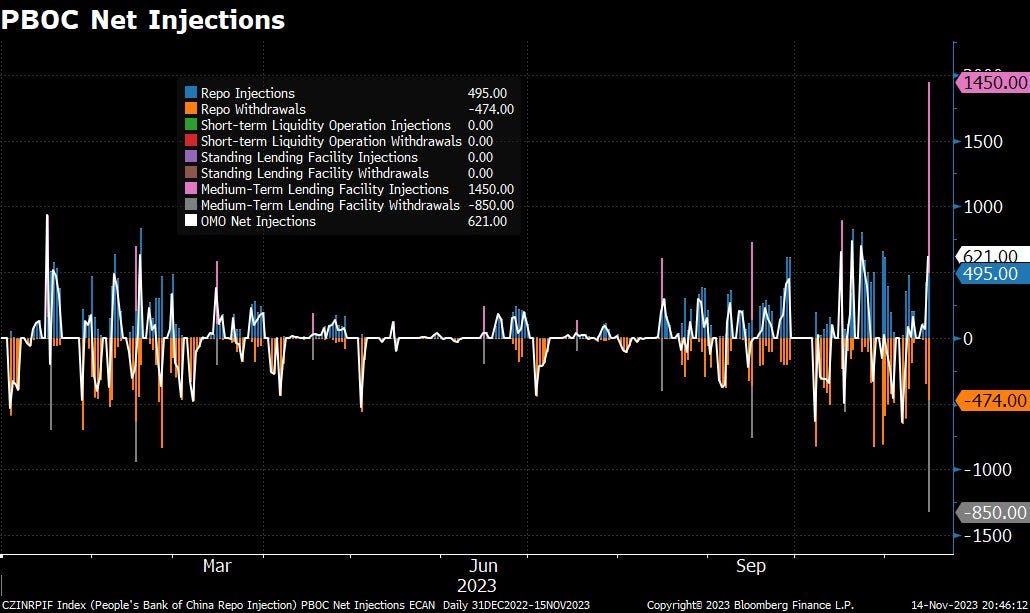
Nonetheless, lately, we have seen a revival in the credit demand led by the state governments which will likely use the money to spend on the key infrastructure projects.

The revival in the Chinese credit markets is led by the PBoC, which offered 1.45 trillion yuan ($200 billion) of cash through its medium-term lending facility in the third week of November.
Xi Jinping looks determined to turn around the Chinese economy, which is witnessing an epic deflationary trap akin to the Japanese economy in the 90s.
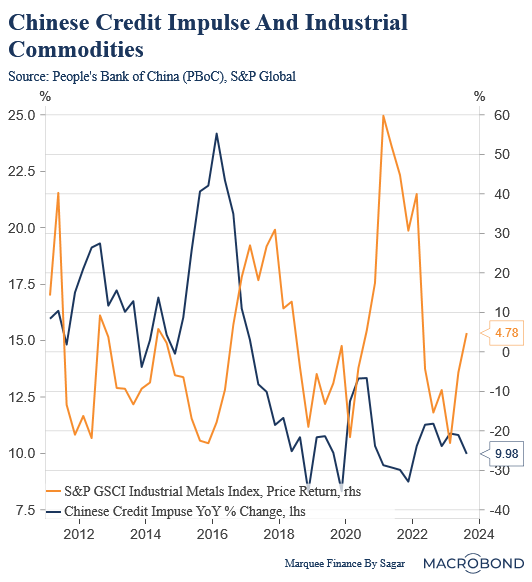
Source: BBG All the liquidity pumped by the Chinese Government and the PBoC will likely lead to an increase in my favourite metric, “credit impulse,” which has long been a proxy for industrial commodities.
It can be a little different this time due to the ailing property sector, but liquidity is liquidity and will surely end somewhere (my bet is on the Chinese stocks).

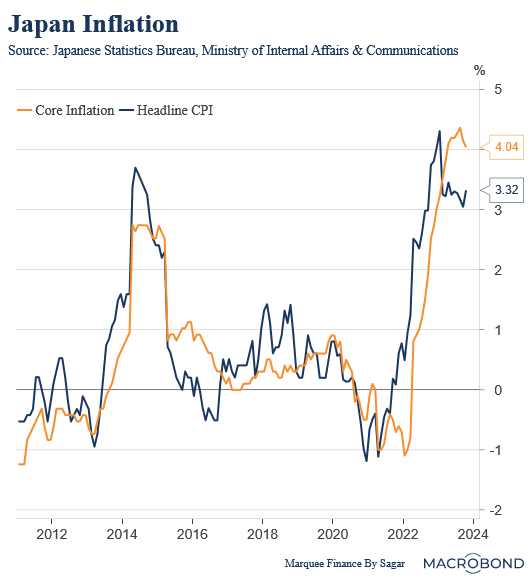
The land of the rising sun has been in the news lately as it’s the only country which is witnessing an acceleration in prices due to imported inflation (depreciating currency: JPY).
Furthermore, the price rise is insulated by enormous government subsidies on fuel and electricity. It is a matter of time before the “contrarian” Central Bank (BoJ) raises interest rates to cool down inflation.

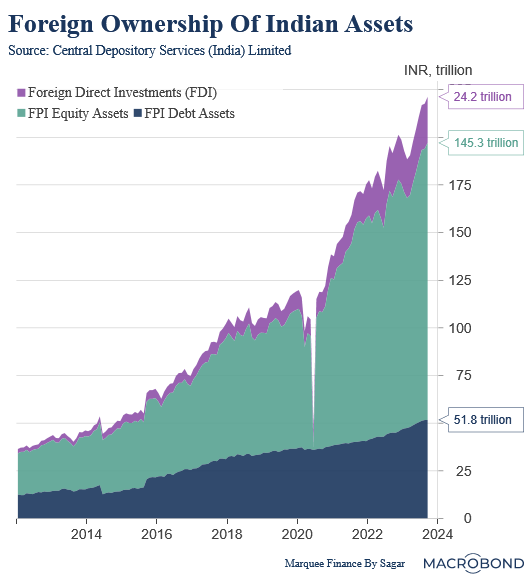
While India enjoys a dream bull run in equities, the long-neglected Indian bonds will see some crazy inflows in the next two years.
Major EM Bond indices announced the inclusion of India G-Secs which will take part in phases resulting in billions of dollars of inflows into the country.

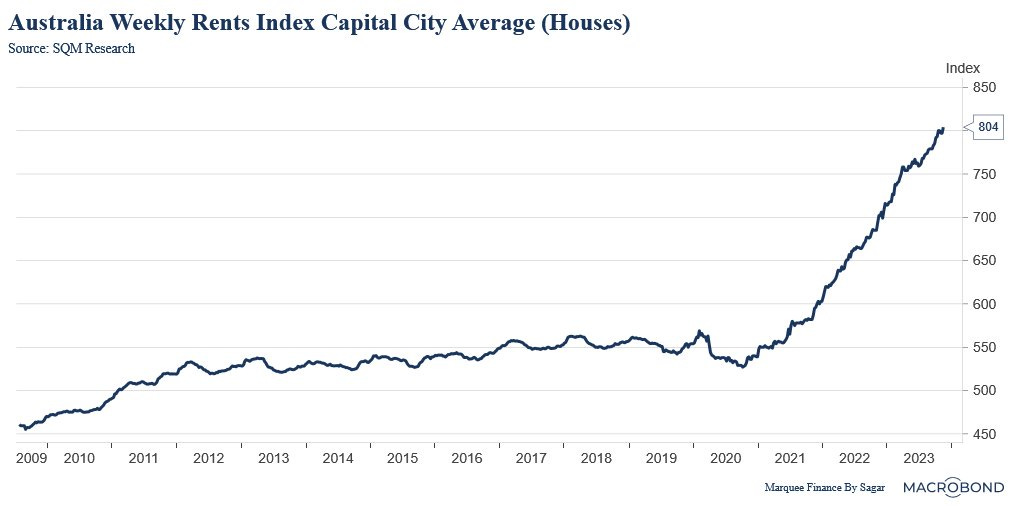
The US and Europe caught the attention of the traditional media about the runaway inflation in the last two years, but the country down under also saw some insane price rise.
The Weekly Rents across Australia doubled in the last three years, a significant gain compared to the post-GFC period, where the rents didn’t move for a long 10 years.
A big hit to the real incomes of Aussies.

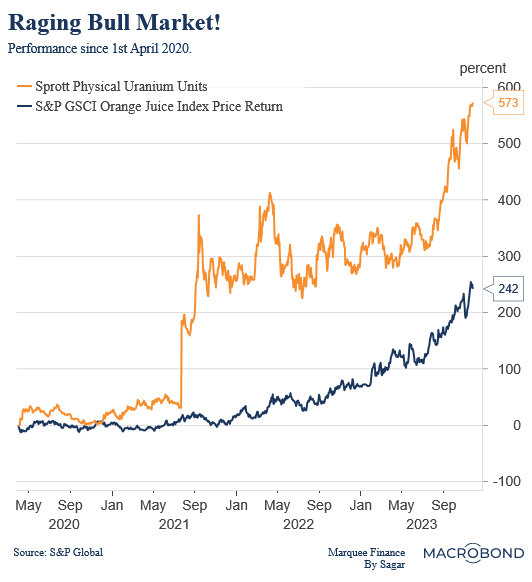
The biggest bull market post-COVID has been in Uranium and Orange Juice.
While “thinly” traded orange juice has seen an enormous rally due to supply-side concerns, the revival of the nuclear industry and underinvestment in Uranium mines has led to a gigantic bull run in Uranium.

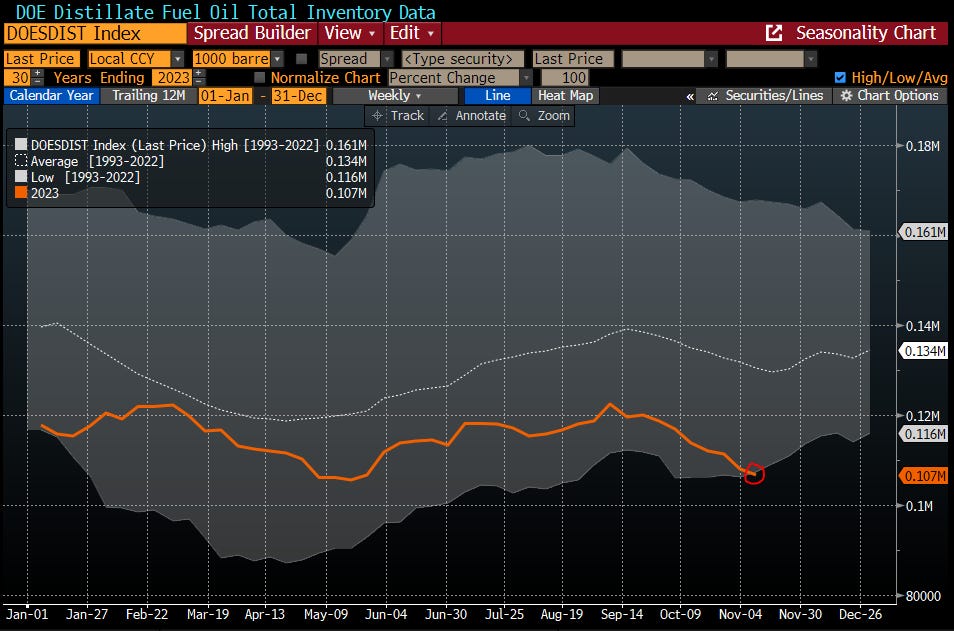
As geopolitical risks recede and OPEC+ debates about further supply cuts, crude oil retreated from its highs, but the inventories portray an alarming picture.
US stocks of distillate fuel (diesel and heating oil) are ending the fall season at their lowest “seasonal” level in data since 1982.
Weather gods can lead to a crude rally. Do watch out this space closely.

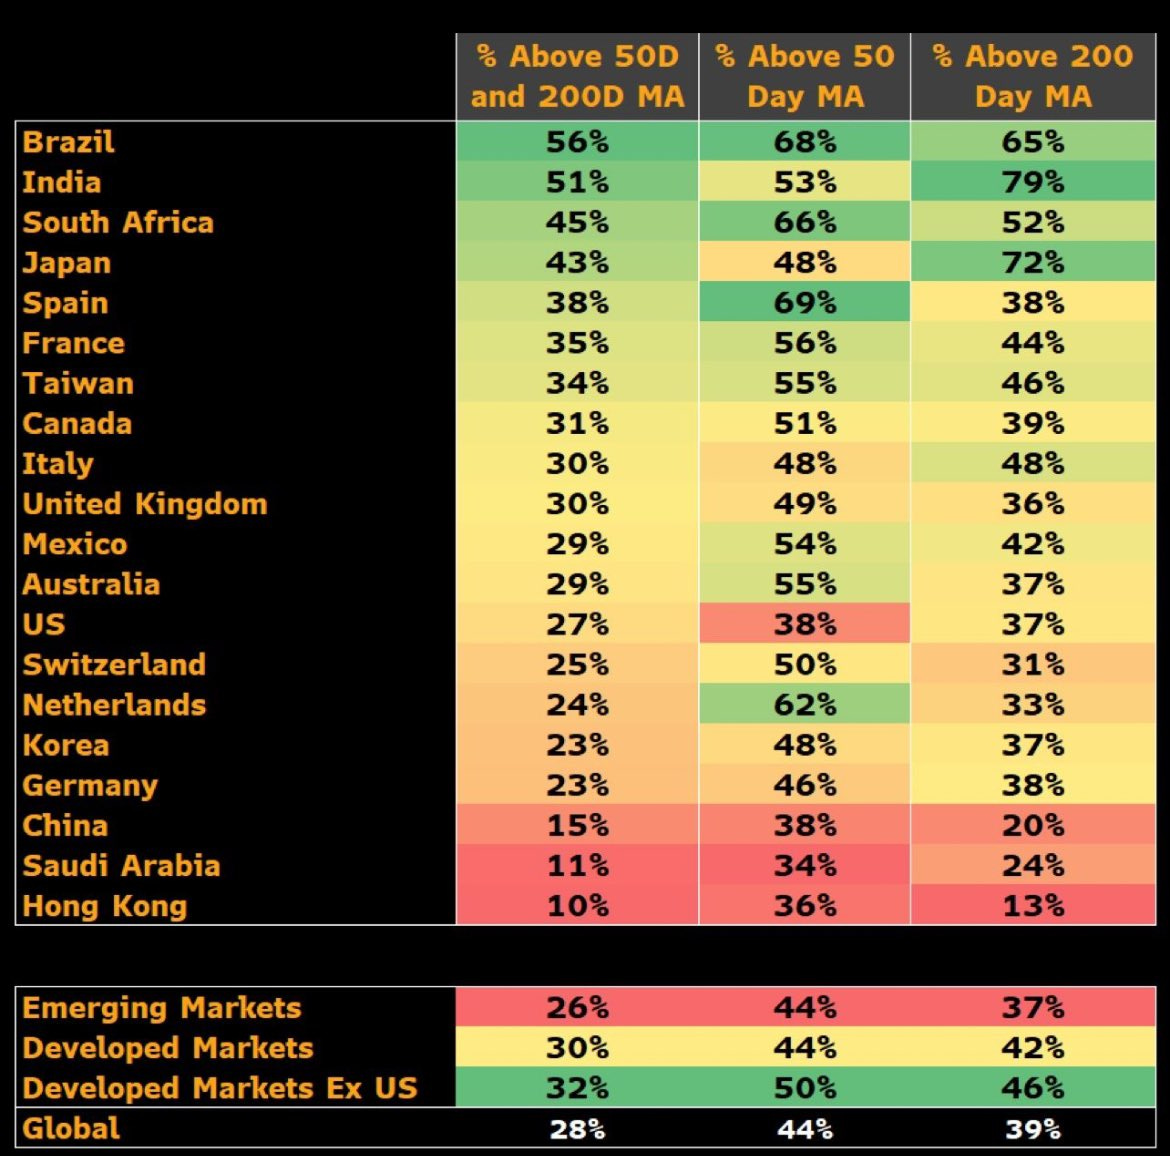
Source: BBG The “strongest” equity markets (technicals) are not in the concentrated US Tech heavy NDX but in Brazil, South Africa and India.
Currency may play spoilsport if you are a dollar investor while local investors rejoice the bull run.
Source: BBG


Do share with your friends to get the rewards!
Disclaimer
This publication and its author is not a licensed investment professional. The author & any other individuals associated with this newsletter are NOT registered as Securities broker-dealers or financial investment advisors either with the U.S. Securities and Exchange Commission, Commodity Futures Trading Commission, or any other securities/regulatory authority. Nothing produced under Marquee Finance by Sagar should be construed as investment advice. Do your own research and contact your certified financial planner or other dedicated professional before making investment decisions. Investments carry risk and may lose value; Marquee Finance By Sagar LLC, Marqueefinancebysagar.substack.com or Sagar Singh Setia is not responsible for loss of value; all investment decisions you make are yours alone.s
Excellent summary of the current global economy highlighting the key pinch points!
BTW, the LEI is having a lot of trouble predicting anything since the pandemic. While it has tons of historical data, it has not "experienced" a global pandemic, large govt stimuli that followed and the see-saw recovery path of the economy. I hope they revise the methodology to make it more useful.
Point no 5 , more details please