

“When the tide goes out, you find who is swimming naked”.- Warren Buffett.
On 3rd October, we wrote “Explosive Setup 5.0”; we gave the following cross-asset targets:
SPX: 6700
QQQ: $600
SMH: $400
Gold: $3500
Silver: $45
Dollar: 104/106
EURUSD: 1.095
Most of our targets were met this week.
Nonetheless, we always say price action is king, and today we will review the way forward in detail.
You don’t need to be a genius to understand why equity markets have moved over the past few days.
Interestingly, the NDX had the 11th-worst week ever, and the SOX had the 4th-worst week ever.
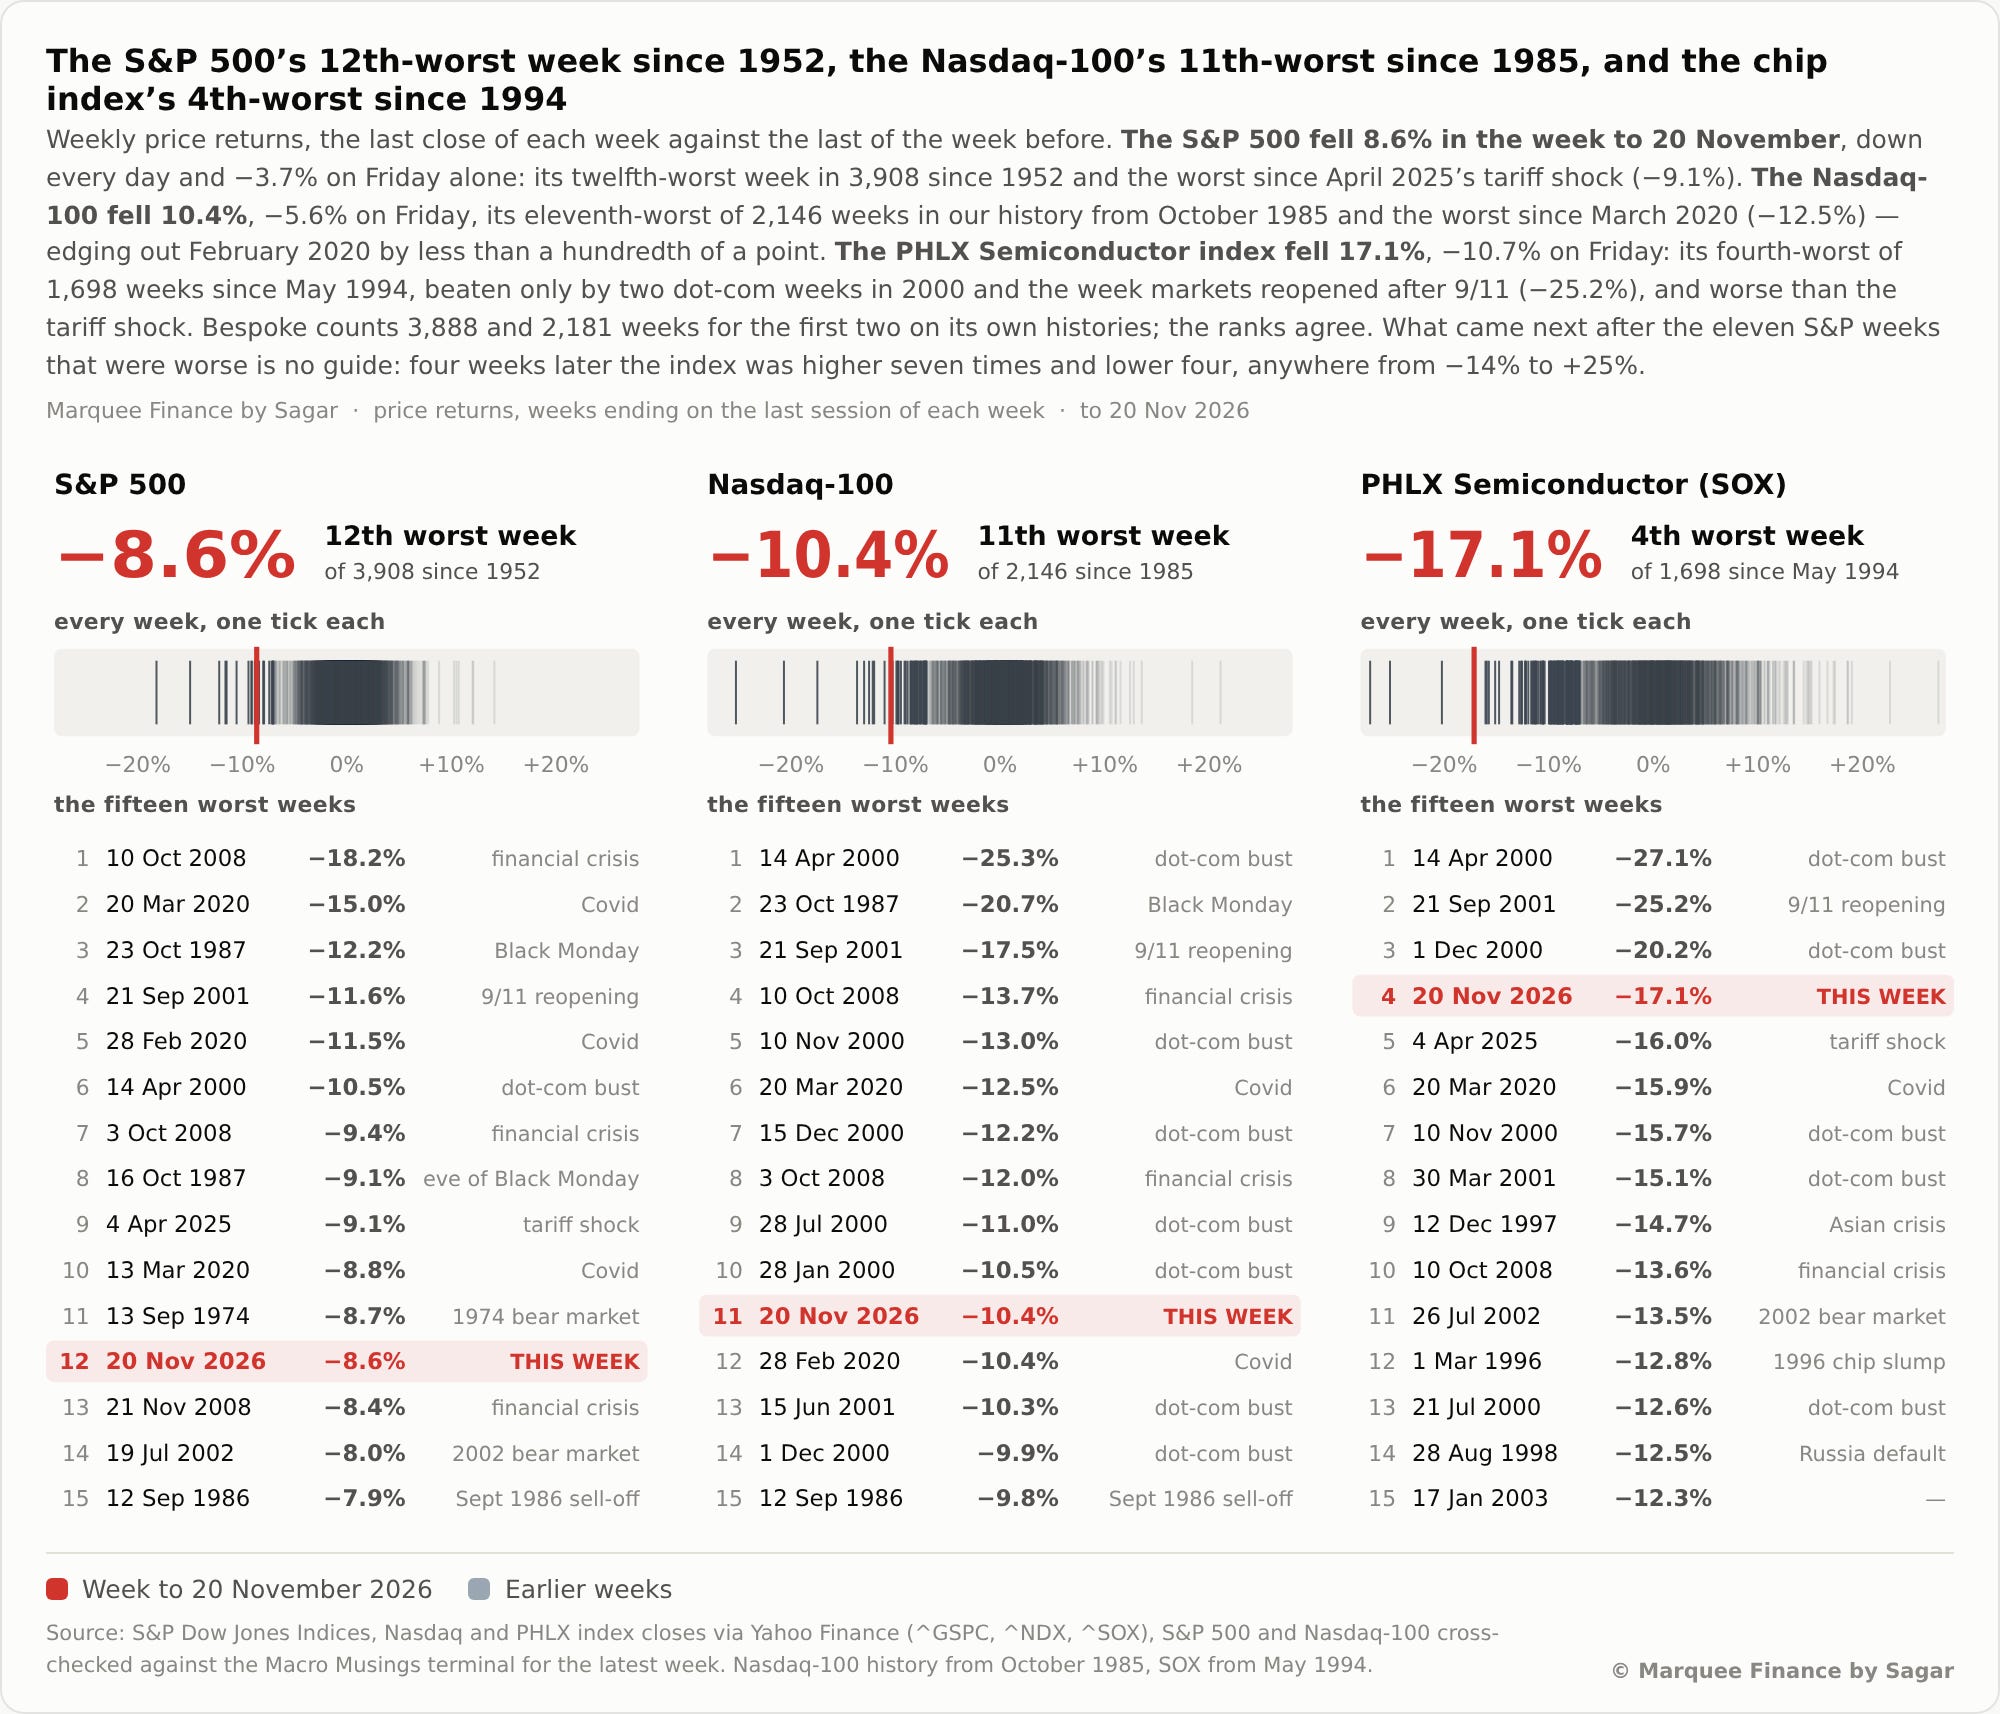
Notably, ex-9/11, SOX have seen similar moves only during the dot-com bust, while NDX saw such moves only during 2008 and the dot-com bust (ex- Black Monday and 9/11).
For obvious reasons, this isn't a normal drawdown, and we don't think it’s a 2008 either, but the moves (and charts) are extremely similar to 2000.
It’s mind-boggling that the NVDA, which was the world’s largest company by market cap a few weeks ago, has seen the following in the last few days:
Founder resigning after a string of affairs.
The company announcing that it will take “weeks” to file a 10-Q.
DOJ announcing an investigation into the company.
SEC announcing an investigation into the company for alleged “accounting” issues.
Last week, some of the readers were annoyed when we wrote: “The Emperor Has No Clothes”, and here we are today.
Those who have been in markets for a long time know that, as an investor/trader, you have to be pragmatic and never marry your position/stock.
The BTD crowd, for the last 4 years, will get a rude shock of their life when the “retail” favourites never reach ATHs again, as has happened multiple times in the past with bubbles.
Yes, stocks always do go to ATHs, but it’s always the index, stupid!
Moving on, VIX saw a 5.4 SD move and its 5th-largest weekly rise “EVER”.
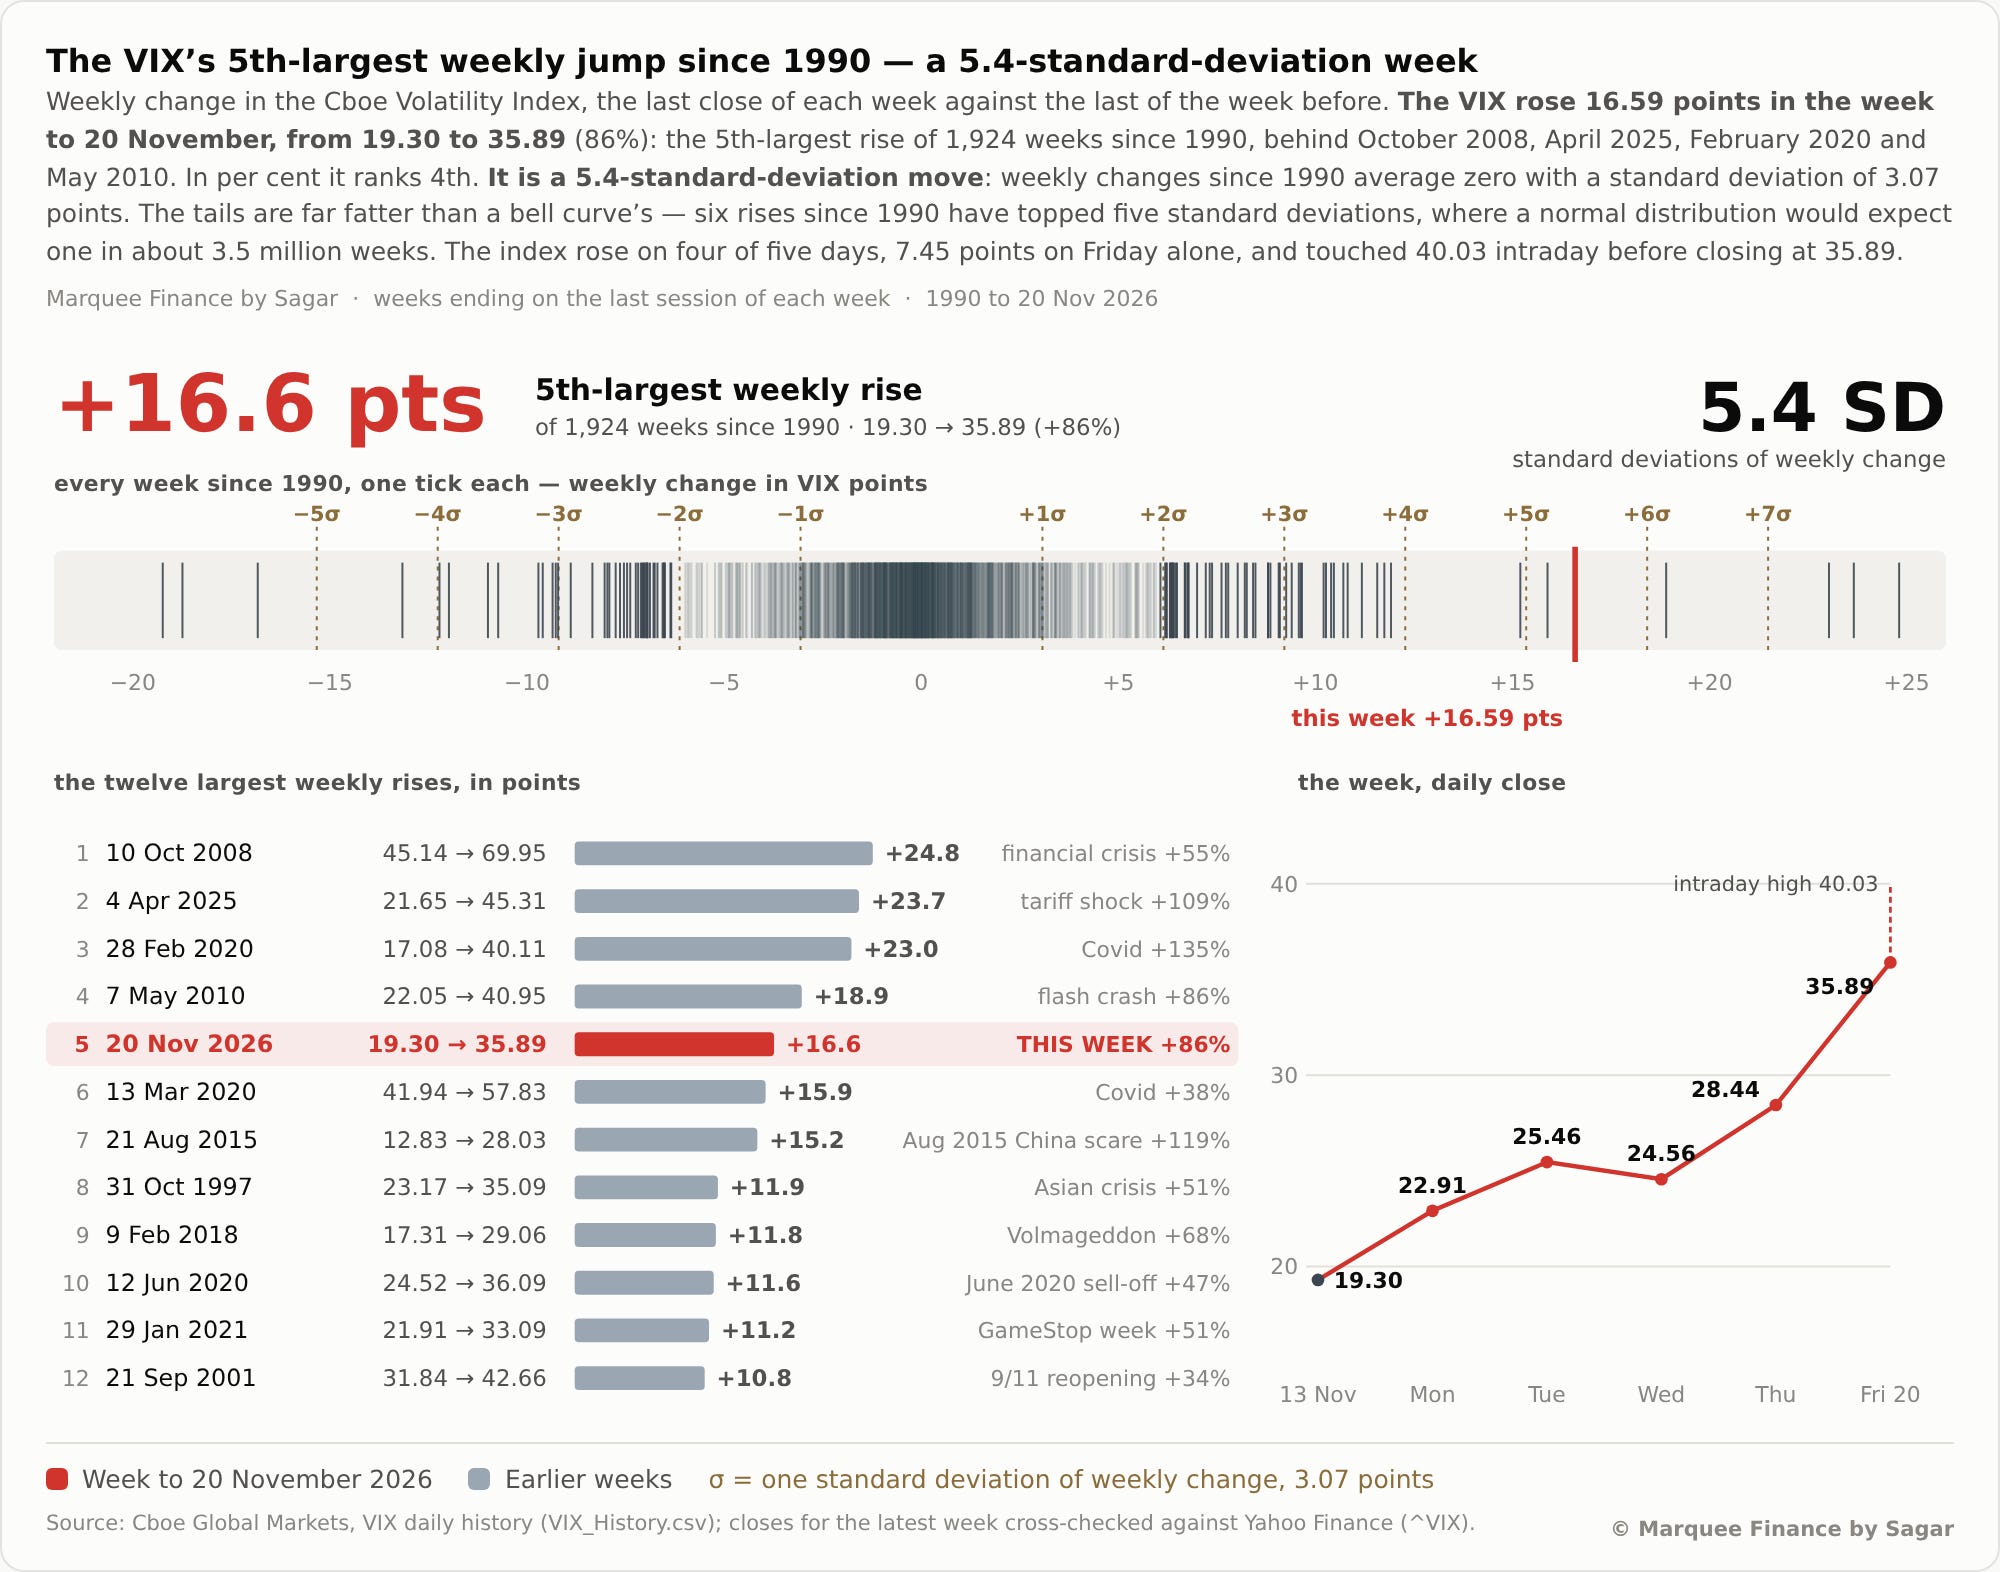
An 86% rise in VIX indicates the magnitude of the move.
Furthermore, the carnage in momentum has been unprecedented.
The top 3 worst months ever for MTUM against SPX since 2013 have been this year.
Yes, it’s truly baffling even to write this!
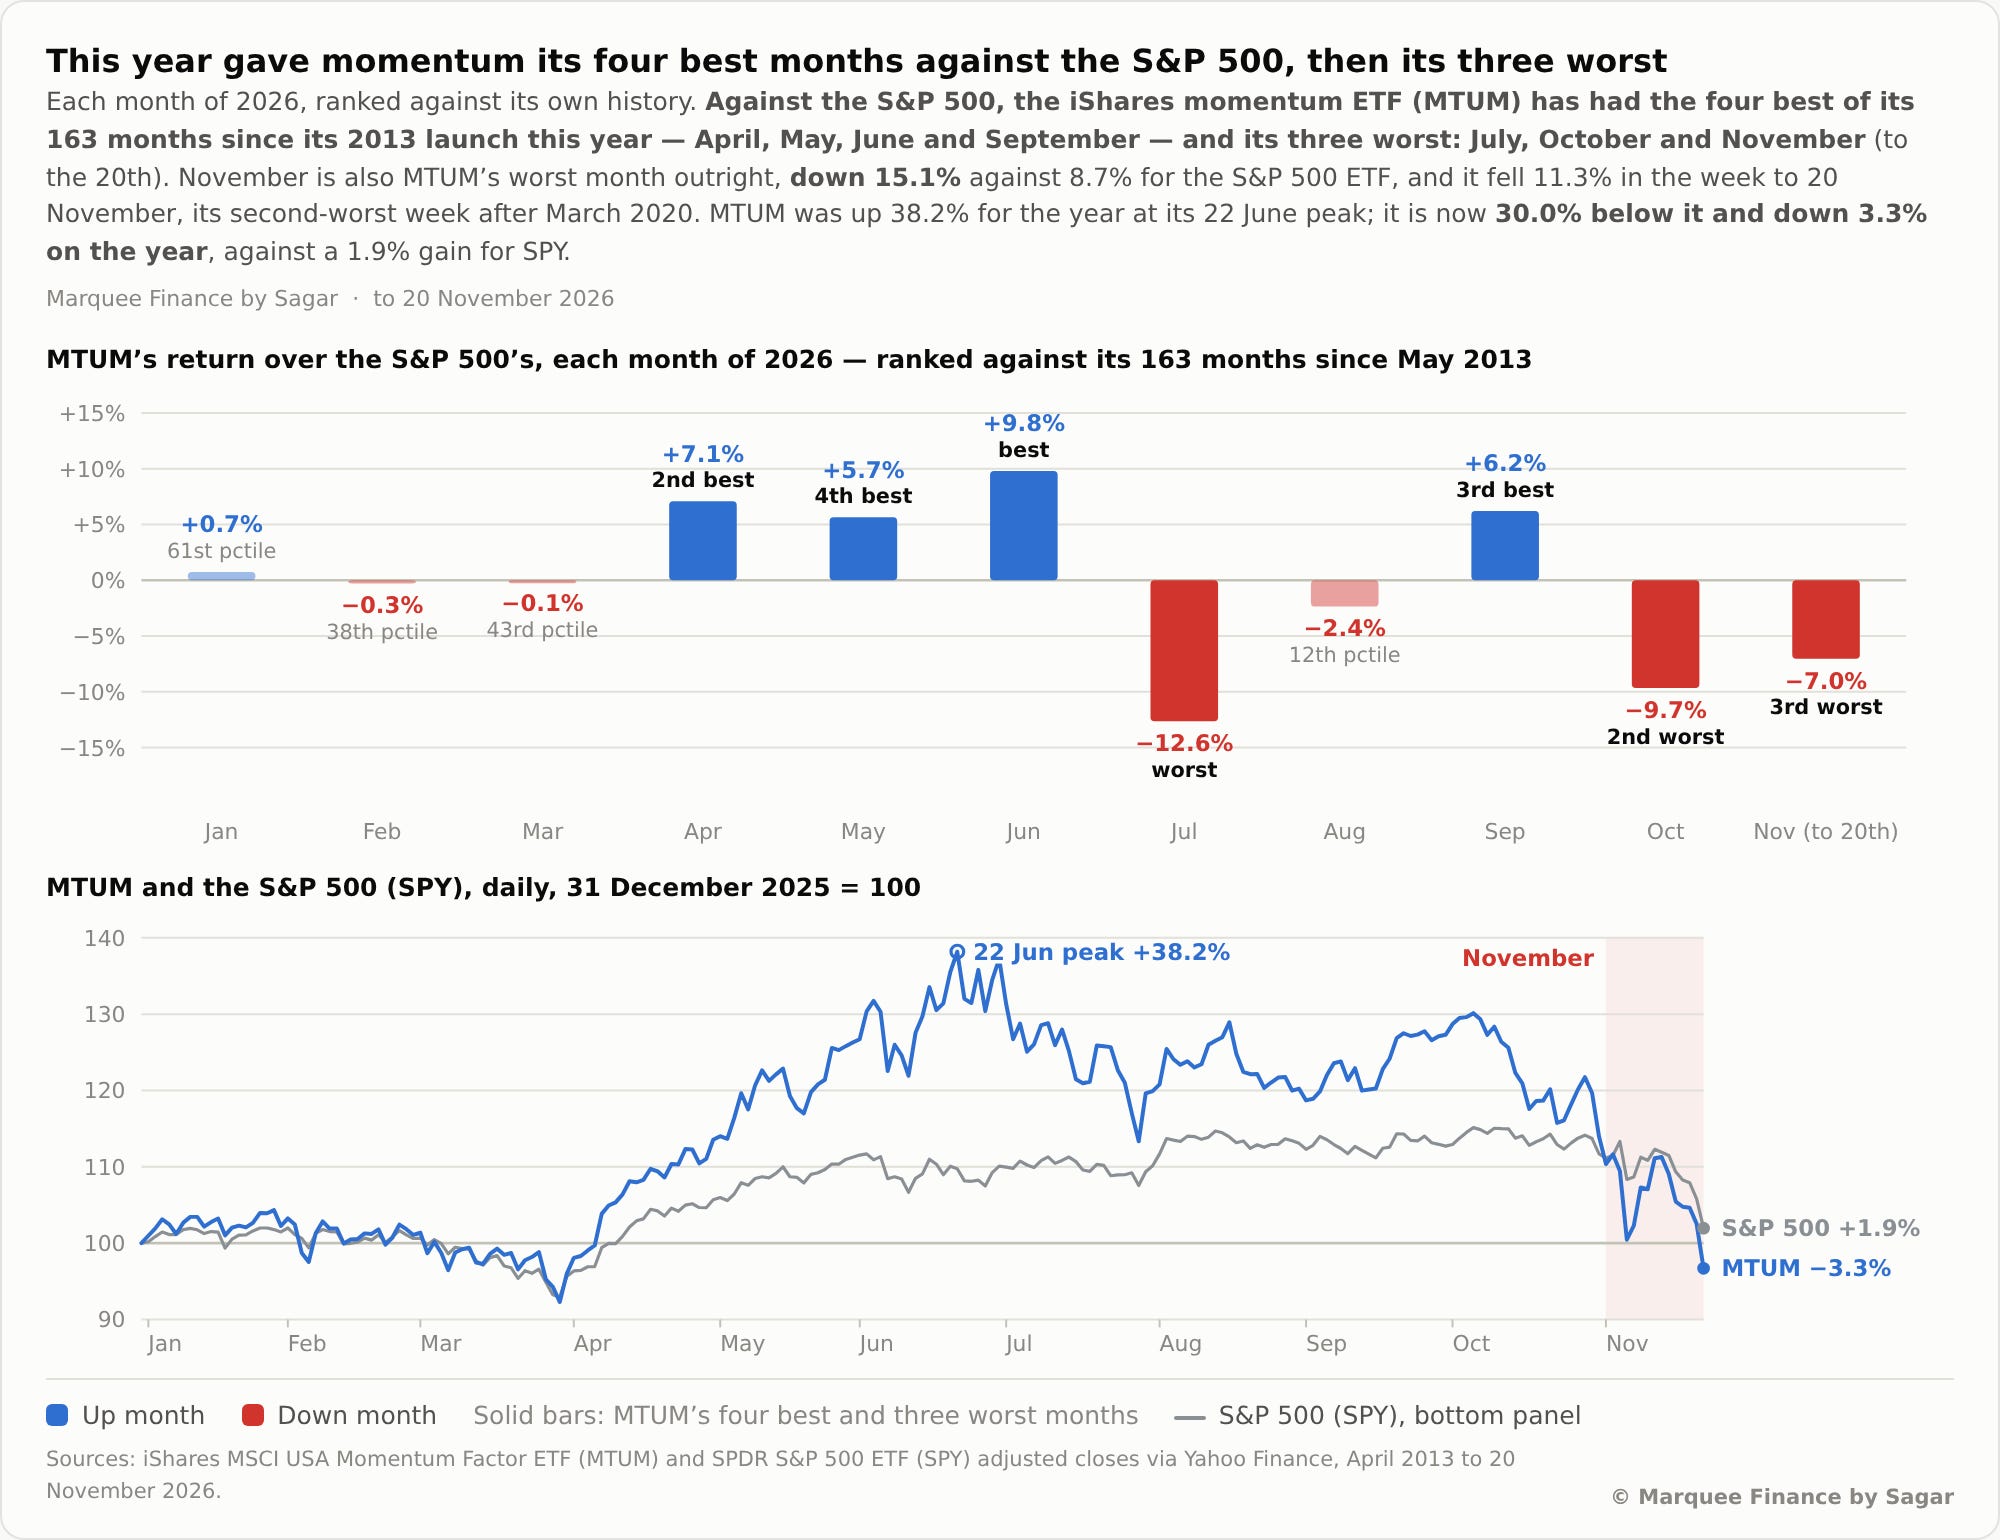
From a 38% outperformance, MTUM is now underperforming by 5%, which is mind-boggling and helps explain the pain in the hedge fund universe.
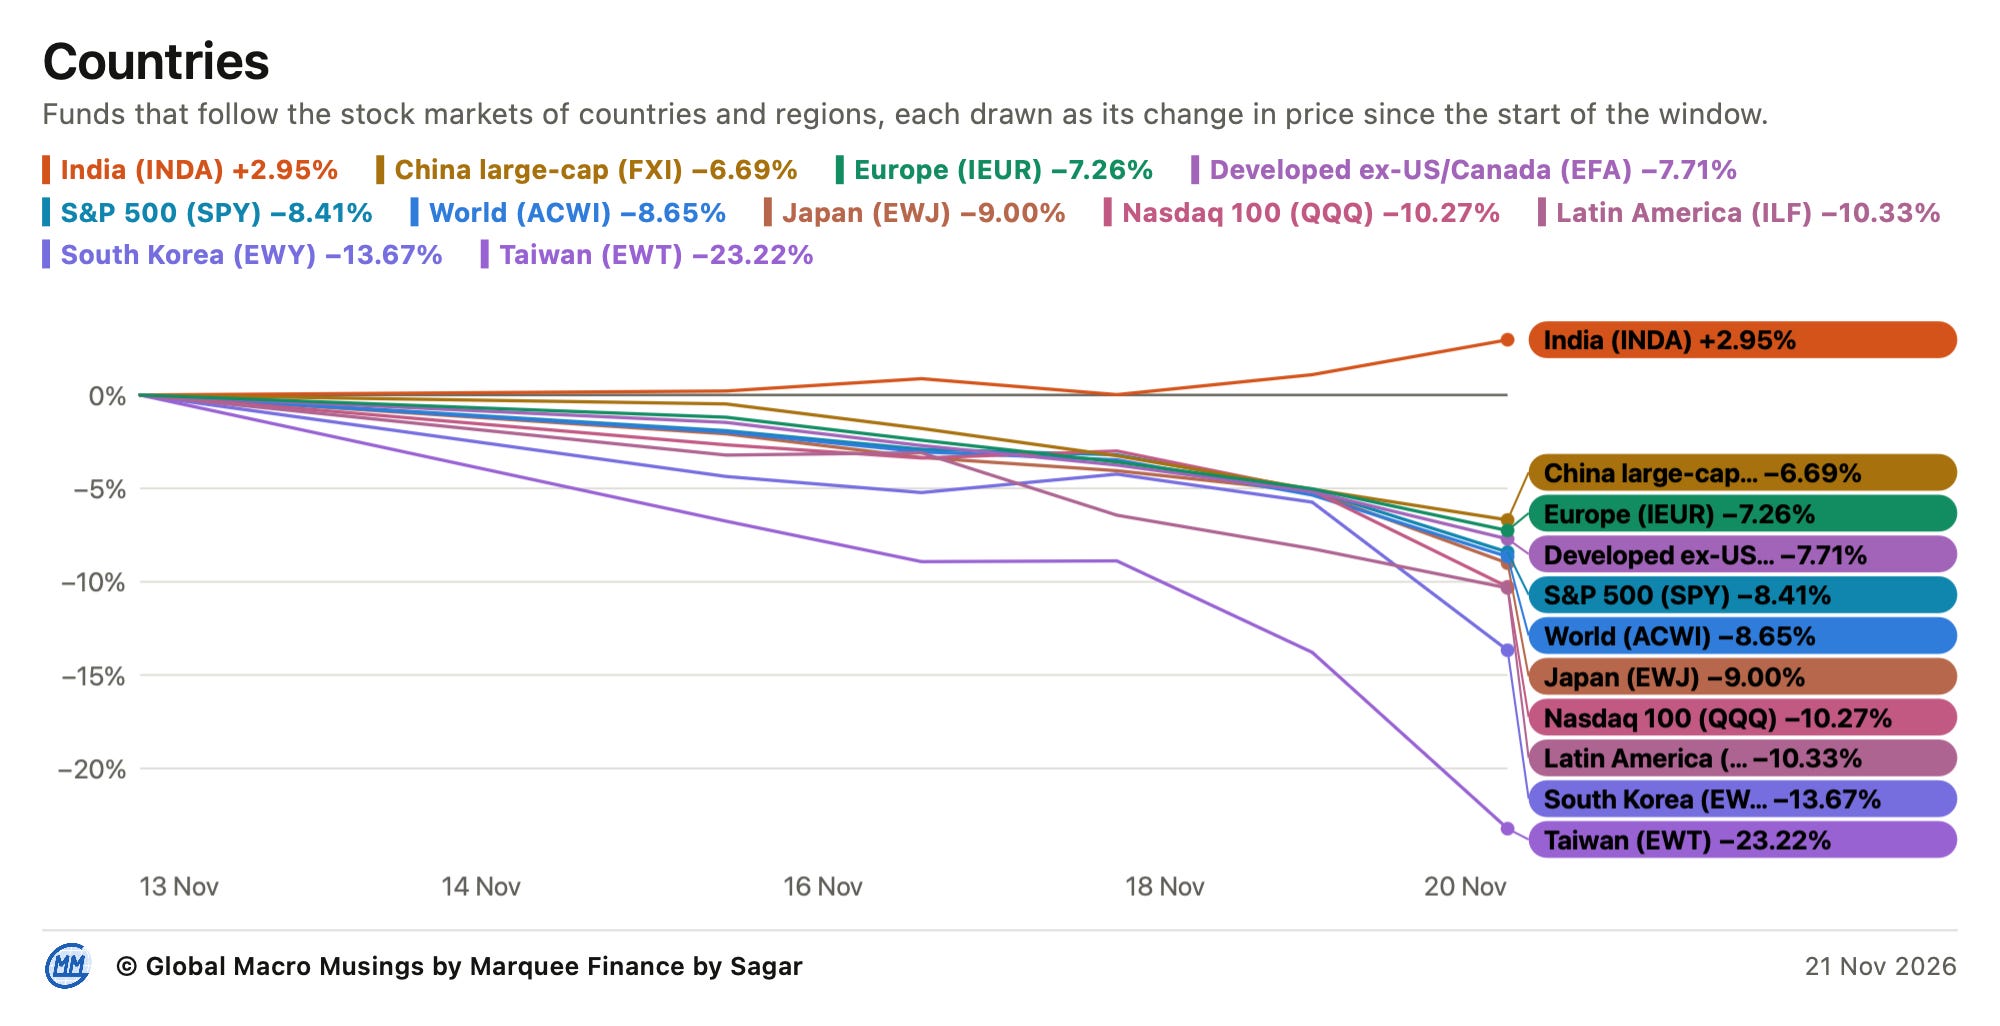
Nonetheless, the one market where we were massively long and that has bucked the trend in the past week has been India, which has been inundated with foreign money, as they have been buying Indian equities worth $1.5 billion every day since the beginning of the month.
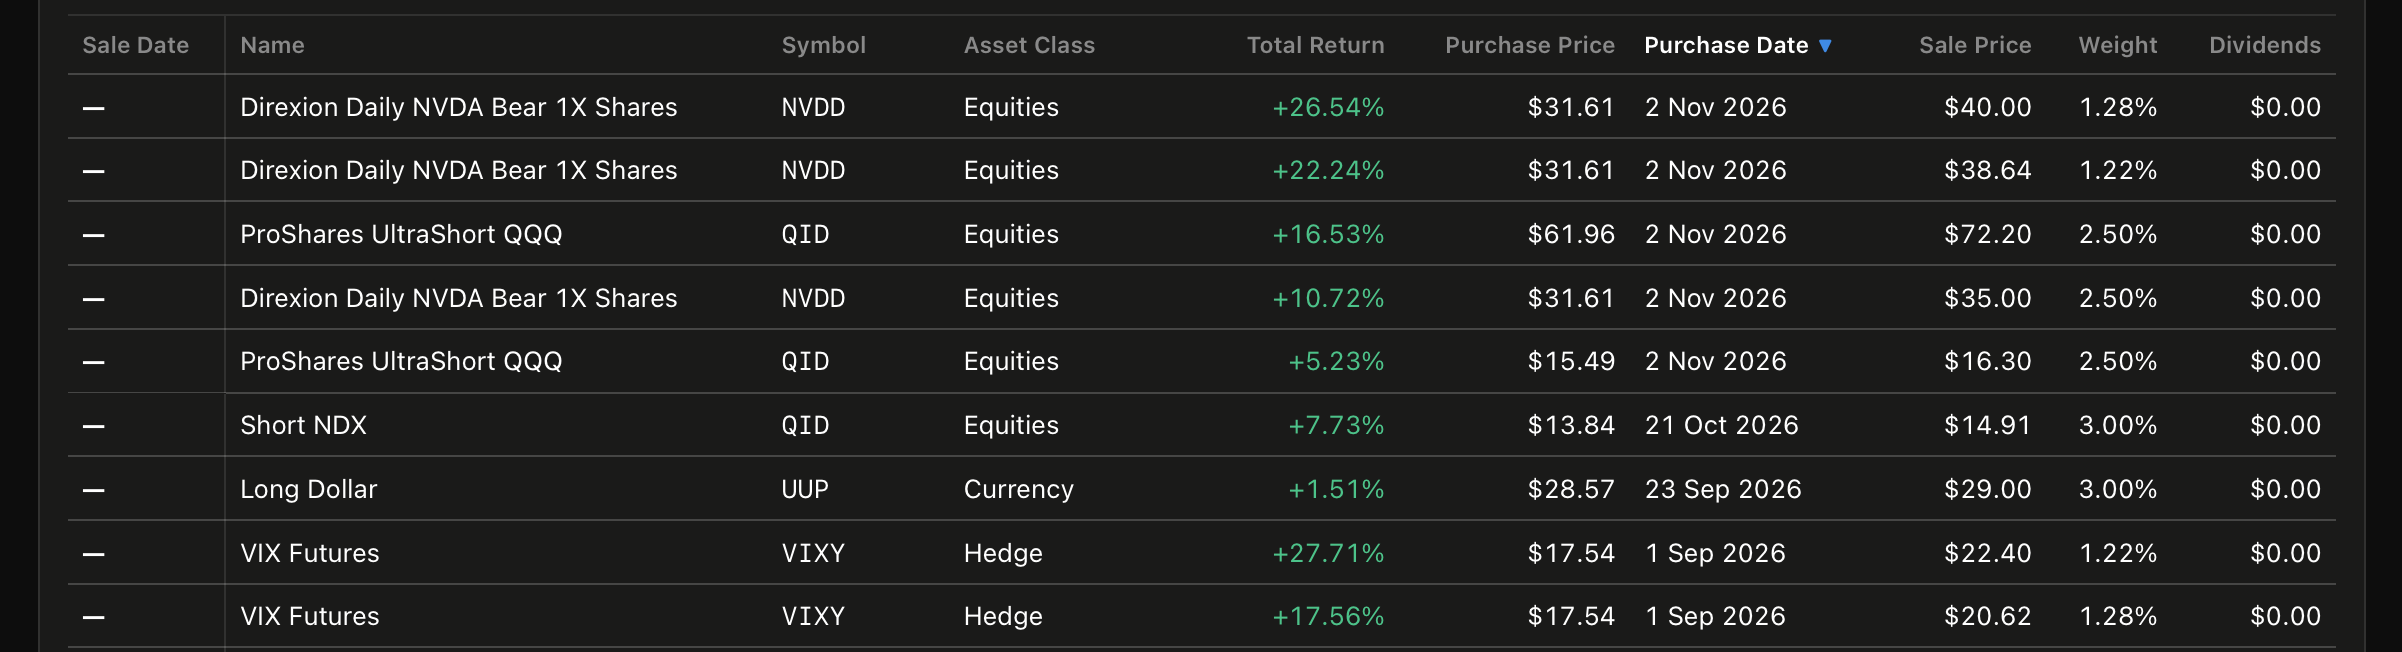
Our short positions (we have been continuously short QQQ since 21st October and went short NVDA on 2nd November) have added 250 bps to our equity returns this year.
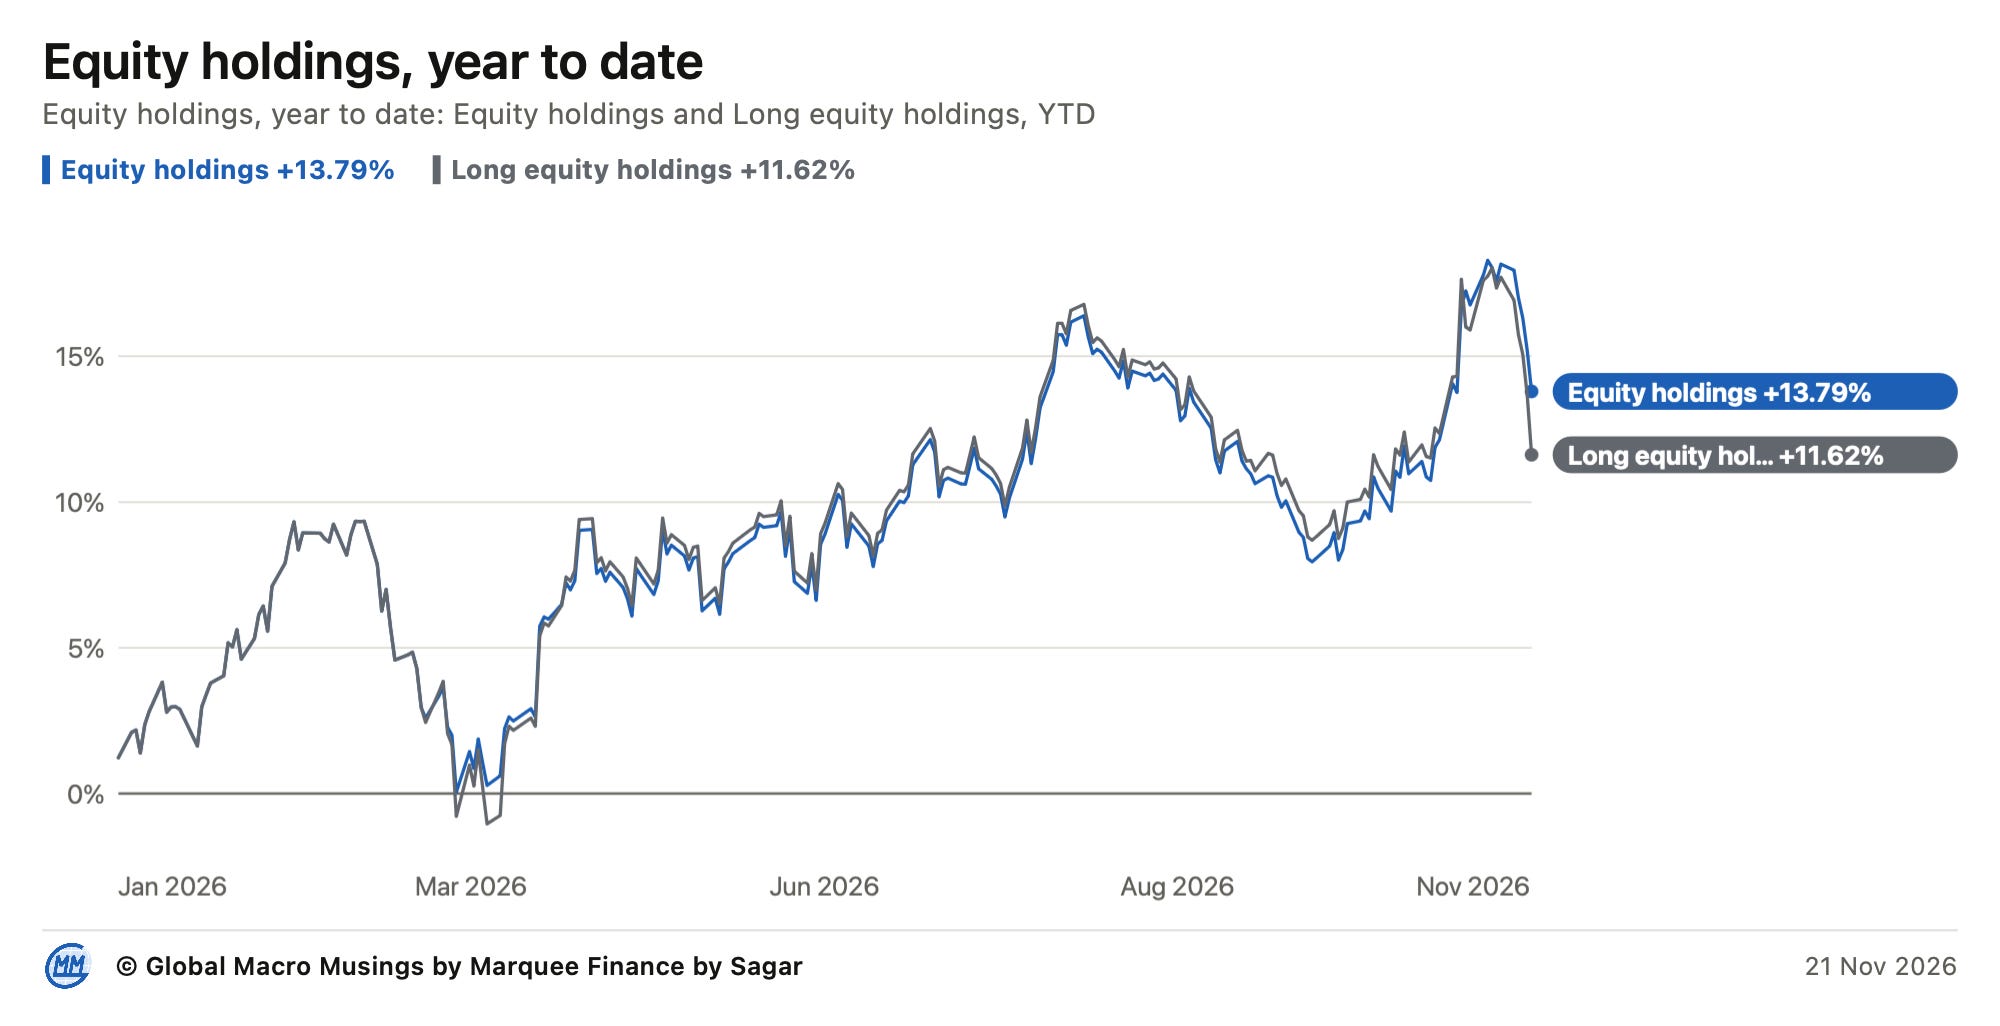
Despite a broad market carnage, we are up roughly 14% in our equity portfolio YTD.
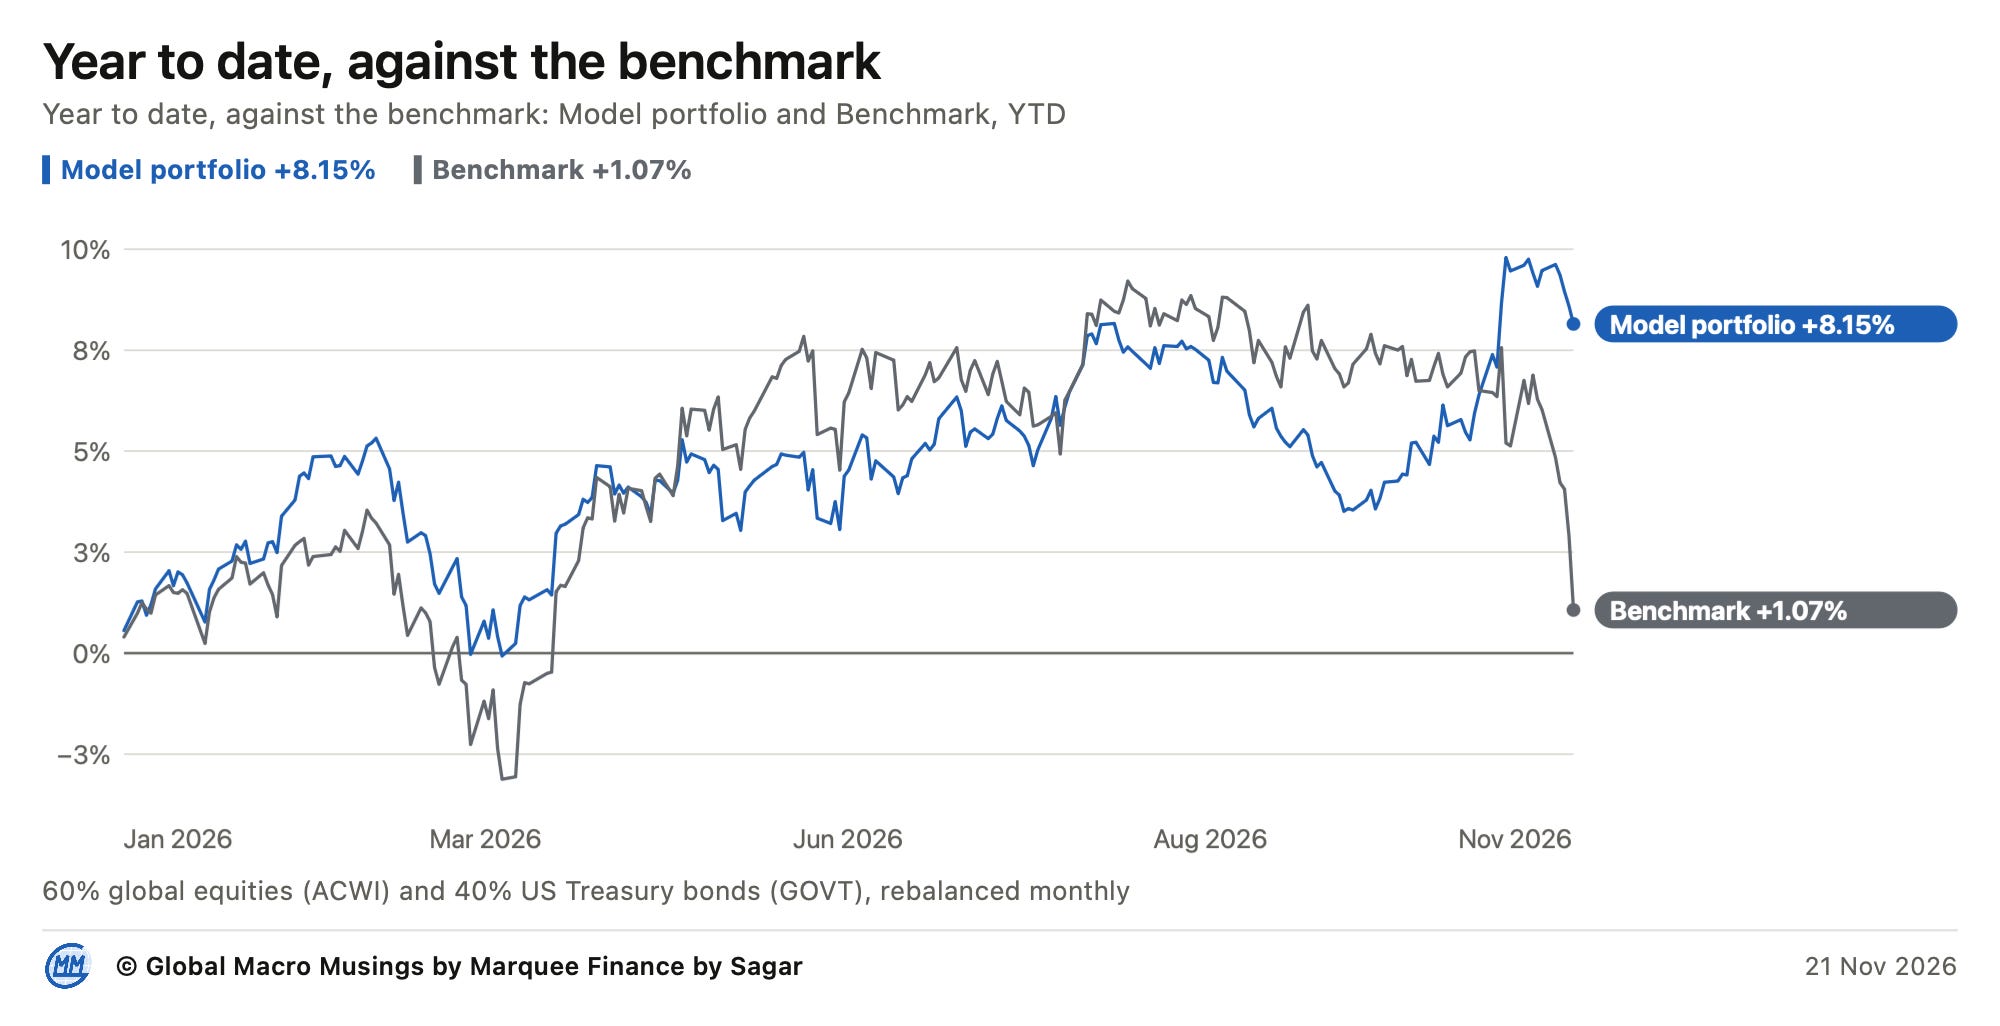
We were very vocal throughout last year that you should never keep your eggs in one basket, and that going all in on the AI trade will ultimately result in chaos.
We have been very well diversified and increased our bets on the Anti-AI trade in August (at that time, the ANT IPO was expected in late Sept.).
As a result, we are now outperforming the benchmark by over 700 bps YTD.
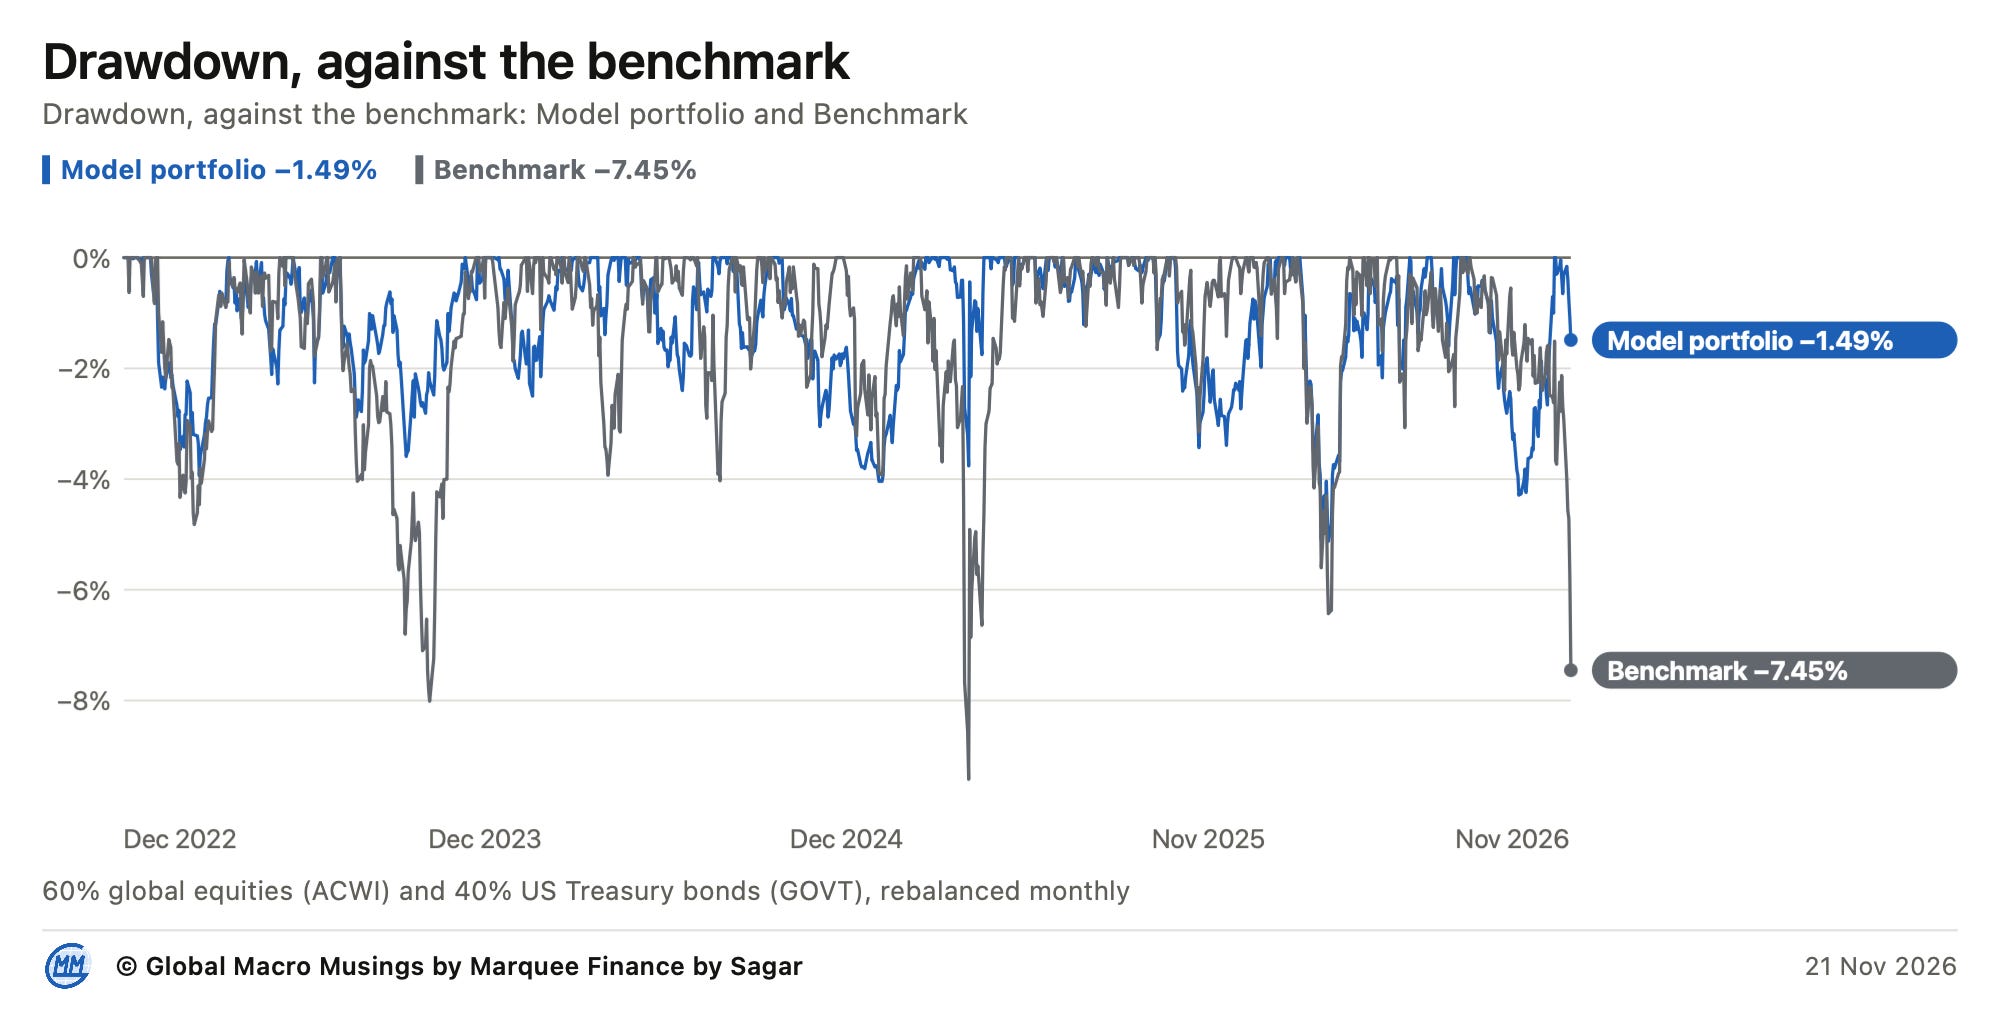
Total drawdown from ATHs is 150 bps, versus 7.45% for the benchmark (the third-largest drawdown for the benchmark in the last 4 years).
PS: Paid subscribers can log in to the terminal and find all the above data in the portfolio section.
The launch date for Global Macro Musings is 28th November. However, we are also launching the app (iOS and Android) simultaneously, so delays in Apple/Play Store approvals may slightly delay the launch.
Nonetheless, paid users get unrestricted access to the terminal.
Let us take a deep dive into the macro universe and comprehend the cross-asset price action!
US/Equities/Bonds/Gold & Silver/Oil/Dollar/BTC!
Today, we'll cover only retail sales and industrial production, since there is a lot to cover in the technical charts section.
Nominal retail sales came in at a strong 6.8% YoY (0.2% MoM).
Retail sales control group rose 0.6% MoM, beating expectations by 20 bps.
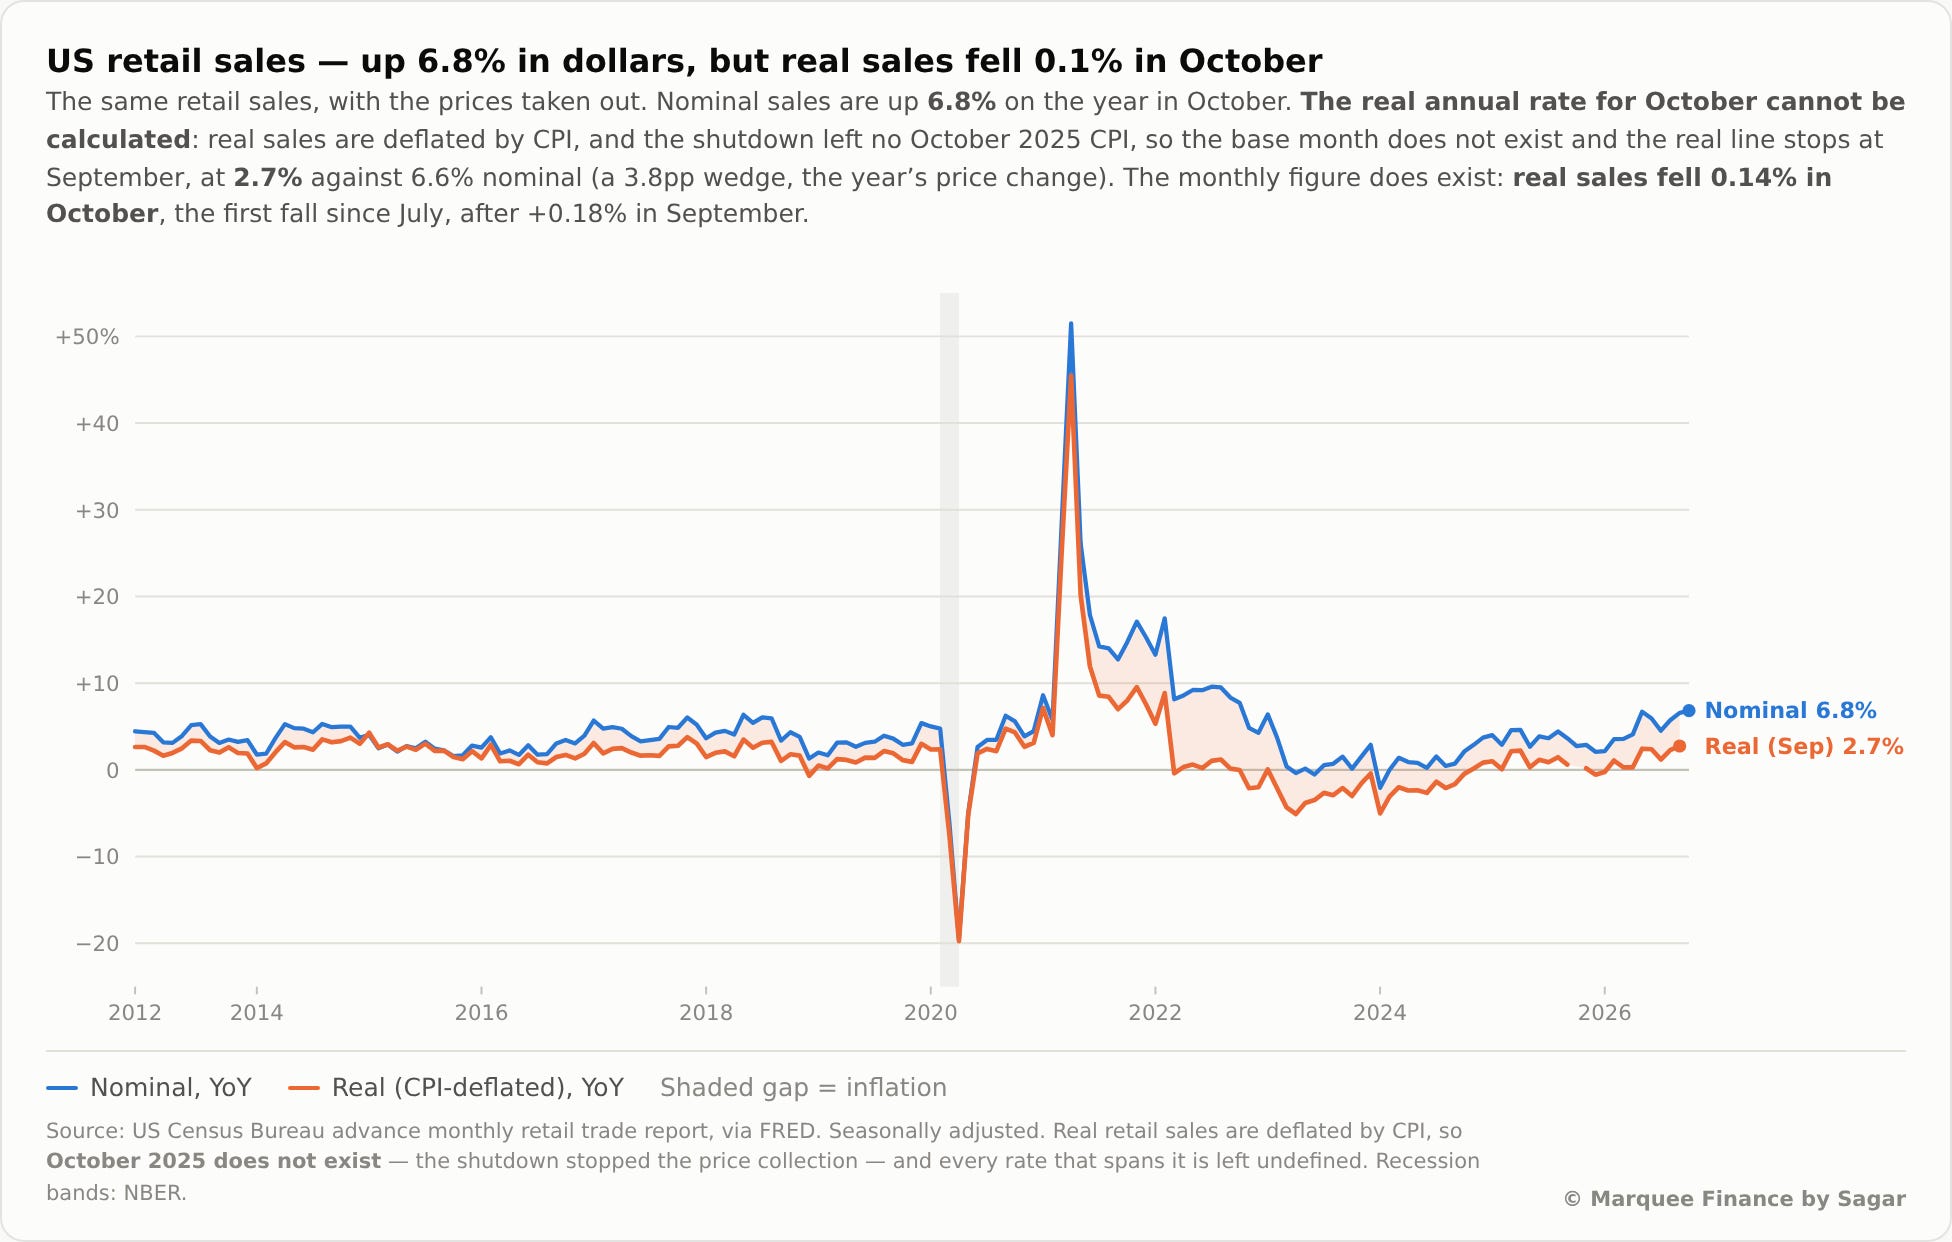
Nonetheless, real retail sales came in at -0.14% MoM, suggesting the measure is driven by value rather than volume.
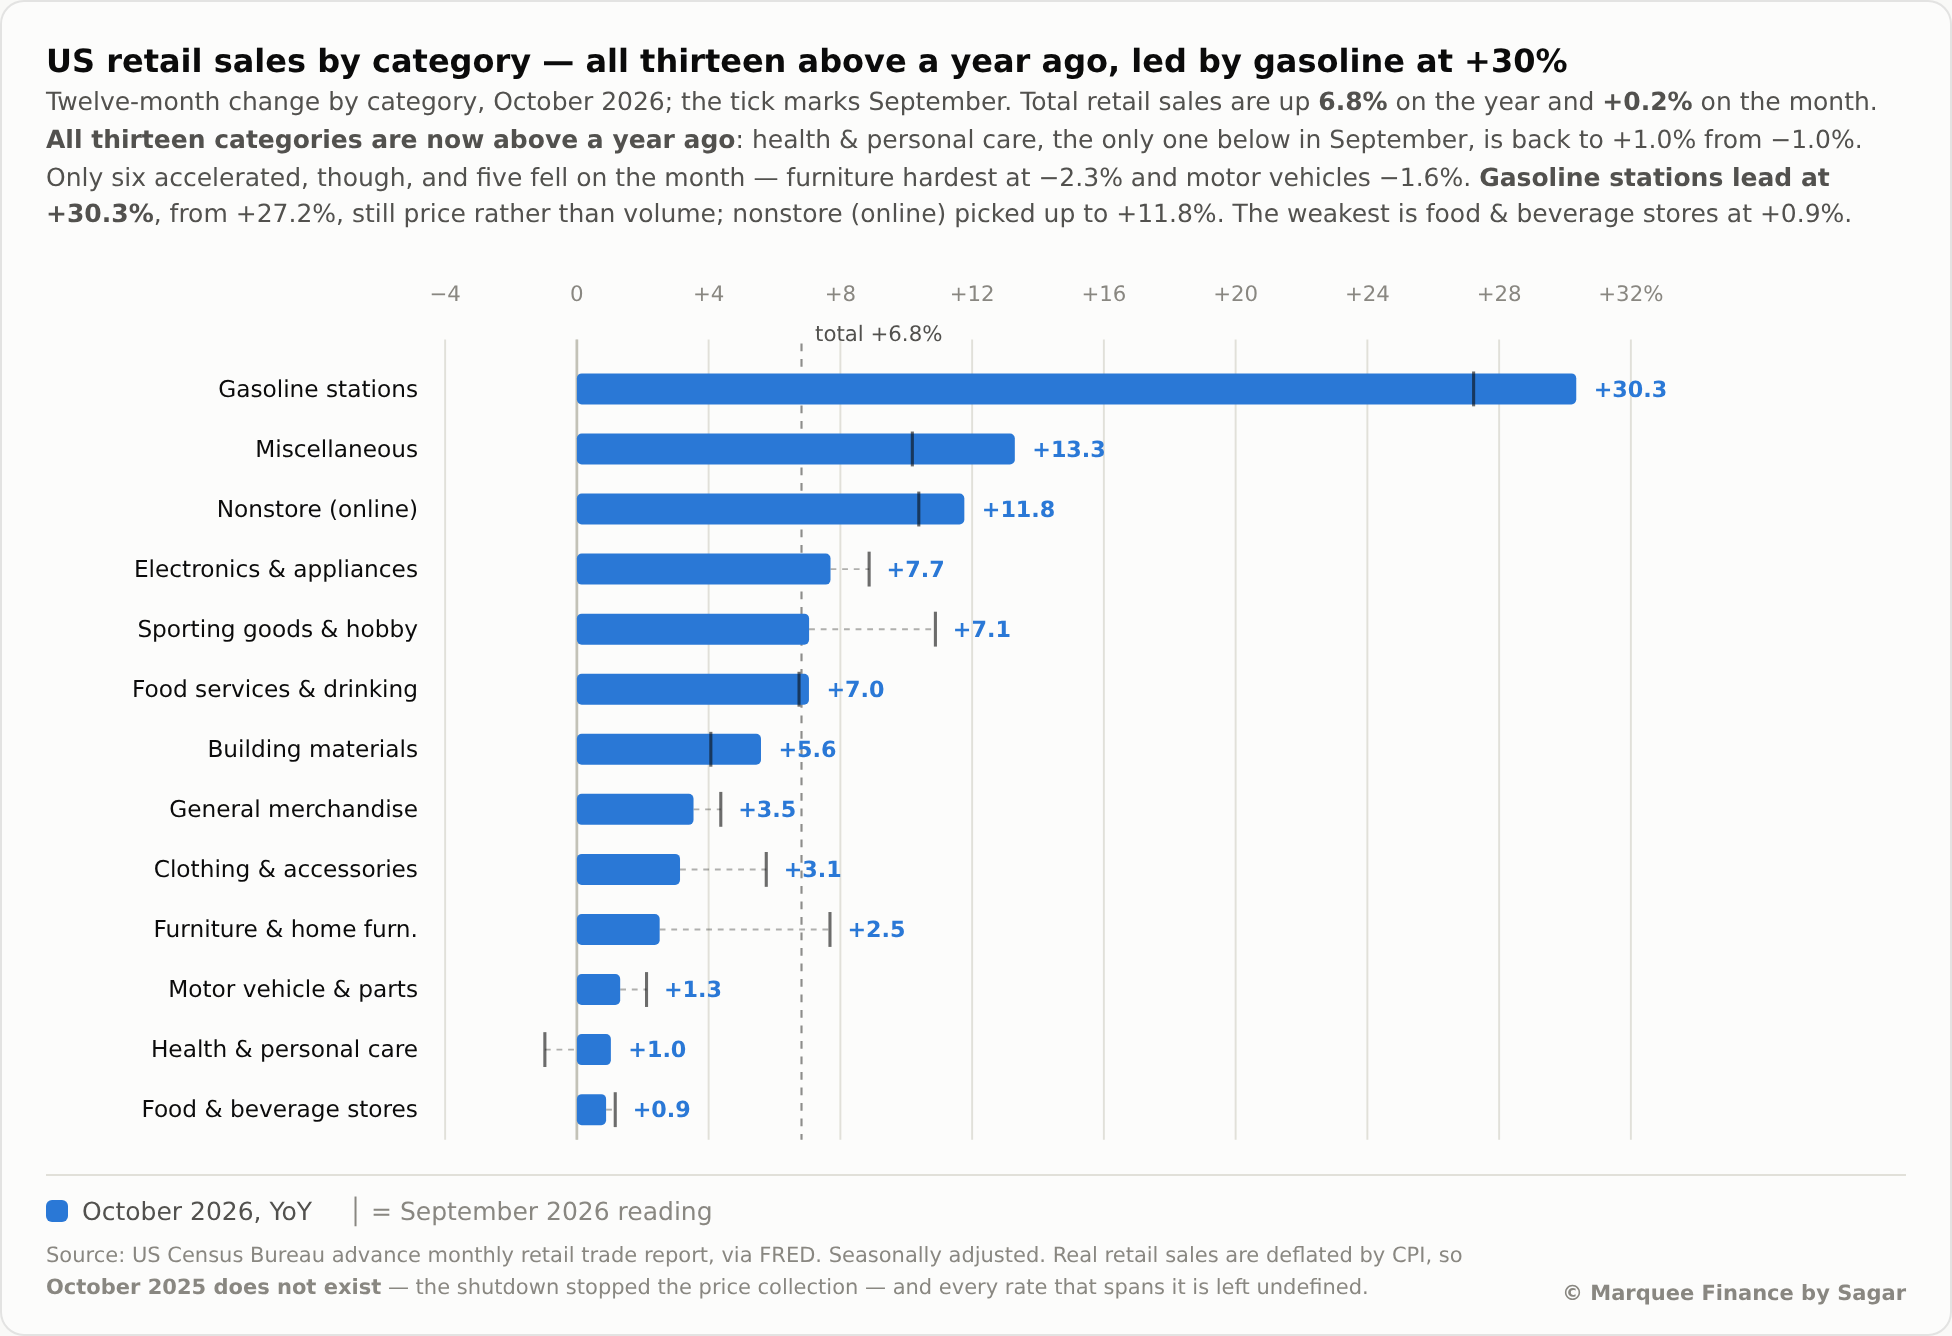
Higher gas prices have been boosting retail sales.
Surprisingly, all the categories came in higher. Even health and personal care, which was down 1%, also came in higher this time.
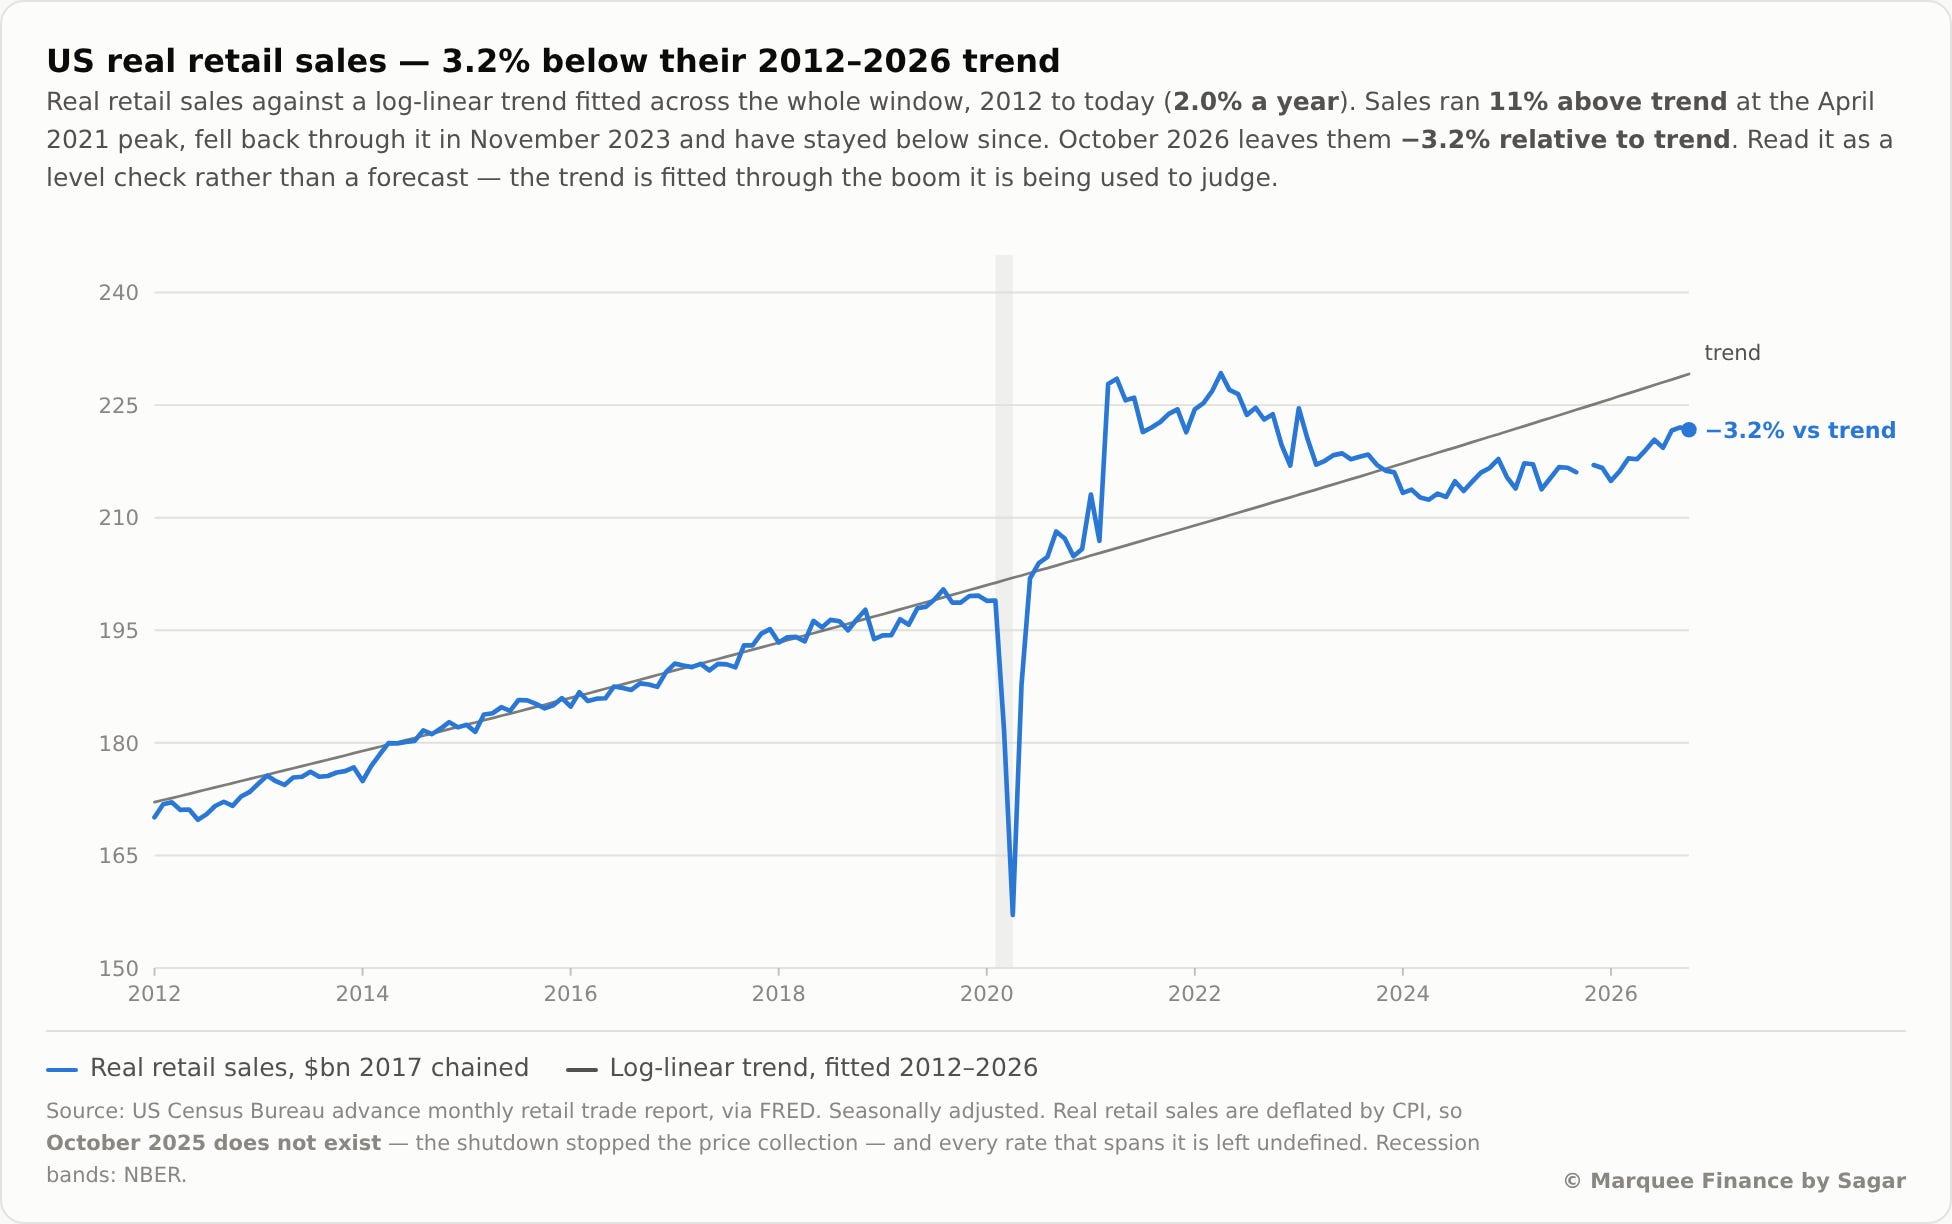
Nevertheless, real retail sales remain below the long-run trend line and have failed to recover as incomes fail to keep up with rising cost-of-living pressures.
US October industrial production fell 0.4%, missing the +0.1% consensus, but manufacturing rose in line with forecasts.
Total output fell 0.4% because utilities dropped 4.3%, while manufacturing rose 0.3%.
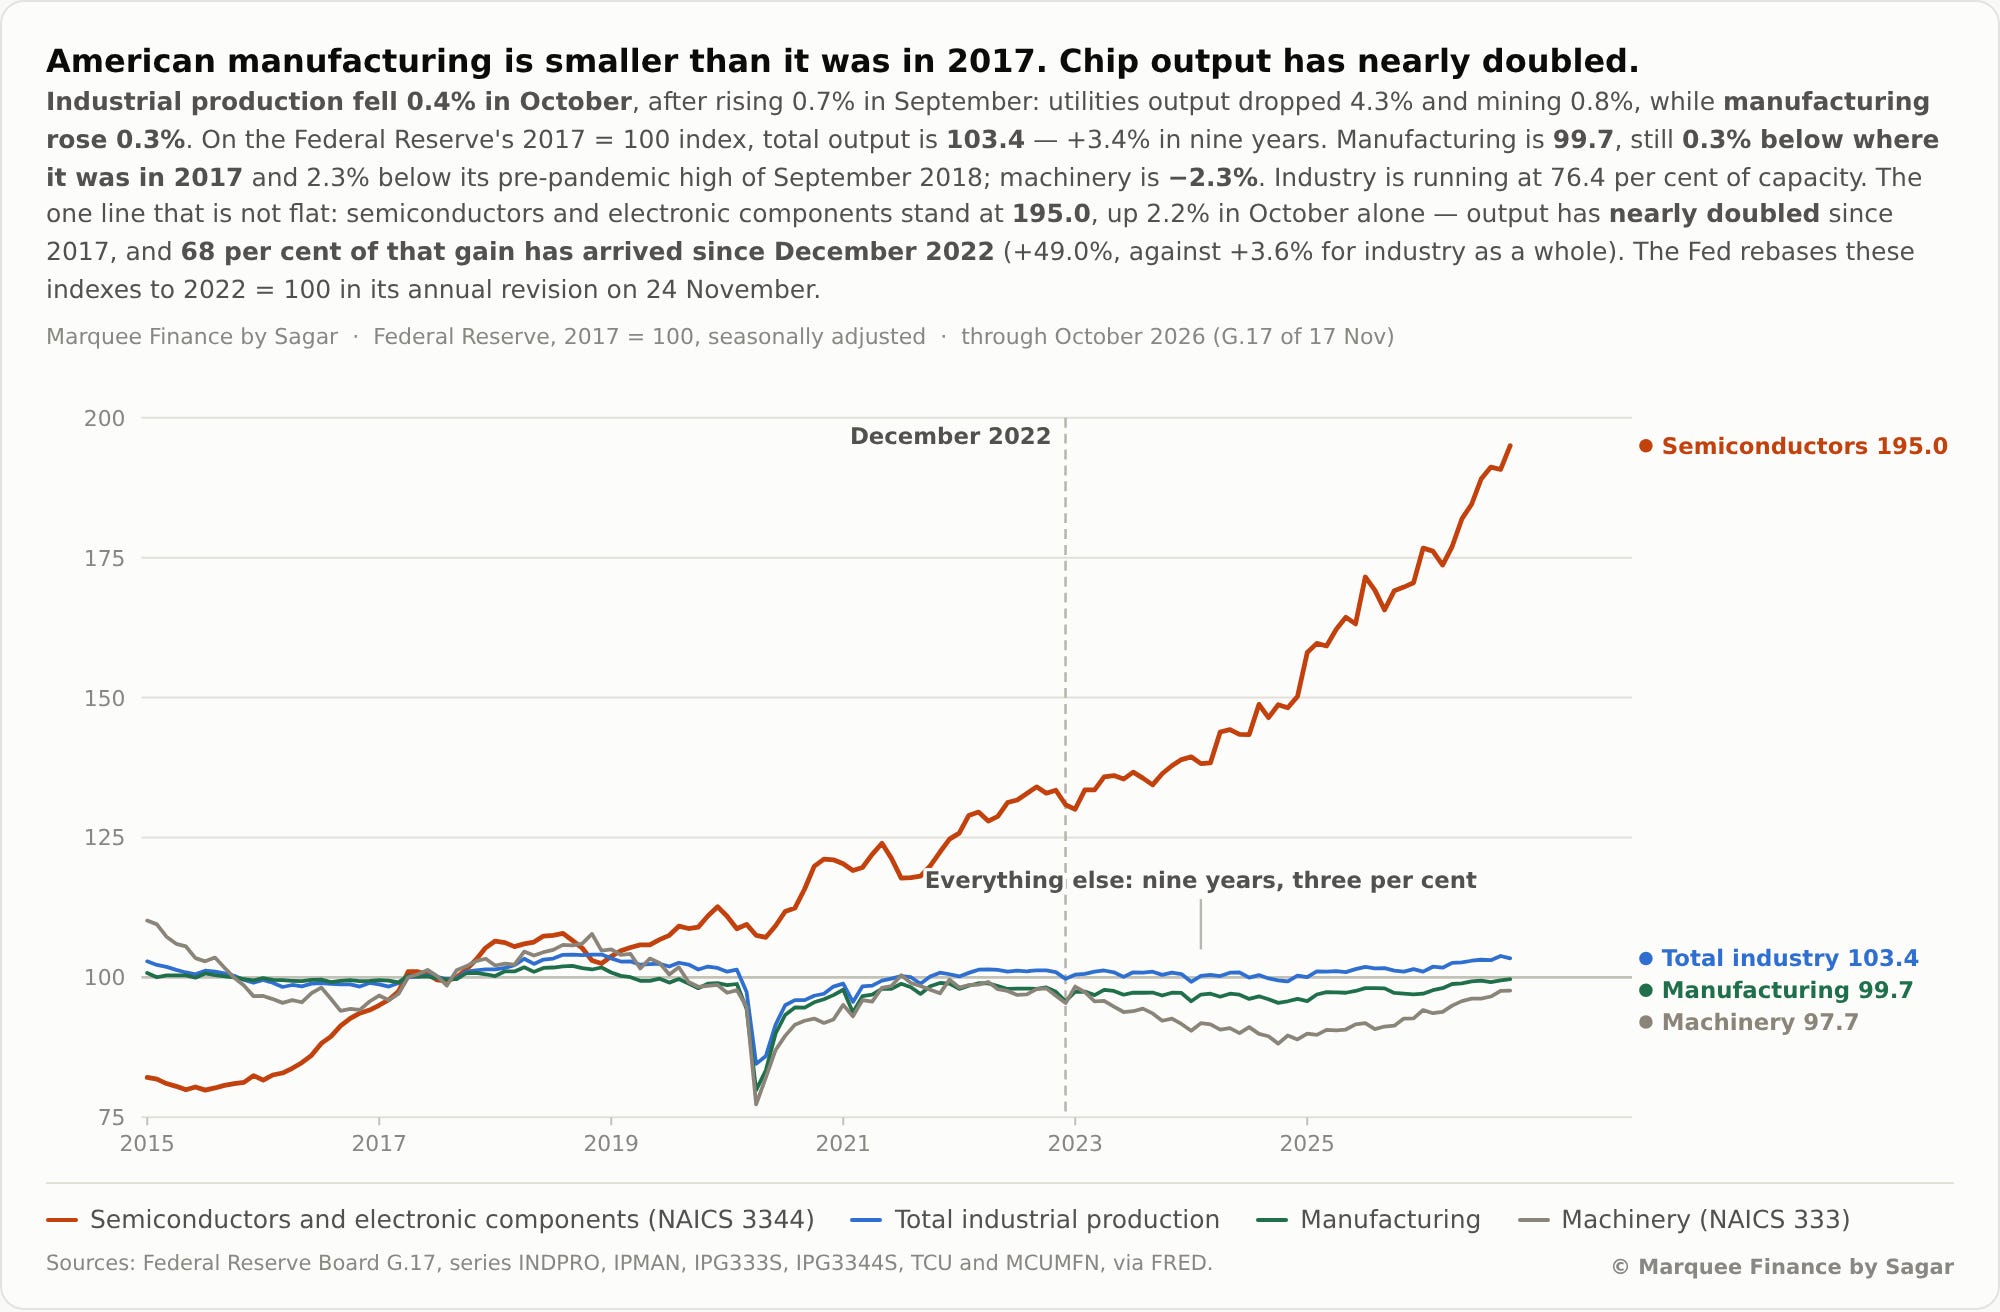
Since the launch of ChatGPT, semiconductors have led US industrial production higher.
In fact, while overall industrial production has been flat since 2017, output of semiconductors and electronic components has doubled.
Thus, if AI capex slows, the US faces a high probability of an economic slowdown (a scenario markets have begun to price in).
Equities!
The SPX weekly candle is one of the ugliest we have seen in the past few years.